
Journal of Geographical Sciences >
Spatiotemporal pattern of the dynamics in area, production, and yield of Aus rice in Bangladesh and its response to droughts from 1980 to 2018
|
Khondakar Arifuzzaman (1984-), PhD Candidate, specialized in geographic information system. E-mail: arifuzzaman@igsnrr.ac.cn |
Received date: 2021-01-20
Accepted date: 2022-02-08
Online published: 2022-12-25
Supported by
National Natural Science Foundation of China(41871349)
The Strategic Priority Research Program of the Chinese Academy of Sciences(XDA19040301)
Bangladesh is one of the most vulnerable countries to natural disasters such as droughts in the world. The pre-monsoon Aus rice in Bangladesh depends on rainfall and is threatened by increasing droughts. However, limited information on the changes in Aus rice as well as droughts hamper our understanding of the country’s agricultural resilience and adaption to droughts. Here, we collected all the official statistical data of Aus rice at the district level from 1980 to 2018, and examined the interannual variations of area, yield, and production. The results showed both area and production of Aus rice decreased significantly (61.58×10³ ha yr-1 and 17.21 ×10³ M. tons yr-1, respectively), while yield increased significantly (0.03 M. tons ha-1 yr-1). We also found a significantly increasing trend of droughts in 88% of area based on the Palmer Drought Severity Index (PDSI) data, especially in those rainfed agricultural areas. Moreover, we found significant positive correlations between PDSI and Aus rice area (production) in 33 (25) out of 64 districts. There is hardly a relationship between PDSI and yield, likely due to the improved management and increasing irrigated areas. Implementing continuous drought monitoring, combined irrigation (surface and groundwater) systems, and conservation and precision agriculture are highly recommended in these drought-prone districts to ensure food security in Bangladesh.
Key words: Aus rice; droughts; acreage; production; yield; PDSI; Bangladesh
KHONDAKAR Arifuzzaman , DONG Jinwei , LI Zhichao , DENG Xiangzheng , SINGHA Mrinal , RAHMAN Md. Mizanur , JIN Zhenong , WANG Shaoqiang , ZHEN Lin , XIAO Xiangming . Spatiotemporal pattern of the dynamics in area, production, and yield of Aus rice in Bangladesh and its response to droughts from 1980 to 2018[J]. Journal of Geographical Sciences, 2022 , 32(10) : 2069 -2084 . DOI: 10.1007/s11442-022-2037-y
Figure 1 The elevation map of the study area (Bangladesh, South Asia) |
Table 1 Different drought levels based on PDSI |
| Different categories | Non-drought | Incipient drought | Mild drought | Moderate drought | Severe drought | Extreme drought |
|---|---|---|---|---|---|---|
| Scale values | ≥ -0.49 | -0.50 to -0.99 | -1.00 to -1.99 | -2.00 to -2.99 | -3.00 to -3.99 | ≤ -4 |
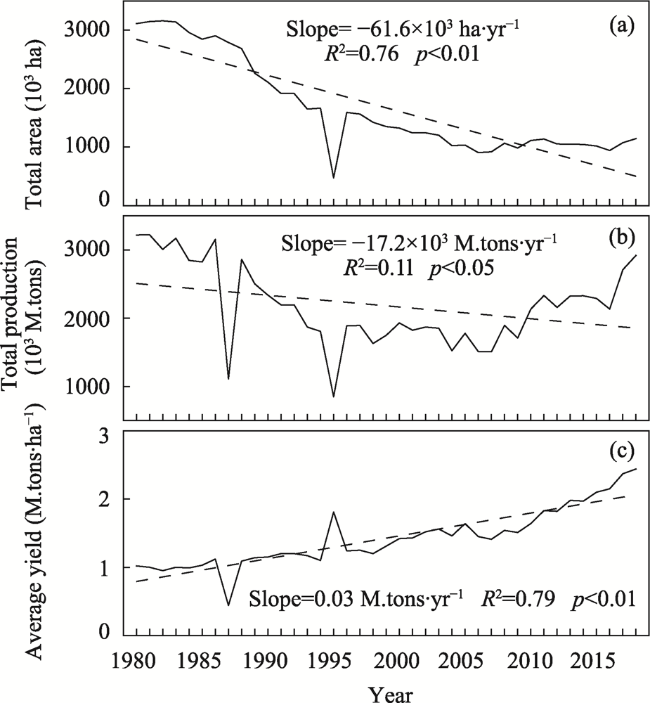
Figure 2 Interannual variations and trends of Aus rice total area (a), total production (b), and average yield (c) in Bangladesh from 1980 to 2018 |
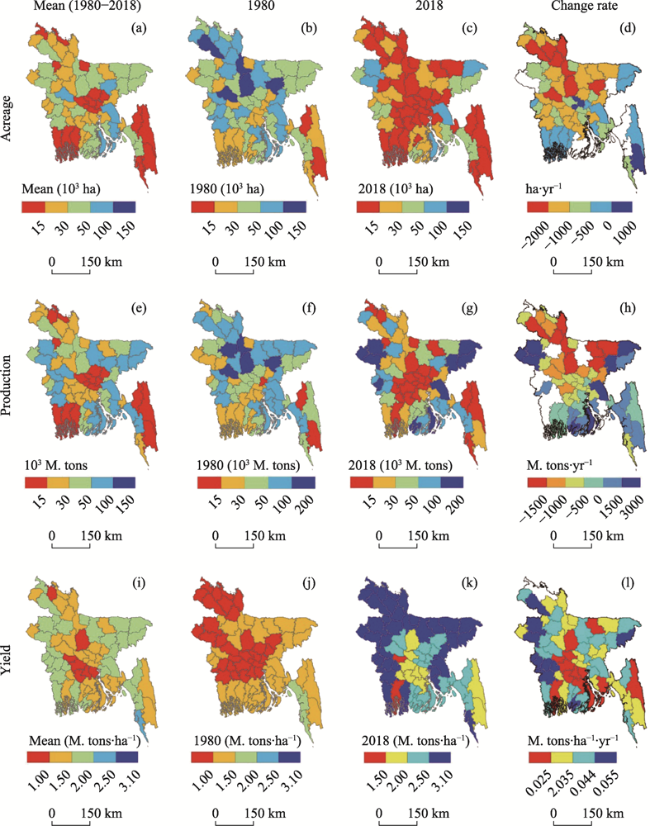
Figure 3 The mean (1980-2018), baseline (1980), recent (2018), and trends of Aus rice acreage, production, and yield at the district level during 1980-2018. The white color in column 4 represents the districts with non-significant trend of change rate |
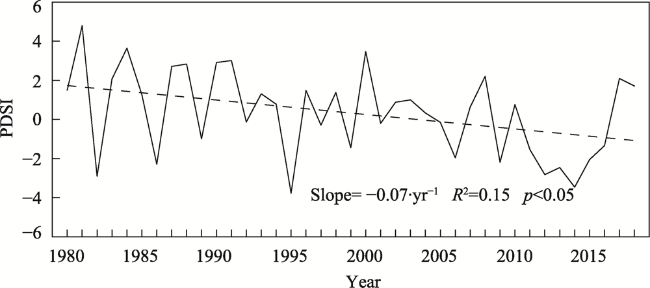
Figure 4 Interannual variation of PDSI in Bangladesh in the pre-monsoon season during 1980-2018. The downward linear trend represents the decreasing trend of PDSI that ascertains the increasing drought in Bangladesh |
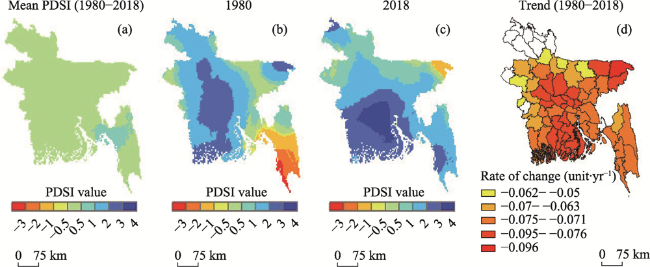
Figure 5 The district-level mean, baseline (1980), recent (2018), and change rate (1980-2018) of drought severity in the pre-monsoon season in Bangladesh during 1980-2018. The white color represents the districts with non-significant trend of change rate |
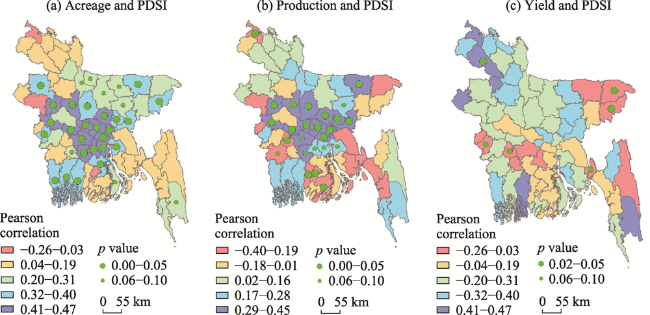
Figure 6 District-level Pearson correlation between area (a), production (b), yield (c) and PDSI |
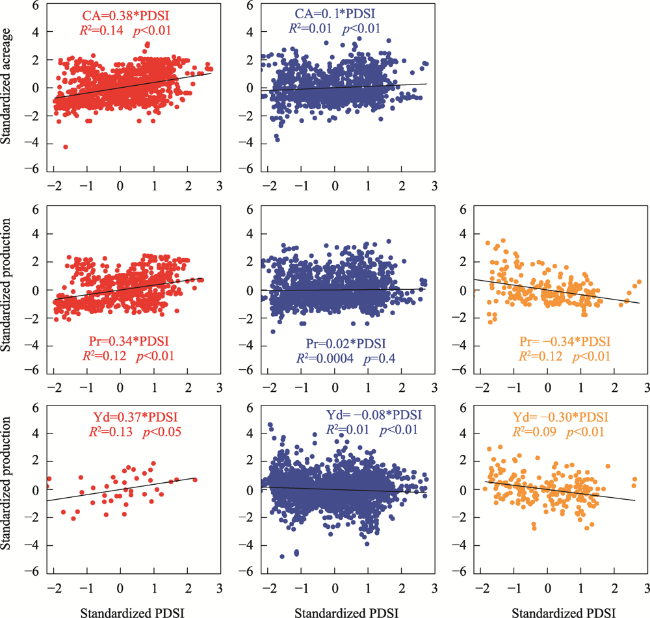
Figure 7 Linear regression between standardized PDSI and standardized acreage (a, b), standardized production (c, d, and e), and detrended and standardized yield (f, g, and h). The districts with positive correlation, no correlation, and negative correlation are presented in column 1, column 2, and column 3, respectively. CA, Pr, and Yd represent the standardized area, standardized production, and detrended and standardized yield, respectively. |
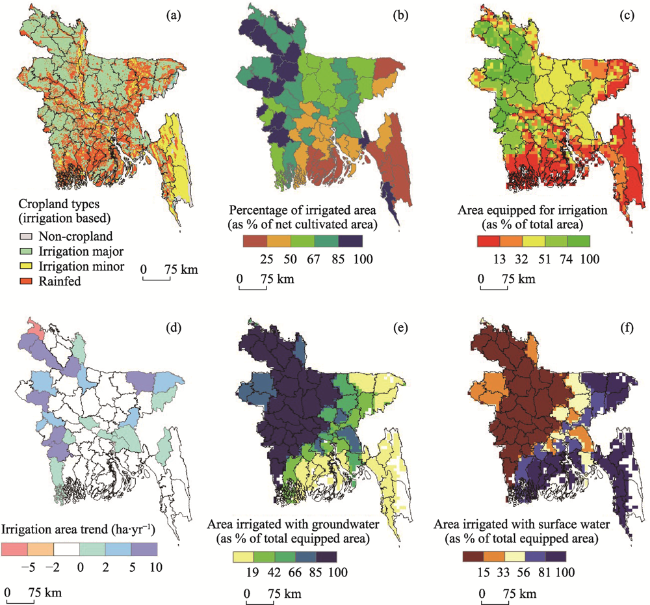
Figure 8 Map of irrigated and rain-fed cropland in Bangladesh (a), irrigated lands in 2016 (referring to the district-level percentage of total acreage) (b), area equipped for irrigation (referring to the percentage of total area with significant trends) (c), trend of irrigation coverage increase (2011-2016) (only significant trends are presented) (d), area equipped with groundwater (e), and area equipped with surface water (f) (referring to the percentage of total equipped area) |
| [1] |
|
| [2] |
|
| [3] |
|
| [4] |
|
| [5] |
|
| [6] |
|
| [7] |
|
| [8] |
FAO, 2019. World Food and Agriculture - Statistical Pocketbook 2019. Rome: Food and Agriculture Organization of the United Nations. 248pp.
|
| [9] |
FAO, 2020. World Food and Agriculture - Statistical Yearbook 2020. Rome: Food and Agriculture Organization of the United Nations. 350pp.
|
| [10] |
|
| [11] |
|
| [12] |
|
| [13] |
|
| [14] |
|
| [15] |
|
| [16] |
|
| [17] |
|
| [18] |
|
| [19] |
|
| [20] |
|
| [21] |
|
| [22] |
|
| [23] |
|
| [24] |
|
| [25] |
|
| [26] |
|
| [27] |
|
| [28] |
|
| [29] |
|
| [30] |
|
| [31] |
|
| [32] |
|
| [33] |
|
| [34] |
|
| [35] |
|
| [36] |
|
| [37] |
|
| [38] |
|
| [39] |
|
| [40] |
|
| [41] |
|
| [42] |
|
/
| 〈 |
|
〉 |
