Research Articles

Flow resistance adjustments of channel and bars in the middle reaches of the Yangtze River in response to the operation of the Three Gorges Dam

  • HU Yong , 1 ,
  • DENG Jinyun 1 ,
  • LI Yitian , 1, * ,
  • LIU Congcong 2 ,
  • HE Zican 1
Expand
  • 1.State Key Laboratory of Water Resources and Hydropower Engineering Science, Wuhan University, Wuhan 430072, China
  • 2.CCCC Second Harbour Engineering Co Ltd, Wuhan 430040, China
* Li Yitian (1957-), Professor, E-mail:

Hu Yong (1996-), PhD Candidate, E-mail:

Received date: 2021-11-15

  Accepted date: 2022-03-09

  Online published: 2022-12-25

Supported by

National Natural Science Foundation of China(51779185)

National Key Research and Development Program of China(2018YFC0407201)

Abstract

Since the Three Gorges Dam (TGD) was put into operation, the flood water level at an identical discharge rate has not displayed a decreasing trend along the middle reaches of the Yangtze River (MYR). The flow resistance variations of the channel and bars in response to the operation of the TGD remain poorly understood, despite the importance of understanding these for water disaster mitigation and water environment regulation. Herein, the impacts of the TGD on the downstream flow resistance of the channel and bars in the MYR were analyzed using systematic surveys of hydrological datasets, cross- sectional profiles, sediment datasets, and remote sensing images, during different periods. Under the actual natural conditions in the MYR, a modified semi-empirical formula, which considered the grain, dune resistance, as well as the topographic features of the riverbed, was proposed to predict the channel resistance. Furthermore, the effect of various dam-control flow and sediment elements on the variation in different flow resistance components, and the corresponding relationships among them were investigated. Results showed a decline in the comprehensive, channel, and bar resistances as the discharge increased, whereas there was a slight increase when reaching the bank-full discharges. Notably, the bar resistance occupied 65%, while the channel resistance, in which dune resistance was much larger than grain resistance, contributed 35% to the comprehensive resistance. In addition, while flow resistance rose over time, there was a decline as the distance from the TGD increased. In conclusion, the increased dune and bar resistances, interpreted by the fluctuated channel longitudinal profile and growing vegetated area on bars, were the dominant factors preventing the flood water level from dropping.

Cite this article

HU Yong , DENG Jinyun , LI Yitian , LIU Congcong , HE Zican . Flow resistance adjustments of channel and bars in the middle reaches of the Yangtze River in response to the operation of the Three Gorges Dam[J]. Journal of Geographical Sciences, 2022 , 32(10) : 2013 -2035 . DOI: 10.1007/s11442-022-2034-1

1 Introduction

The construction of a large dam is expected to profoundly affect the characteristics of downstream flow and sediment transport by changing the normal seasonal timing and magnitude of flow stages and drastically decreasing the concentration of sediment transported in flows (Makaske et al., 2012; Greene and Knox, 2014; Lyu et al., 2019). Generally, upstream damming results in significant erosion downstream, in which the erosion intensity is uneven among the channel and bars, leading to different water level responses (Petts and Gurnell, 2005; Fang et al., 2012). Hence, to prevent flooding, scientists pay a close attention to changes in high water levels after damming.
Many scientists have investigated cases when after damming, the dry water level decreased but the flood water level dropped by relatively small amount or even increased downstream (Surian and Rinaldi, 2003; Slater, 2016). For instance, the flood water level precipitously increased by 1.1 m in Kansas City, U.S.A., despite a flood water discharge in 2011 that was smaller than that in 1970 (Carle et al., 2015). Furthermore, observations of more than 20 rivers in Germany showed that each of them had a unique trend in terms of their water levels during flooding (Bormann et al., 2011). Moreover, the statistics of Graf (2006) on 36 dam-built rivers in the United States showed that regulated reaches with 50% smaller high-flow channels experienced increased flood water levels. However, the consequences of the flood disasters caused by the flooding high water level are immeasurable. Therefore, many scholars have focused on studying the cases where the flood water level did not decrease downstream of the dam.
In particular, since the Three Gorges Dam (TGD) was put into operation (the largest integrated hydro-project in the world), the flood water level at an identical discharge rate has not displayed a decreasing trend in the middle reaches of the Yangtze River (MYR) (Han et al., 2017; Yang et al., 2017b). Thus far, previous studies reported that the water level variations were mainly related to dam operation, flow resistance, channel erosion, and waterway protecting projects (Chai et al., 2020). The common conclusion was that the increased flow resistance is the dominant factor that prevents the flood water level from decreasing. While most previous studies on flow resistance have focused on the comprehensive resistance, the resistance of channel and bars remains poorly studied. Moreover, it is difficult to determine the cause of the water level drop during dry seasons, which does not occur in flood seasons, through comprehensive resistance alone, and there is a need to reveal the variations and impacts of channel resistance and bar resistance in this regard. During the post-TGD period, as the riverbed eroded and cross-sectional area increased, the dry water level dropped with the same discharge, indicating that the change in channel resistance did not offset the impact of the riverbed erosion. In addition, the flood water level did not decrease, suggesting that bar resistance might have played a significant role.
In general, flow resistance in the MYR can be primarily divided into channel (i.e., grain and dune resistances) and bar resistances (Yen, 2002; Zhou et al., 2018). Researchers in hydraulics and river dynamics have proposed through theoretical generalizations or laboratory experiments a variety of methods for calculating channel resistance. These are generally divided into two categories: one based on flow characteristics (Alam and Kennedy, 1969; Chang, 1970; Peterson and Peterson, 1988) and the other on riverbed topography characteristics (Van Rijn, 1982, 1984; Julien et al., 2002; Aberle et al., 2010). However, when these formulas were applied to the Yangtze River (Huang et al., 2004; Liu et al., 2020), they were mostly used to estimate the comprehensive resistance and were unable to calculate the bar resistance, an important component during the flood period, as they lacked the theoretical basis for the calculation (Carling et al., 2020). Consequently, it is of great importance to determine a formula that can calculate the grain and dune resistance during flooding.
Thus far, there have been detailed studies associating vegetation resistance with the biomechanics of plants, flow velocity, and water depth (Petryk and Bosmajian III, 1975; Naden et al., 2006). However, these approaches have not been widely applied in the Yangtze River mainly because (1) detailed hydraulic and plant information was lacking, while large scale surveying of bar vegetation during the flood season is extremely challenging (O’Hare et al., 2010); (2) methods were designed based on indoor or small-scale field experiments, and it was uncertain if they could be applied to large alluvial rivers like the Yangtze River. Hence, it was difficult to directly infer the bar resistance from the existing studies. However, a relatively suitable method would be to indirectly calculate the bar resistance from the comprehensive and channel resistance.
To understand why the flood water level does not drop on the basis of comprehensive cross-sectional profiles, hydrological datasets, remote sensing images, and sediment datasets of the MYR in the post-TGD period in this study, we analyzed the effects of the TGD operation on the flow resistance of channel and bars. The objectives of this study were to (1) clarify the variation trends of the flow resistance as discharge, time, and space change; (2) explore the factors and mechanisms controlling channel and bar resistances; and (3) determine the dominant factors controlling the flood water levels and their respective contributions.

2 Study area

The Yangtze River is the third-longest river in the world with a total length of ~6300 km and is generally divided into the upper, middle, and lower reaches based on different hydrological characteristics and geographical settings (Cao and Wang, 2015; He et al., 2021). The MYR studied herein is located immediately downstream of the TGD, reaches ~955 km between Yichang and Hukou, and includes the floodplain-type lake of Dongting (Xia et al., 2017) (Figure 1). In course of the TGD operation, the regime of sediment and flow was significantly altered, resulting in the channel adjustment in the MYR (Xia et al., 2016). From 2003 to the present, the TGD has been impounded from an elevation of 135-139 m to an elevation of 145-175 m. (Zheng, 2016) (Table 1).
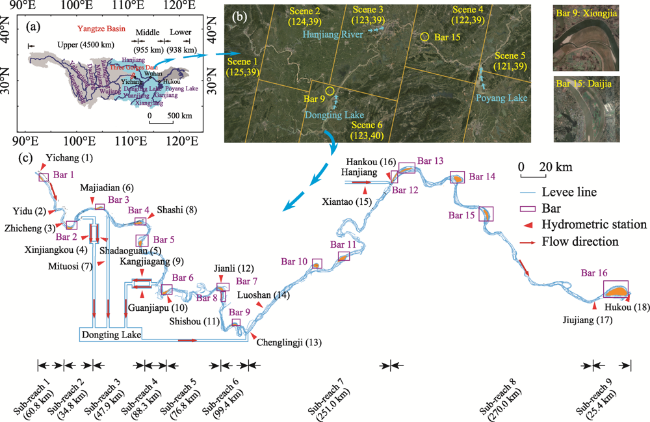
Figure 1 Sketch map of the study area: (a) Yangtze River Basin, (b) the layout of the remote images, and (c) the middle reaches of the Yangtze River with locations of hydrometric stations, bars, and diversion inlets
Table 1 Essential information on 18 hydrometric stations, 16 bars and 9 sub-reaches in the middle reaches of the Yangtze River and three operation periods of the Three Gorges Dam
Station number Station name Bar number Bar name Channel number Included reaches Length
1 Yichang 1 Yanzhi Sub-reach 1 Yichang-Zhicheng 60.8 km
2 Yidu 2 Guan Sub-reach 2 Zhicheng-Majiadian 34.8 km
3 Zhicheng 3 Liutiao Sub-reach 3 Majiadian-Shashi 47.9 km
4 Xinjiangkou 4 Lalin Sub-reach 4 Shashi-Shishou 88.3 km
5 Shadaoguan 5 Tuqi Sub-reach 5 Shishou-Jianli 76.8 km
6 Majiadian 6 Ouchikou Sub-reach 6 Jianli-Chenglingji 99.4 km
7 Mituosi 7 Wugui Sub-reach 7 Chenglingji-Hankou 251 km
8 Shashi 8 Dama Sub-reach 8 Hankou-Jiujiang 270 km
9 Kangjiagang 9 Xiongjia Sub-reach 9 Jiujiang-Hukou 25.4 km
10 Guanjiapu 10 Zhong
11 Shishou 11 Fuxing
12 Jianli 12 Hankou
13 Chenglingji 13 Tianxing
14 Luoshan 14 Dongcao
15 Xiantao 15 Daijia Period number Impounded water level (m) Included years
16 Hankou 16 Zhangjia 1 - Before 2002
17 Jiujiang 2 135.0-139.0
144.0-156.0
145.0-172.8
2003-2005
2006-2007
2008
18 Hukou 3 145.0-171.4
145.0-175.0
2009
2010-present
The MYR area selected in this study is shallow and wide, and can be further segmented into nine sub-reaches (Yichang-Zhicheng, Zhicheng-Majiadian, Majiadian-Shashi, Shashi- Shishou, Shishou-Jianli, Jianli-Chenglingji, Chenglingji-Hankou, Hankou-Jiujiang, and Jiujiang-Hukou; Figure 1 and Table 1) on the basis of the local geographical settings and channel patterns. Generally, the sediment composition of the bed tends to become finer along the MYR, changing from pebbles, gravel, and sand to mostly sand (Wang and Xu, 2018). Specifically, sub-reach 1 (i.e., Yichang-Zhicheng Reach) is a relatively straight or slightly curved gravel-sand channel, with a grain size of ~64 mm. Owing to the natural confinement (i.e., bank and hill), the channel planimetric configuration of this sub-reach remains stable. The downstream sub-reaches 2-9 are located in a vast alluvial plain, and fine and the riverbed consists of moderately fine sand of, with a median grain diameter of 0.22 mm (CWRC, 2020). Overall, the MYR is predominately a meandering channel with plenty of bars, and the majority of its banks consist of a lower thin sand and an upper clay layer (Lyu et al., 2020).
In addition, runoff and sediment load in the MYR originate from the mainstream of the Upper Yangtze River and tributaries in the MYR. Sediment and flow fluxes in every sub-reach are measured at 18 hydrometric stations (Figure 1 and Table 1), which are all located within the study area. Moreover, four branches link the mainstream of the MYR with the Dongting Lake through the diversion outlets of Taipingkou, Songzikou, and Ouchikou and the inlet of Chenglingji, while one branch links the MYR with the Hanjiang River, as shown in Figure 1.

3 Material and methods

3.1 Data source

To determine the variation in channel and bar resistances of the study area, hydrological and sediment data (i.e., daily mean discharges, water levels, and sediment concentrations at the hydrometric stations), topographical data (i.e., the one-dimensional cross-sectional profiles at 450 specific locations per year and two-dimensional terrain in 2015), and riverbed sediment grainsize in the MYR were obtained from the Changjiang Water Resources Commission (CWRC), as shown in Table 2.
Table 2 Sources of measurements
Data type Number (station/bar/channel) Period of record Sources
Daily discharge Stations 1-18 1991-2015 CWRC
Daily water level Stations 1-18 1991-2015 CWRC
Daily sediment concentration Stations 1-18 1991-2015 CWRC
Surveyed profiles Sub-reaches 1-9 (450 cross-section profiles per year) 2004, 2006, 2009, 2012, 2015 CWRC
Surveyed terrains Sub-reaches 1-9 (two-dimensional terrain) 2015 CWRC
Medium diameters of bed load Stations 1, 3, 8, 12, 14, 16 2003-2019 CWRC
Landsat images Bars 1-16 1993, 2002, 2006, 2009, 2015 USGS
Landsat-8 OLI, Landsat-7 ETM+, and Landsat-5 TM images were obtained from the United States Geological Survey (https://www.usgs.gov/) for the period from 1993 to 2015 to calculate and analyze bar area variations. Six specific scenes were acquired to cover the entire scope of the study reach (the paths and rows for each scene are shown in Figure 1). All Landsat images had a spatial resolution of 30 m. Sixteen relatively stable and large bars in the MYR were selected for analyses in this study (Figure 1 and Table 1). Moreover, the study focused on the bar resistance during flooding, while flood season (i.e., May-October) images were selected to reflect the real bar environment.

3.2 Determination of comprehensive resistance

Manning’s roughness coefficient (n) is a measure of the frictional resistance in natural channels and is usually used when sufficient hydrometric data are available to calibrate it. Measuring the frictional resistance in natural channels often includes compound sections with a variable roughness over the main channel and overbank sections (Karim, 1995; Ferguson, 2010). In general, reversing the observation data of natural rivers to determine the comprehensive resistance is regarded as a direct and accurate method (Coon, 1998). Therefore, the comprehensive resistance in the MYR was computed by a numerical model using MIKE suite of software, with the observed cross-sectional profiles, daily average discharge, and water level using as the river boundary conditions. The unsteady flow momentum and continuity equations are the governing equations of the model (Equations 1 and 2) (De St Venant, 1871), which are discretized by the finite difference method. A standard step method was applied to solve equations 1 and 2 (Xia et al., 2010):
$\frac{\partial A}{\partial t}+\frac{\partial Q}{\partial x}=q$
$\frac{\partial Q}{\partial t}+\frac{\partial }{\partial x}\left( \frac{{{Q}^{2}}}{A} \right)+gA\frac{\partial h}{\partial x}+{{n}^{2}}g\frac{Q\left| Q \right|}{A{{R}^{4/3}}}=0$
where x is the distance coordinate, A is the cross-sectional area, Q is the flow discharge, t is the time coordinate, h is the water depth, q is the side inflow, R is the hydraulic radius, and g is the gravitational acceleration.

3.3 Predicting channel resistance based on the improved approach

Traditionally, the channel resistance nc is partitioned between the grain resistance ng and dune resistance nd (Afzalimehr et al., 2010). Grain resistance is generated because of the shear stress applied to individual grains on the riverbed, whereas dune resistance is generated by the pressure differential as well as energy losses in the large eddy located on the lee side of dunes and ripples associated with irregularities in the shape of the channel. It is, therefore, important to consider the combined effects of dune and grain resistances on channel resistance.
Based on the analysis of reliable flume and field data, Van Rijn (1984) established a semi-empirical relationship for predicting channel resistance as a function of bedform geometry. Although van Rijn’s approach for calculating the channel resistance was calibrated based on experiments, it is still empirically directed by a certain degree of physical reasoning and yields a dimensionally consistent relationship (Darby, 1999). In the MYR, the equivalent roughness heights calculated using the van Rijn approach are between 0.01 and 0.3 m. However, the field measurements of dunes are between 4 and 8 m, which is significantly different from the original physical conditions that van Rijn applied. Thus, considering the actual physical background, the dunes in the van Rijn approach refer to the secondary dunes superposed on top of the large primary dunes in the MYR, where the magnitude of primary dunes is approximately equal to the channel longitudinal profile fluctuations (Wang et al., 2007; Jiang et al., 2021). Moreover, the primary dunes are the large dunes that dominate the bedform population, while the resistance caused by secondary dunes can be neglected due to the magnitude differences (Julien et al., 2002).
In this study, we applied a slightly modified approach because the channel resistance considers the grain and dune resistance as well as the topographic features of the riverbed. Furthermore, the Manning’s coefficient is then computed through variants of the Colebrook-White equation (Sonnad and Goudar, 2006). Thus, the channel resistance can be characterized as follows:
${{n}_{c}}=\frac{{{R}^{\frac{1}{6}}}}{\gamma \cdot \log \left( \frac{12R}{k} \right)}$
where γ is the fitting parameter in an approximately linear relationship with flow discharge Q, and k is the equivalent roughness height, which can be divided into the contributions of grain (kgrain) and dune (kdune):
$\gamma =aQ+b$
$k={{k}_{grain}}+{{k}_{dune}}$
where a and b are the unknown coefficients related to the flow discharge Q and geographical conditions of the study reach, respectively. After calibration, the suggested value of a was between -5×10⁻⁴ and -3×10⁻⁴, b was between -32 and -18, and γ was between -40 and -25. Based on field data, the grain roughness height (kgrain) was specified to be three times the grain median diameter (D50). In addition, obtaining the sand roughness height was the first successful attempt to measure boundary roughness indirectly with a uniform sand layer fixed within a conduit surface (Nikuradse, 1933). Similarly, for the ground on the spend zero-crossing method of topographic data for statistical analysis (IAHR, 1989), significant wave height can be applied as the dune roughness height (kdune) due to the similarity of longitudinal fluctuations of the riverbed and wave variations under the circumstance of the whole bed slope in the MYR.

3.4 Determination of bar resistance

In general, it is more convenient to determine the bar resistance (nb) through an indirect approach instead of a detailed field investigation during a flood. Hence, the Einstein hydraulic radius segmentation method, which is widely used in resistance segmentation, was utilized to calculate the bar resistance (Einstein and Barbarossa, 1952). Based on the physical method, the turbulence generated at the boundary mainly affects the flow close to the boundary. Therefore, if the entire river is divided into two parts, the turbulent transmission of the channel and bars are concentrated in the mainstream and vegetated areas respectively, converting the potential energy of the flow into heat energy. Using this approach, bar resistance is given by:
${{n}_{b}}={{\left( \frac{{{n}^{\frac{3}{2}}}w-n_{c}^{\frac{3}{2}}{{w}_{c}}}{{{w}_{b}}} \right)}^{\frac{2}{3}}}$
where w, wb, and wc are the wet perimeter of the whole cross-section, bars, and channel, respectively.

3.5 Extraction and quantification of the bar vegetated area (VA)

Herein, atmospheric corrections of raw Landsat images were preprocessed in ENVI remote sensing software. Additionally, the Normalized Difference Vegetation Index (NDVI), which is widely used for determining the vegetation index in band math (Pettorelli et al., 2005), was taken to distinguish the bars and channel water. The NDVI was calculated through the near-infrared reflectance and red ratios:
$NDVI=\frac{NIR-RED}{NIR+RED}$
where NIR and RED are the amounts of the near-infrared and red light, respectively. NDVI values were between -1 and 1, where a negative value corresponds to no vegetation (Myneni et al., 1995).

3.6 Determination of bar submerged frequency (BSF)

Determination of the BSF has been traditionally challenging and, therefore, requires special attention. However, when field measurements of channel and bars are available, a combination of geomorphic and hydraulic criteria for determining BSF is usually applied. In this study, the elevation of each bar was manually determined by comparing the two-dimensional terrain, cross-sectional profiles that contained the bars, and satellite images. When the water level was equal to or higher than bar elevation, the bar was assumed to be submerged. Then, based on the water level and flow relationship of the different bar areas, the submerged flow of each bar was obtained. Consequently, the following expression for determining BSF was derived:
$BSF=\frac{BSD}{TD}$
where BSD is the number of days the bar was submerged and TD is the total number of days.

4 Results

As outlined above, the cross-sectional profiles in the MYR in the post-dam period were used to determine the channel and bar resistance, using the observed data at the water gauge and hydrometric stations. The variation of flow resistance with discharge and spatial-temporal changes were analyzed while the contributions of the resistance components were calculated. Furthermore, the responses were investigated of various dam-control flow and sediment elements on the variation in different flow resistance components, and the corresponding relationships between them were developed. The impact of flow resistance on the flood water level in the post-dam period was then calculated, which proved that the former was the dominant factor to explain why the latter did not decrease.

4.1 Dynamic adjustments in channel and bar resistance

Figure 2 shows that the channel and bar resistance varied with the discharge, time, and space changes along the MYR after the damming. It is evident that there was a decline in the comprehensive, channel, and bar resistances as the discharge increased. Nonetheless, because the flow covers the bar, a relatively large bar resistance must be considered, such that at bank-full discharges (Qbf), the comprehensive resistance increases slightly and then decreases with increasing depth of vegetation submergence.
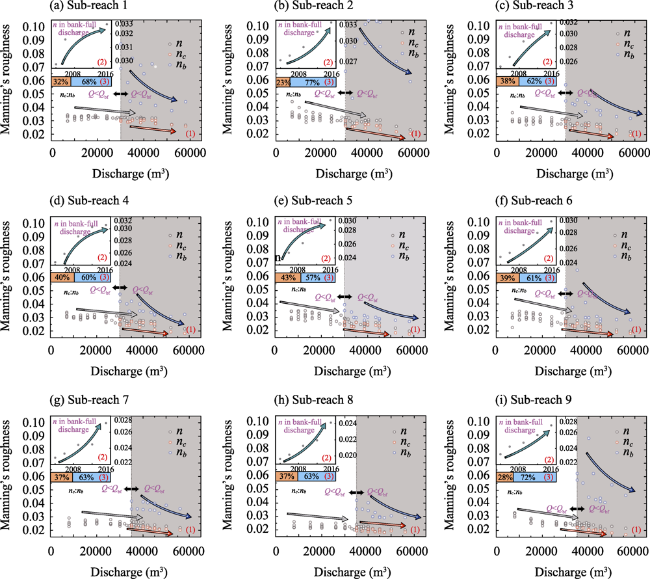
Figure 2 The variation of the comprehensive (n), channel (nc), and bar (nb) resistances as the (1) discharge, (2) time, and (a‒i) space changes. The ratio (3) of channel and bar resistances in different sub-reaches.
As for the physical distribution of comprehensive resistance, the downstream resistance of the TGD decreased along the river, from 0.032 at sub-reach 1 to 0.024 (-23%) at sub-reach 9. Regarding the aspect of riverbed composition, it dropped from 0.032 in the gravel-sand channel to 0.026 (-17%) in the sand channel. Regarding timing and duration, the average annual growth rate of the comprehensive resistance increased by 59% (period 3 vs. period 2), from 0.025 during period 2 to 0.029 (+19%) during period 3, especially due to the change in TGD operations.
During flooding, channel resistance increased from 0.022 during period 2 to 0.025 (+12%) during period 3, with the greatest increase in sub-reaches 2-6, which was due to the meandering of the river and large adjustment of the channel geometry. The grain and dune resistances increased by 12% and 238% (period 3 vs. period 2), respectively. However, as the grain resistance is too small to be compared to the dune resistance, it is recognized that the increase in channel resistance mainly comprises the dune resistance caused by the longitudinal profile adjustment of the channel.
Bar resistance accounted for about 65% of the comprehensive resistance during flooding in the MYR. The ratio of bar to channel resistance in each sub-reach is shown in Figure 2. The relationship between the data scatters and the discharge was not as clear as the channel resistance, which was due to the complex flow state in the vegetated bars. However, the bar resistance was at its peak when the flow of water was just over the bar. As the water depth increased, the Phragmites communis and Miscanthus sacchariflorus, the dominant plant species in the MYR, were submerged, resulting in a decrease of bar resistance. Additionally, the bar resistance correspondingly increased by 21% (period 3 vs. period 2) as the VA became denser in the post-dam period.
Therefore, resistance compositions varied with changes in flow, time, and space, which resulted from the altered flow and sediment regime in the post-dam period.

4.2 Response of flow resistance to variations in TGD-control flow and sediment regimes

It has been documented that the flow resistance of an alluvial river changes when the channel and bar geometries are altered in response to the adjusted flow and sediment regimes. As such, the incoming sediment load and runoff are considered the two dominant factors for calculating the size of the main channel, bars, and the corresponding flow resistance (Wu et al., 2008). Due to the regulation and storage effects of the TGD, the downstream annual runoff tended to be stable and only a few large floods occurred there. As a consequence, two relatively high flood years, 2004 and 2012, were selected as the representative years during periods 2 and 3, respectively, to reflect the differences in dam-control flow and sediment regimes.

4.2.1 Response of the dune resistance to the fluvial erosion and channel longitudinal profile fluctuation

It has been proposed that the flow and sediment conditions can be dominantly represented by the riverbed erosion (Xia et al., 2017). In the MYR, the violent scouring in the channel and slight eroding on bars owing to the TGD operations are shown in Figure 3a, which indicates the coarsening of the bed materials, increased cross-sectional areas, widening and deepening of the channel, and the aggravated channel longitudinal profile fluctuations. As mentioned in Section 3.2.2, there was a good correlation between the longitudinal profile fluctuation and the dune roughness height, and an increase of 35% in dune roughness height from period 2 to period 3 (Figure 3b). This corresponded to the increase in dune resistance described in Section 4.1, and thus there was a positive correlation between the growth rate of dune resistance and the increase rate of dune roughness height, as shown in Figure 3c.
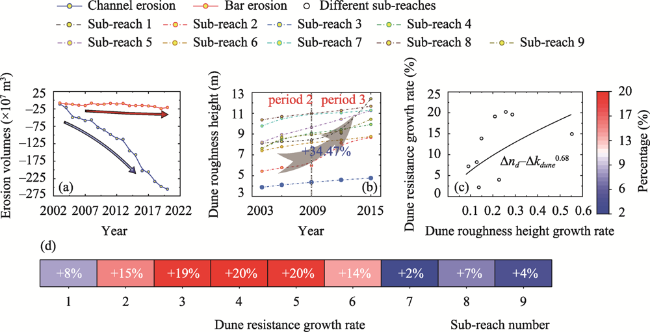
Figure 3 The accumulative erosion volumes of the channel and bars (a), the variations of dune roughness heights in different reaches (b), variations of the dune resistance growth rate as a function of the dune roughness height growth rates (c), and the dune resistance growth rates for periods 2-3 in different sub-reaches (d)
Notably, the response of dune resistance to fluvial erosion and channel longitudinal profile fluctuation is shown in Figure 3d. It appears that the dune resistance in the MYR increased, especially in sub-reaches 2-6 (+20%). The interpretation of the highly reinforced dune resistance in sub-reaches 2-6 was due to the well-developed dunes induced by the decaying hydrodynamic conditions, which is closely connected to the diversions to the Dongting Lake through three outlets. In contrast, there was a lot of interweaving of the channel and bars in these reaches, and the longitudinal profile fluctuation was more aggressive owing to the massive erosion in the channel but less aggressive on the bars. Moreover, the dam-induced response should be increasingly lower while reaching further from the TGD. Therefore, the growth rate of dune resistance in the lower MYR is relatively minor.
Consequently, two main factors can explain the fact that the resistance of the dune, which occupies a dominant proportion of the channel, continues to increase after the damming. Foremost, the under-saturated flow induced by TGD operations continues to scour the channel, causing it to be more fluctuated in the channel longitudinal profile. Moreover, the cross-sectional area is enlarged and develops toward a narrower and deeper direction in the post-dam period, slowing down the flow velocity at the same discharge. Thus, all of the factors are regarded as the response of the dune resistance to the TGD operations.

4.2.2 Response of the grain resistance to the arming of the bed materials

In general, the grain size of bed materials downstream of dams increased significantly after the dam construction, which was also reflected in the entire Yangtze River, as shown in Figure 4. The grain coarsened to varying degrees was noted along the MYR, while the grains coarsened 9035% in the gravel-sand and the near-dam reaches during periods 2-3. Meanwhile, in the sand reaches, the grain size increment decreased along with increasing distance from the TGD, from +57% at station 3 to +8% at station 16.
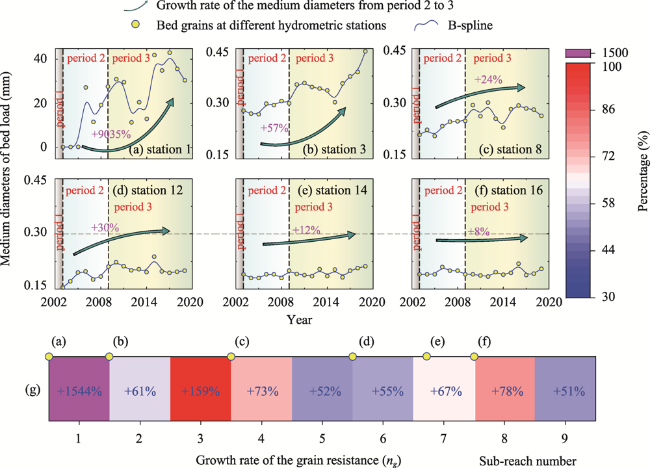
Figure 4 Variation of the medium diameters of bed load with the Three Gorges Dam operation periods at different hydrometric stations (a-f), and the growth rate of the grain resistance during periods 2-3 in different sub-reaches (g)
In general, the grain resistance is regarded to be closely linked with the grain size and flow conditions. Figure 4g shows the growth rate of the grain resistance in each sub-reach in a good relationship with the corresponding coarsening rates at hydrometric stations along the river (Figures 4a-4f). That is, in the gravel-sand reach (i.e. sub-reach 1), the grain resistance increased substantially (+1544%), while in the lower MYR (i.e. sub-reach 9), the increment was relatively small (+51%).
However, the grain resistance has a limited contribution to the channel resistance regardless of the increase, owing to its small effect compared to the dune resistance.

4.2.3 Response of bar resistance to the VA and BSF

As noted in Section 4.1, the bar resistance decreased with increasing discharge, whereas it increased as the TGD operation period changed. Of particular note was the fact that the bar resistance in the MYR increased between 2% and 52%, during periods 2-3, while its overall increase was 0.041‒0.051 (+24%).
The interpretation of bar resistance noted above is reinforced by the VA growth induced by the reduction of the BSF, which is closely related to the TGD operation. Specifically, there was a significant diminution in BSF of 16 bars in the MYR, as shown in Figure 5, and two adjustments of the TGD operation reduced the overall BSF by 34% and 19%, mainly resulting from the gradual increase of the TGD’s effect on flood retention. Furthermore, bars in the MYR varied in size (2‒80 km2) and their morphological adjustments at different periods were relatively minor; however, the area changes were significant, as the vast majority of the VA increased since the damming (ranging from +1% to +17%) due to the increased vegetation growth time induced by the low BSF (Figure 6).
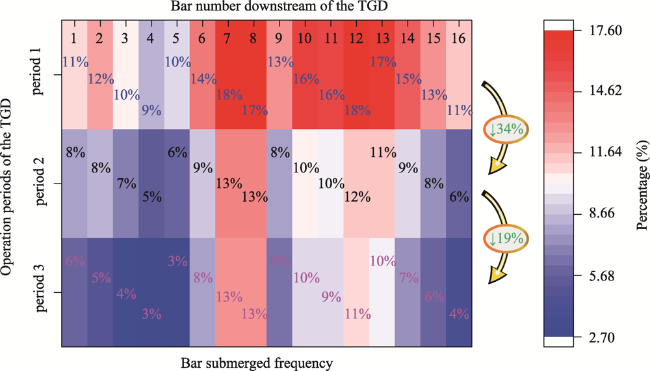
Figure 5 Variation of the bar submerged frequency with the Three Gorges Dam operation periods in different sub-reaches
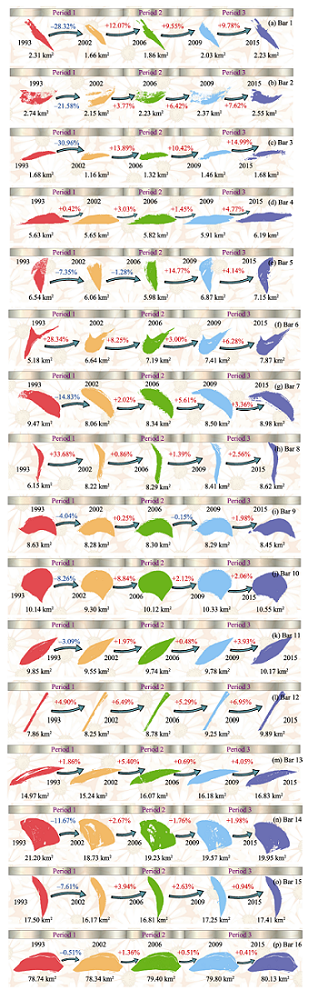
Figure 6 Variations of the vegetated area on 16 bars with the Three Gorges Dam operation periods
The likely reason for the VA increase on the high bar after the operation of the TGD could be that erosion mainly focused on the channel and low bar (Yang et al., 2017a). Previous studies collected several high bar elevations during different TGD operation periods and found few changes in each bar (Zhang et al., 2018; Zhang et al., 2020). The stabilized high bar provided enough space for vegetation to grow. Furthermore, as shown in Table 3, the VA of each bar was assessed on the basis of a two-dimensional terrain in 2015, revealing results similar to those calculated from the Landsat images.
Table 3 Comparison of calculated vegetated areas through Landsat-8 OLI and two-dimensional (2D) terrain in 2015
Bar number 1 2 3 4 5 6 7 8
Calculated vegetated areas through Landsat-8 OLI (km2) 2.23 2.55 1.68 6.19 7.15 7.87 8.98 8.62
Calculated vegetated areas through 2D terrain (km2) 2.15 2.31 1.81 5.88 6.96 7.93 9.05 8.51
Bar number 9 10 11 12 13 14 15 16
Calculated vegetated areas through Landsat-8 OLI (km2) 8.45 10.55 10.17 9.89 16.83 19.95 17.41 80.13
Calculated vegetated areas through 2D terrain (km2) 8.22 10.63 10.22 9.71 16.66 20.01 17.55 79.95
Unfortunately, scattered data points resulted in a low correlation coefficient of the formula fitting. Nonetheless, the trend is clear and the growth rate of the VA (ΔVA) was negatively correlated with the BSF growth rate; the growth rate of the bar resistance (Δnb) was positively correlated with the ΔVA; the Δnb was negatively correlated with the BSF (Figure 7). However, these interpretations are supported by the overall increase in bar resistance, reduction in the BSF, as well as the growth in the VA (Figures 2, 5, and 6). Taken together, these results indicate that the VA on bars are strongly related with the BSF, which is influenced by the TGD operation. Moreover, the magnitude of bar resistance and its proportion in the comprehensive resistance show a strong positive correlation with the VA. Consequently, on account of the different operation periods of the TGD, bar resistance increases along with the VA growth.
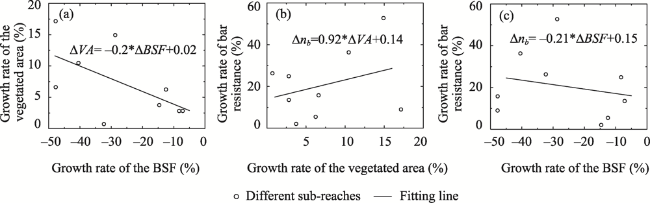
Figure 7 Fitting lines among the growth rate of bar resistance, vegetated area, and bar submerged frequency during periods 2-3

5 Discussion

In natural fluvial systems, the temporal and spatial variations of the water level in channels is generally dominated by flow resistance, channel geomorphology, and waterway regulation projects. In this section, the possible factors affecting the abnormal high downstream water levels after the TGD was put in operation are discussed.

5.1 Abnormal high flooding water level

In Figure 8, typical hydrometric stations along the MYR are selected to show the water level and discharge relationships during 2003 and 2014. The stage in 2014 was significantly lower than that in 2003 when the discharge was less than bank-full discharge (~35,000 m3/s). The main reason for water level decrease during the dry season was the flow that became unsaturated after the TGD was put into operation, intensifying bed erosion. However, the water level in the flood season did not drop as much as they did in the dry season.
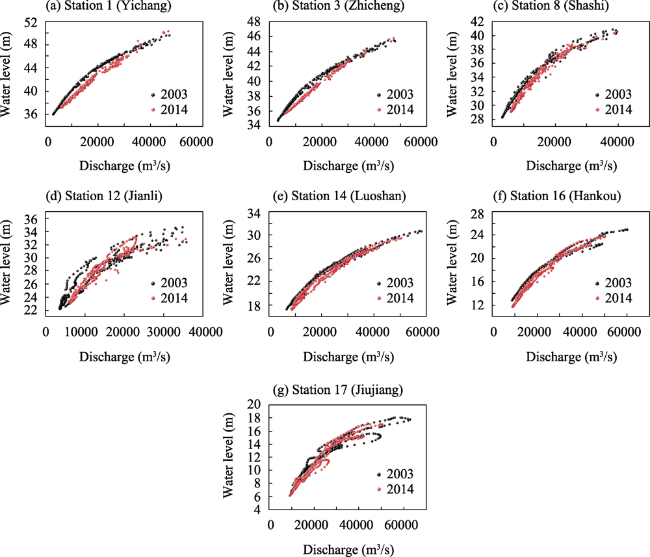
Figure 8 Stage and discharge relationships at stations 1 (Yichang), 3 (Zhicheng), 8 (Shashi), 12 (Jianli), 14 (Luoshan), 16 (Hankou), and 17 (Jiujiang) in 2003 and 2014
As the specific-gauge analysis was often utilized to quantify changes in the stage-discharge relationship over time worldwide, specific discharges were selected at each hydrometric station (Bormann et al., 2011). Based on the previous studies (Han et al., 2017; Chai et al., 2020), specific low-flow discharges were determined to be 6200, 6500, 6500, 6500, 8500, 12,000, and 12,000 m3/s at stations 1, 3, 8, 12, 14, 16, and 17, respectively. Low-flow channel water levels in 2014, when compared to those in 2003, dropped by 0.75, 0.67, 1.03, 0.30, 0.84, 0.85, and 0.54 m at each station, respectively. The corresponding specific high-flow discharges at these seven stations were 40,000, 40,000, 40,000, 35,000, 45,000, 50,000, and 50,000 m3/s, respectively. High-flow channel water levels in 2014, when compared to those in 2003, changed by ˗0.02, ˗0.12, ˗0.06, ˗0.01, ˗0.06, 0.01, and 0.00 m at each station, respectively.
Such an abnormal high downstream water levels after dam operation also occurred globally (Surian and Rinaldi, 2003; Bormann et al., 2011; Carle et al., 2015; Slater, 2016). Studying this may help clarify the consequences of the disasters caused by the flooding high water levels.

5.2 Evolution of channel geomorphology

In addition to the concerns regarding resistance, a concern regarding the response of topography and flows of downstream channels due to the TGD is also growing. Based on 450 cross-sections per year, the evolution of channel geomorphology was discussed. There has been extensive erosion in the channel while the elevation of bars changed only minimally. Four typical cross-section profiles, which include bars and channel, are shown in Figure 9. Riverbeds eroded significantly regardless of whether the river was straight, branched, or curved. This was consistent with the results presented in Figure 3, which presents the fluvial erosion at a scale of a reach. There was a notable change in the longitudinal profile from 2004 to 2015, The average scour depth of the riverbed in the MYR was 1.39 m and the maximum scour depth was 16 m. The water depth of each reach notably increased, whereas the river width changed only slightly. Correspondingly, the river regime coefficient significantly increased and the river channel section narrowed and deepened.
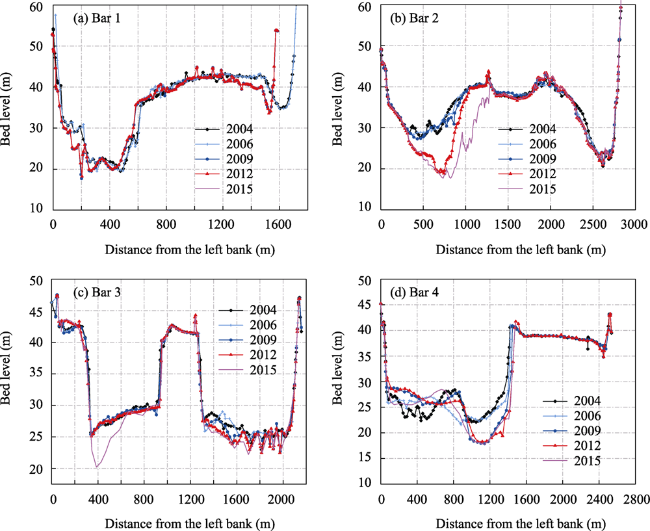
Figure 9 Temporal changes of the cross-section profiles of four typical sections in the middle reaches of the Yangtze River
In general, channel geomorphology adapted to its upstream flow and sediment, thus present reaches were adapted to the low discharge and sediment concentration after the TGD started.

5.3 Impact of flow resistance and riverbed erosion on the flood water level

Generally, riverbed erosion decreases water levels while increased flow resistance increases water levels at identical discharges (Moshe et al., 2008; Greene and Knox, 2014). In the presented results and discussion, we explored the reasons for variability in the contributions to channel and bar resistances in response to the TGD operations. The elevation of the channel topography continued to decrease while the flow resistance gradually increased after damming. Notably, due to the flow going over the bars during flooding, the bar resistance accounted for an increasing proportion of the comprehensive resistance, especially when the bar areas were rising with time. In this respect, a comparison was made between the riverbed erosion and flow resistance, which determined significant factors contributing to flood water levels in post-dam periods.
As shown in Figure 10, the flood water levels did not change significantly in the two periods and the relative variation was close to zero under the natural conditions. However, the topographical change reduced the flood water level from 0.3 m to 1.5 m, while the flow resistance change raised it from 0.5 m to 1.7 m. Notably, the impact of the riverbed erosion on the flood water level was weakened due to the reduced erosion downstream. However, the impact of the flow resistance on the flood water level peaked between in hydrometric stations 6-14 because of the concentrated bars and developed dunes.
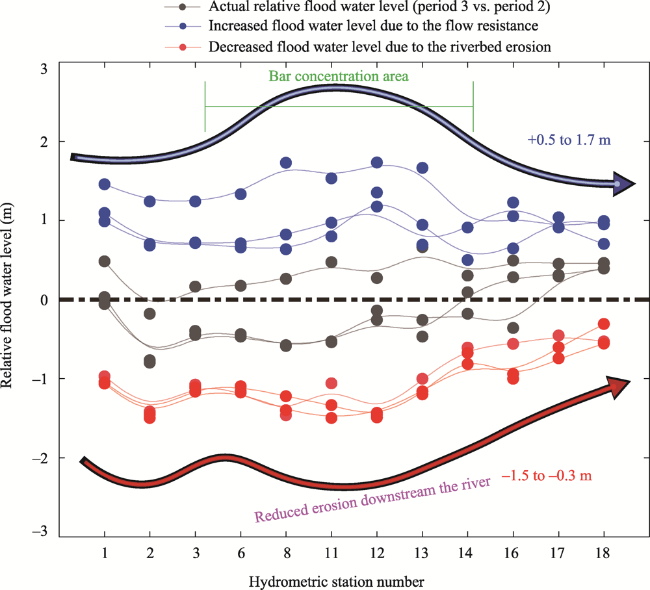
Figure 10 The relative flood water level influenced by the flow resistance and riverbed erosion along the middle reaches of the Yangtze River
Thus, the increased flow resistance, due to the channel (+35%) and bar (+65%) resistances, was the main controlling factor to prevent the flood water levels from decreasing in the MYR after the TGD was built.

5.4 General significance

There are many rivers worldwide that show changes in their water levels after the construction of upstream dams, such as Colorado (Xiao et al., 2018), Missouri (Pinter and Heine, 2005), Mississippi (Carle et al., 2015; Day et al., 2016), and 25 rivers in Germany (Bormann et al., 2011). In most of them, it was noticed that channel and bar resistances played significant roles in increasing water levels. In this study we quantified the variations of channel and bar resistances in the MYR after the TGD operation started. These findings provide useful reference for other rivers, adding to the comprehensive findings on resistance previously published (Chai et al., 2020) and may indicate abnormally high stages of flooding in the rivers around the world.

5.5 Future research

If we constrain the width (engineered banks), then the depth and associated water level will increase. Based on the statistics, ~41 waterway regulation projects were carried out in the MYR during periods 2-3 (Liu et al., 2021). These projects were commonly carried out on the surface of the channel bars and riffles, with elevations higher than that of the main channel. For example, protection belt and shallow spurs were adopted in the project at Bar 4 (Figure 11) to prevent bar cutting or collapsing and the worsening of the channel conditions. Channel projects near the other bars in the MYR were investigated in recent studies (Yan et al., 2019; Yang et al., 2021; Yang et al., 2022). When the channel project is located lower than the bank-full channel, the channel resistance must be taken into consideration and its influences can be reflected through the increased channel resistance. When the channel project is located higher than the bank-full channel, it helps protect the high bar from scouring and its impacts can be reflected through the increased bar resistance. Therefore, quantifying the contribution of engineered banks to water level is necessary.
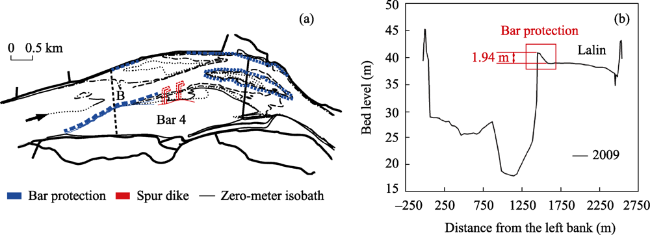
Figure 11 Engineered banks at Bar 4 (Lalin): (a) planar graph; (b) cross-sectional drawing

6 Conclusions

It concerns scientists that the flood water level at an identical discharge rate has not displayed a decreasing trend along the MYR since the TGD was put into operation. To reveal the cause of the phenomenon, the impacts of the TGD operation on resistance adjustments of channel and bars in a section of the MYR spanning ~955 km were comprehensively quantified and analyzed at different spatial and temporal scales on the basis of systematic surveys of cross-sectional profiles, hydrological datasets, remote sensing images, and sediment datasets for the pre- and post-TGD periods. The main conclusions drawn from this study are as follows.
First, the variation trend of flow resistance with discharge, and spatial-temporal changes were specified while the contributions of the resistance components were analyzed along the MYR since damming. Notably, there was a decline in the comprehensive, channel, and bar resistances as discharge increased, and these increased slightly when reaching the bank-full discharges. Furthermore, the flow resistance decreased as the distance from the TGD increased and subsequently increased with time.
Second, the increased dune and bar resistances were the main factor causing the flood water level to not drop in the MYR during the post-TGD period. On the one hand, the enhancive dune resistance was the principal factor in the channel of the MYR, where there was an intensified fluvial erosion and a more fluctuant longitudinal profile. On the other hand, the bar resistance, which was reinforced due to the low BSF and growing VA, was the primary component of the comprehensive resistance during the flood season. Additionally, the grain resistance had a significant increase owing to the coarsened bed grains, however, this was insignificant compared to the other contributions of the flow resistance.
To conclude, assuming that no erosion occurred, flow resistance change (channel: 35%; bars: 65%) raised the flood water level from 0.5 m to 1.7 m in the MYR during the post-TGD period.
[1]
Aberle J, Nikora V, Henning M et al., 2010. Statistical characterization of bed roughness due to bed forms: A field study in the Elbe River at Aken, Germany. Water Resources Research, 46(3).

[2]
Afzalimehr H, Singh V P, Najafabadi E F, 2010. Determination of form friction factor. Journal of Hydrologic Engineering, 15(3): 237-243.

DOI

[3]
Alam A M, Kennedy J F, 1969. Friction factors for flow in sand-bed channels. Journal of the Hydraulics Division, 95(6): 1973-1992.

DOI

[4]
Bormann H, Pinter N, Elfert S, 2011. Hydrological signatures of flood trends on German rivers: Flood frequencies, flood heights and specific stages. Journal of Hydrology, 404(1): 50-66.

DOI

[5]
Cao G J, Wang J, 2015. Measurements and Studies of Hydrological and Sediment Data in the Three Gorges Project. Beijing: Science Press. (in Chinese)

[6]
Carle M V, Sasser C E, Roberts H H, 2015. Accretion and vegetation community change in the Wax Lake Delta following the historic 2011 Mississippi River flood. Journal of Coastal Research, 31(3): 569-587.

[7]
Carling P A, Leyland J, Kleinhans M G et al., 2020. Quantifying fluid retention due to natural vegetation in a forest floodplain analogue using the aggregated dead zone (ADZ) dilution approach. Water Resources Research, 56(9): e2020WR027070.

[8]
Chai Y F, Yang Y P, Deng J Y et al., 2020. Evolution characteristics and drivers of the water level at an identical discharge in the Jingjiang reaches of the Yangtze River. Journal of Geographical Sciences, 30(10): 1633-1648.

DOI

[9]
Chang F F M, 1970. Ripple concentration and friction factor. Journal of the Hydraulics Division, 96(2): 417-430.

DOI

[10]
Coon W F, 1998. Estimation of roughness coefficients for natural stream channels with vegetated banks. USA: US Geological Survey.

[11]
CWRC, 2015. Analysis of channel degradation in the reach downstream of the Three Gorges Dam. Scientific Report. Wuhan: Changjiang Water Resources Commission. (in Chinese)

[12]
Darby S E, 1999. Effect of riparian vegetation on flow resistance and flood potential. Journal of Hydraulic Engineering, 125(5): 443-454.

DOI

[13]
Day J W, Cable J E, Lane R R et al., 2016. Sediment deposition at the Caernarvon crevasse during the great Mississippi flood of 1927: implications for coastal restoration. Water, 8(2): 38.

DOI

[14]
De St Venant B, 1871. Theorie du mouvement non-permanent des eaux avec application aux crues des rivers et a l'introduntion des Marees dans leur lit. Academic de Sci. Comptes Redus, 73(99): 148-154.

[15]
Einstein H A, Barbarossa N L, 1952. River channel roughness. Transactions of the American Society of Civil Engineers, 117(1): 1121-1132.

DOI

[16]
Fang H W, Han D, He G J et al., 2012. Flood management selections for the Yangtze River midstream after the Three Gorges Project operation. Journal of Hydrology, 432/433: 1-11.

DOI

[17]
Graf W L, 2006. Downstream hydrologic and geomorphic effects of large dams on American rivers. Geomorphology, 79(3): 336-360.

DOI

[18]
Greene S L, Knox J C, 2014. Coupling legacy geomorphic surface facies to riparian vegetation: Assessing red cedar invasion along the Missouri River downstream of Gavins Point dam, South Dakota. Geomorphology, 204: 277-286.

DOI

[19]
Han J Q, Sun Z H, Li Y T et al., 2017. Combined effects of multiple large-scale hydraulic engineering on water stages in the middle Yangtze River. Geomorphology, 298: 31-40.

DOI

[20]
He Z, Sun Z, Li Y et al., 2021. Response of the gravel-sand transition in the Yangtze River to hydrological and sediment regime changes after upstream damming. Earth Surface Processes and Landforms, 47(2): 383-398.

DOI

[21]
Huang C A, Zhao X D, Gong M F, 2004. Comparisons of flow resistance equations in movable bed. Journal of Sediment Research, (5): 1-7.

[22]
IAHR Working Group on Wave Generation and Analysis, 1989. List of sea-state parameters. Journal of Waterway, Port, Coastal, and Ocean Engineering, 115(6): 793-808.

DOI

[23]
Jiang Y, Cheng H, Zhou Q et al., 2021. Influence of major water conservation projects on river channels and shorelines in the middle and lower reaches of the Yangtze River. Arabian Journal of Geosciences, 14(10): 1-12.

DOI

[24]
Julien P Y, Klaassen G J, Ten Brinke W B M et al., 2002. Case study: Bed resistance of Rhine River during 1998 flood. Journal of Hydraulic Engineering, 128(12): 1042-1050.

DOI

[25]
Liu C, Chai Y, Zhu B et al., 2021. River regulation and resilience: An approach for the Yangtze watershed. Water Supply, 21(4): 1817-1833.

DOI

[26]
Liu X, Xia J Q, Zhou M R et al., 2020. Formula of movable bed roughness for the Middle Yangtze River. Advances in Water Science, 31(4): 535-546. (in Chinese)

[27]
Lyu Y, Fagherazzi S, Zheng S et al., 2020. Enhanced hysteresis of suspended sediment transport in response to upstream damming: An example of the middle Yangtze River downstream of the Three Gorges Dam. Earth Surface Processes and Landforms, 45(8): 1846-1859.

DOI

[28]
Lyu Y W, Zheng S, Tan G M et al., 2019. Morphodynamic adjustments in the Yichang-Chenglingji Reach of the Middle Yangtze River since the operation of the Three Gorges Project. Catena, 172: 274-284.

DOI

[29]
Myneni R B, Hall F G, Sellers P J et al., 1995. The interpretation of spectral vegetation indexes. IEEE Transactions on Geoscience and Remote Sensing, 33(2): 481-486.

DOI

[30]
Makaske B, Maathuis B H P, Padovani C R et al., 2012. Upstream and downstream controls of recent avulsions on the Taquari Megafan, Pantanal, south-western Brazil. Earth Surface Processes and Landforms, 37(12): 1313-1326.

DOI

[31]
Moshe L B, Haviv I, Enzel Y et al., 2008. Incision of alluvial channels in response to a continuous base level fall: Field characterization, modeling, and validation along the Dead Sea. Geomorphology, 93(3/4): 524-536.

DOI

[32]
Naden P, Rameshwaran P, Mountford O et al., 2006. The influence of macrophyte growth, typical of eutrophic conditions, on river flow velocities and turbulence production. Hydrological Processes: An International Journal, 20(18): 3915-3938.

DOI

[33]
Nikuradse J, 1933. Stromungsgesetze in rauhen Rohren. VDI-Forschungsheft, 361: 1.

[34]
O’Hare M T, McGahey C, Bissett N et al., 2010. Variability in roughness measurements for vegetated rivers near base flow, in England and Scotland. Journal of Hydrology, 385(1-4): 361-370.

DOI

[35]
Peterson A W, Peterson A E, 1988. Mobile boundary flow: an assessment of velocity and sediment discharge relationships. Canadian Journal of Civil Engineering, 15(4): 539-546.

DOI

[36]
Petryk S, Bosmajian III G, 1975. Analysis of flow through vegetation. Journal of the Hydraulics Division, 101(7): 871-884.

DOI

[37]
Pettorelli N, Vik J O, Mysterud A et al., 2005. Using the satellite-derived NDVI to assess ecological responses to environmental change. Trends in Ecology & Evolution, 20(9): 503-510.

DOI

[38]
Petts G E, Gurnell A M, 2005. Dams and geomorphology: Research progress and future directions. Geomorphology, 71(1): 27-47.

DOI

[39]
Pinter N, Heine R A, 2005. Hydrodynamic and morphodynamic response to river engineering documented by fixed-discharge analysis, Lower Missouri River, USA. Journal of Hydrology, 302(1-4): 70-91.

DOI

[40]
Slater L J, 2016. To what extent have changes in channel capacity contributed to flood hazard trends in England and Wales? Earth Surface Processes and Landforms, 41(8): 1115-1128.

DOI

[41]
Sonnad J R, Goudar C T, 2006. Turbulent flow friction factor calculation using a mathematically exact alternative to the Colebrook-White equation. Journal of Hydraulic Engineering, 132(8): 863-867.

DOI

[42]
Surian N, Rinaldi M, 2003. Morphological response to river engineering and management in alluvial channels in Italy. Geomorphology, 50(4): 307-326.

DOI

[43]
Van Rijn L C, 1982. Equivalent roughness of alluvial bed. Journal of the Hydraulics Division, 108(10): 1215-1218.

DOI

[44]
Van Rijn L C, 1984. Sediment transport, part III: bed forms and alluvial roughness. Journal of Hydraulic Engineering, 110(12): 1733-1754.

DOI

[45]
Wang B, Xu Y J, 2018. Dynamics of 30 large channel bars in the Lower Mississippi River in response to river engineering from 1985 to 2015. Geomorphology, 300: 31-44.

DOI

[46]
Wang Z, Chen Z Y, Shi Y F et al., 2007. The fluvial bedform and hydrodynamic controls along the middle and lower Yangtze River (from Wuhan to estuary). Science in China (Series D): Earth Science, 37: 1223-1234.

[47]
Wu B, Wang G, Xia J et al., 2008. Response of bankfull discharge to discharge and sediment load in the Lower Yellow River. Geomorphology, 100(3/4): 366-376.

DOI

[48]
Xia J, Deng S, Lu J et al., 2016. Dynamic channel adjustments in the Jingjiang Reach of the Middle Yangtze River. Scientific Reports, 6(1): 1-10.

DOI

[49]
Xia J, Wu B, Wang G et al., 2010. Estimation of bankfull discharge in the Lower Yellow River using different approaches. Geomorphology, 117(1/2): 66-77.

DOI

[50]
Xia J, Zhou M, Lin F et al., 2017. Variation in reach-scale bankfull discharge of the Jingjiang Reach undergoing upstream and downstream boundary controls. Journal of Hydrology, 547: 534-543.

DOI

[51]
Xiao M, Udall B, Lettenmaier D P, 2018. On the causes of declining Colorado River streamflows. Water Resources Research, 54(9): 6739-6756.

DOI

[52]
Yan T, Yang Y, Li Y et al., 2019. Possibilities and challenges of expanding dimensions of waterway downstream of Three Gorges Dam. Water Science and Engineering, 12(2): 136-144.

DOI

[53]
Yang Y, Liu W, Zhang J et al., 2022. Changes of divergence and confluence relationship between Dongting Lake and the Yangtze River after the operation of the Three Gorges Project and its impact on the waterway depth. Frontiers in Earth Science, 84.

[54]
Yang Y, Zheng J, Zhang M et al., 2021. Sandy riverbed shoal under anthropogenic activities: The sandy reach of the Yangtze River, China. Journal of Hydrology, 603: 126861.

DOI

[55]
Yang Y P, Zhang M J, Sun Z H et al., 2017a. The relationship between water level change and river channel geometry adjustment in the downstream of the Three Gorges Dam (TGD). Acta Geographica Sinica, 72(5): 776-789. (in Chinese)

[56]
Yang Y P, Zhang M J, Zhu L L et al., 2017b. Influence of large reservoir operation on water-levels and flows in reaches below dam: Case study of the Three Gorges Reservoir. Scientific Reports, 7(1): 1-14.

DOI

[57]
Yen B C, 2002. Open channel flow resistance. Journal of hydraulic engineering, 128(1): 20-39.

DOI

[58]
Zhang W, Gao Y, Xu Q X et al., 2018. Changes in dominant discharge and their influential factors in the middle and lower reaches of Yangtze River after the Three Gorges Dam impoundment. Advances in Water Science, 29(3): 331-338. (in Chinese)

[59]
Zhang W, Wu M Q, Li S X et al., 2020. Mechanism of adjustment of scouring and silting of Chenglingji-Jiujiang reach in the middle reaches of the Yangtze River after impoundment of the Three Gorges Dam. Advances in Water Science, 31(2): 162-171. (in Chinese)

[60]
Zheng S, 2016. Reflections on the Three Gorges Project since its operation. Engineering, 2(4): 389-397.

DOI

[61]
Zhou Y J, Lu J Y, Chen L et al., 2018. Bed roughness adjustments determined from fractal measurements of river-bed morphology. Journal of Hydrodynamics, 30(5): 882-889.

DOI

Outlines

/