Temperature trends in some major countries from the 1980s to 2019

  • SHEN Beibei , 1 ,
  • SONG Shuaifeng 2 ,
  • ZHANG Lijuan , 1 ,
  • WANG Ziqing 2 ,
  • REN Chong 1 ,
  • LI Yongsheng 3
Expand
  • 1. Heilongjiang Province Key Laboratory of Geographical Environment Monitoring and Spatial Information Service in Cold Regions, Harbin Normal University, Harbin 150025, China
  • 2. State Key Laboratory of Earth Surface Processes and Resource Ecology, Faculty of Geographical Science, Beijing Normal University, Beijing 100875, China
  • 3. Heilongjiang Climate Center, Harbin 150030, China
*Zhang Lijuan (1965-), PhD and Professor, E-mail:

Shen Beibei (1985-), specialized in earth surface processes and environmental change. E-mail:

Received date: 2021-01-02

  Accepted date: 2021-02-28

  Online published: 2022-03-25

Supported by

National Natural Science Foundation of China(41771067)

National Natural Science Foundation of China(U20A2082)

Natural Science Foundation of Heilongjiang Province(ZD2020D002)

Abstract

The study of temperature change in major countries of the world since the 1980s is a key scientific issue given that such data give insights into the spatial differences of global temperature change and can assist in combating climate change. Based on the reanalysis of seven widely accepted datasets, which include trends in climate change and spatial interpolation of the land air temperature data, the changes in the temperature of major countries from 1981 to 2019 and the spatial-temporal characteristics of global temperature change have been assessed. The results revealed that the global land air temperature from the 1980s to 2019 varied at a rate of 0.320°C/10a, and exhibited a significantly increasing trend, with a cumulative increase of 0.835°C. The mean annual land air temperature in the northern and southern hemispheres varied at rates of 0.362°C/10a and 0.147°C/10a, respectively, displaying significantly increasing trends with cumulative increases of 0.828°C and 0.874°C, respectively. Across the globe, the rates of change of the mean annual temperature were higher at high latitudes than at middle and low latitudes, with the highest rates of change occurring in regions at latitudes of 80°-90°N, followed by regions from 70°-80°N, then from 60°-70°N. The global land surface air temperature displayed an increasing trend, with more than 80% of the land surface showing a significant increase. Greenland, Ukraine, and Russia had the highest rates of increase in the mean annual temperature; in particular, Greenland experienced a rate of 0.654°C/10a. The regions with the lowest rates of increase of mean annual temperature were mainly in New Zealand and the equatorial regions of South America, Southeast Asia, and Southern Africa, where the rates were <0.15°C/10a. Overall, 136 countries (93%), out of the 146 countries surveyed, exhibited a significant warming, while 10 countries (6.849%) exhibited no significant change in temperature, of which 3 exhibited a downward trend. Since the 1980s, there have been 4, 34 and 68 countries with levels of global warming above 2.0°C, 1.5°C and 1.0°C, respectively, accounting statistically for 2.740%, 23.288% and 46.575% of the countries examined. This paper takes the view that there was no global warming hiatus over the period 1998-2019.

Cite this article

SHEN Beibei , SONG Shuaifeng , ZHANG Lijuan , WANG Ziqing , REN Chong , LI Yongsheng . Temperature trends in some major countries from the 1980s to 2019[J]. Journal of Geographical Sciences, 2022 , 32(1) : 79 -100 . DOI: 10.1007/s11442-022-1937-1

1 Introduction

Over the last century, our planet has experienced unprecedented shifts in the climate, mainly characterized by global warming, which is a consequence of both natural processes and human events, reflecting individual and collective behavior and development (Zhao et al., 2016; Lizana et al., 2017; Rossati, 2017; Huang et al., 2018; Pontes-da-Silva et al., 2018; Sequeira et al., 2018). This is thus a cause for concern. According to AR5 Climate Change 2013: The Physical Science Basis of the Fifth Assessment Report by the Intergovernmental Panel on Climate Change (IPCC), it is certain that the globally averaged combined land and ocean surface temperature data showed a warming of 0.85℃ as calculated by the linear trend of temperature data over the period 1880-2012 (IPCC AR5 WGI, 2013). In another report of October 2018, the IPCC specified the level of global warming was 1.5℃ above the pre-industrial revolution levels (IPCC, 2018). The conclusions of the IPCC have aroused great concern from governments and the public around the world. The international community is increasingly aware that climate change is an existential threat and a challenge to humanity as it leads to a rise in sea-levels, which takes away the living space and sources of livelihood of millions of people. Many researchers have come to the conclusion that we are experiencing a period having the largest temperature increase on land since the 1980s (Hansen et al., 2010; Lawrimore et al., 2011; Foster and Rahmstorf, 2011; Kim et al., 2013; Chu Duo et al., 2016; Wang et al., 2017; Sun, 2018), and is regarded as the key issue within the field of climate change. A clear description of temperature changes and a comparison of temperature changes in major countries are of great importance in establishing a global climate governance system, a system which is currently not available.
Researchers have used different datasets to analyze the trends in climate warming since the 1980s and the consensus is that there has been an increasing trend in warming during this period although at different rates. For instance, Hansen et al. (2010) and Lawrimore et al. (2011) considered the data from the Goddard Institute for Space Studies (GISS) and the Global Historical Climatology Network (GHCN), which highlighted the trends in the global rates of change of temperature from 1979-2010, and the 95% confidence limits were 0.254± 0.049℃/10a and 0.273 ± 0.047℃/10a, respectively. Foster and Rahmstorf (2011) made use of multiple sets of reanalysis data from 1979-2020 to study climate warming for the same period. According to that research, the global warming rates based on the GISS, GHCN, HadCRUT3v, RSS and UAH datasets were 0.171℃/10a, 0.175℃/10a, 0.170℃/10a, 0.157℃/10a and 0.141℃/10a, respectively. Kim et al. (2013) concluded that, based on the ERA-Interim data, the global warming rate in 1979-2012 was 0.110℃/10a. According to Chu et al. (2016), based on the MERRA data, the global warming rate from 1981 to 2010 was 0.130℃/10a. Wang et al. (2017) and Xu et al. (2018) analyzed the CRUTEM 4.4.0.0 and the CMA-LAST datasets, respectively, and concluded that the 95% confidence limits for 1979-2014 were 0.304 ± 0.060℃/10a and 0.272 ± 0.025℃/10a, respectively. The climate warming rates from 1979 to 2015 were 0.250℃/10a, 0.254℃/10a and 0.273℃/10a, according to Sun’s research (2018) based on the reanalysis of three datasets, namely, CMA-LAST- V1.0, CRUTEM4.1.1 and GHCN-V3.2.0. On the basis of the above research, this paper examines the global warming rate since the 1980s has been in the range 0.110℃/10a to 0.304℃/10a.
Other studies have focused on the spatial variability of the global temperature and its characteristics since the 1980s. For example, Chu et al. (2016) applied the CMA-LAST data to analyze trends over the period 1979-2014 and pointed out that the highest rate of temperature change was observed at high latitudes. Kim et al. (2013) adopted the ERA reanalysis data to study the spatial change of temperature since 1979 and came to a similar conclusion that surface warming over the Arctic region appeared to be greater than that of any other region in the globe. Screen (2014) found that the warming rate at high latitudes in the northern hemisphere (70°N-80°N, 0.86℃/10a) during 1979-2013 was clearly higher than that at middle latitudes (30°N-40°N, 0.30℃/10a). Wang et al. (2017) reported that climate warming occurred in all continents during 1977-2014, based on analysis of CRUTEM4.4.0.0 data.
Many other researchers have focused on the regional temperature changes since the 1980s and although there have been many similar studies covering the spatial change of land temperature, none of these studies actually selected the country as a statistical unit with the aim of analyzing and comparing the changes of temperature in the different countries. Therefore, this study has selected a number of reanalysis datasets to examine the spatial variation of the global temperature from 1981 to 2019. Furthermore, the differences in the rates of temperature change and variations in the rates of temperature change in some of the major countries were studied in an attempt to reveal the basic laws governing global climate change. This research may be taken as a scientific contribution which supports the national strategy of taking proactive action, and also as a measure to combat global climate change, which is of great relevance for the building of communities with a shared future for mankind.

2 Data sources and processing

At present, more than 20 reanalysis datasets have been released globally. This paper selected seven frequently-used and widely accepted real-time datasets with high spatial resolution and continuity, which are as follows:

2.1 CRU reanalysis data

The CRU reanalysis data from January 1901 to December 2019 were provided by the Climatic Research Unit (CRU) at the University of East Anglia. The data have a spatial resolution (grid basis) of at least 0.5° × 0.5°. The global mean monthly temperatures at 2 m for 1981-2019 were downloaded from http://www.cru.uea.ac.uk/data.

2.2 NCEP/NCAR reanalysis data

The NCEP/NCAR data provided by the National Center for Environment Prediction (NCEP) and the National Center for Atmospheric Research (NCAR), both organizations based in the US, are a global atmospheric reanalysis dataset. The surface data observed were not considered during the data assimilation process. The spatial resolution was on the basis of a 1.875° × 1.875° grid. The global mean monthly temperatures at 2 m for 1981-2019 were obtained from http://www.ncep.noaa.gov.

2.3 NCEP/DOE reanalysis data

The NCEP/DOE reanalysis dataset, with a spatial resolution of 1.875° × 1.875° (grid basis), was provided jointly by the NCEP and Department of Energy of the US. The NCEP/DOE data had some of the errors corrected which resulted in an improvement in the quality of the surface temperature data compared with that of the NCEP/NCAR. The global mean monthly temperatures at 2 m for 1981-2019 were obtained from http://www.esrl.noaa.gov/psd/data/ gridded/tables/temperature.html.

2.4 CFSR reanalysis data

The spatial resolution of the Climate Forecast System Reanalysis (CFSR) dataset, another dataset of the NCEP, is 0.5°×0.5°. The data for 1981 to 2019 were downloaded from https://rda.ucar.edu/.

2.5 ERA5 reanalysis data

The ERA5 atmospheric reanalysis data released by the European Centre for Medium-range Weather Forecast (ECMWF) have been improved since the release of a previous edition of the ERA-Interim on a basis of 0.25°×0.25°. The data for the global mean monthly temperatures at 2 m for 1981-2019 were obtained from https://www.ecmwf.int/en/forecasts/ datasets/reanalysis-datasets/era.

2.6 GHCN-CAM reanalysis data

The GHCN-CAM (hereafter GHCN) is a combination of datasets from two major observation stations collected by the Global Historical Climatology Network (GHCN) and the Climate Anomaly Monitoring (CAM) System and has a spatial resolution of 0.5°× 0.5°. The mean global monthly temperatures at 2 m for 1981-2019 were obtained from https:// www.esrl.noaa.gov/psd/data/gridded/data.ghcncams.html.

2.7 JRA-55 reanalysis data

The JRA-55 reanalysis data, on the basis of a 1.25°×1.25° grid, originate from the second global atmospheric reanalysis program of the Japan Meteorological Agency (JMA). The global mean monthly temperatures at 2 m for 1981-2019 were obtained from http://rda.ucar.edu/.
Kriging is a powerful type of spatial interpolation that uses complex mathematical formulae to estimate values at unknown points based on the values at known points. This paper used kriging together with resampling and with the assistance of the spatial analyst model in ArcGIS 10.5 to unify all the data to a 0.5° × 0.5° grid.

3 Methods

3.1 Trend analysis

The study adopted the linear propensity estimation method to analyze the long-term temperature trend in a time-series (Li and Hu, 2015). The equation for one-dimensional linear regression was established between temperature (y) and time (x):
y= ax+ b
where a is the linear regression coefficient that represents the rate of temperature change. A positive value of a means that the temperature increased over time, while a negative value means that the temperature decreased with time.

3.2 Variance analysis

Variance analysis can be summarized as a hypothesis testing method to study the overall average among groups of samples. The total variation is divided into different parts according to their sources, in order to decide the relative importance of different variation sources (Li and Hu, 2015). The statistic can be expressed as:
The statistic F follows the F distribution for the number of degrees of freedom at (r-1, n-r). SSA stands for the square of the average deviation for each group to the total average deviation; this term is also known as the inter-group sum of the deviation squares. SSE is the intra-group sum of the deviation squares, which reflects the differentiation within a particular group. In the formula, n is the number of samples, and r is the number of groups tested.
While the inter-group deviation exceeds the intra-group deviation, and all of the deviations pass the reliability test (at the 0.05 or 0.01 probability levels), it means that there were significant differences in the overall means for each sample and the samples were from different groups.

4 Results and analysis

4.1 Comparisons and selection of reanalysis data for the global mean annual temperature

Given the different sources of the reanalysis data, the seven datasets were first inspected and then the appropriate datasets were selected to avoid negative effects on the accuracy of the results. The results showed that the correlation coefficients ranged from 0.858 to 0.996, all of which exhibited extremely significant correlations (P<0.01) (Table 1). The results for variance analysis also indicated that there were no significant differences among the seven datasets (P >0.05); that is to say, all the seven datasets can be adopted in the study of global temperature change. The changes in the global annual temperature from 1981 to 2019 for the seven reanalysis datasets are shown in Figure 1.
Table 1 Correlation coefficients for the seven global temperature reanalysis datasets
CRU NCEP/NCAR NCEP/DOE ERA5 GHCN CFSR JRA55
CRU 1 0.974** 0.983** 0.987** 0.993** 0.872** 0.992**
NCEP/NCAR 1 0.984** 0.982** 0.968** 0.866** 0.975**
NCEP/DOE 1 0.989** 0.977** 0.884** 0.978**
ERA5 1 0.983** 0.858** 0.988**
GHCN 1 0.865** 0.996**
CFSR 1 0.863**
JRA55 1

Note: ** means that it is significant at the 0.01 level.

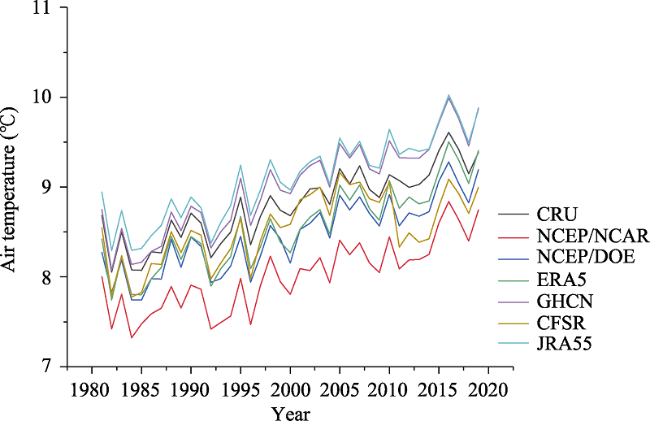
Figure 1 Changes in the global annual temperature from 1981 to 2019 (reanalysis data)

4.2 Global mean annual temperature variation since the 1980s

4.2.1 Temporal characteristics

The rates of change of the global mean annual temperature for the seven reanalysis datasets (Table 2) since the 1980s were 0.310℃/10a (CRU), 0.283℃/10a (NCEP/NCAR), 0.307℃/10a (NCEP/DOE), 0.347℃/10a (ERA5), 0.403℃/10a (GHCN), 0.231℃/10a (CRSR) and 0.358℃/10a (JRA55), respectively, with an average of 0.320℃/10a and with all showing significant increasing trends (P <0.01). The global mean annual land temperature has increased by 0.835℃ from 8.518℃ to 9.353℃ since the 1980s. The results show that the rates of change of the mean annual temperature of the seven datasets on average were 0.362℃/10a in the northern hemisphere and 0.147℃/10a in the southern hemisphere, and with both regions exhibiting significant increasing trends (P<0.01, excluding the southern hemisphere data for NCEP/DOE and CFSR). The rates of increase in the northern hemisphere were clearly higher than those in the southern hemisphere.
Table 2 Global, northern and southern hemispheres annual mean temperature (℃) and the rate of change (℃/10a)
CRU NCEP/NCAR NCEP/DOE ERA5 GHCN CFSR JRA55 MEAN
Annual mean
temperature (℃)
Global land 8.793 8.008 8.460 8.556 9.002 8.541 9.093 8.636
Northern Hemisphere 5.612 4.974 5.397 5.488 5.939 5.579 6.139 5.590
Southern Hemisphere 21.623 20.493 21.063 21.179 21.532 20.795 21.450 21.162
Rate of change of temperature
(℃/10a)
Global land 0.310** 0.283** 0.307** 0.347** 0.403** 0.231** 0.358** 0.320**
Northern Hemisphere 0.347** 0.332** 0.364** 0.380** 0.439** 0.271** 0.403** 0.362**
Southern Hemisphere 0.161** 0.081** 0.072* 0.211** 0.267** 0.066* 0.169** 0.147**

Note: * and ** mean that it is significant at the 0.05 and 0.01 levels, respectively.

Inspection of the seven reanalysis datasets (Figure 2) revealed that the increasing rates for the mean annual temperature at all latitudes in the northern hemisphere were higher than those at the same latitudes in the southern hemisphere. The warming trends were observed for almost all latitudes except at some of the latitudes in the southern hemisphere. All the results for the seven datasets indicated that the highest warming rate occurred at high latitudes in the northern hemisphere, with a maximum rate occurring in the range 80°N-90°N (0.707℃/10a), followed by 70°N-80°N (0.680℃/10a) and then 60°N-70°N (0.484℃/10a).
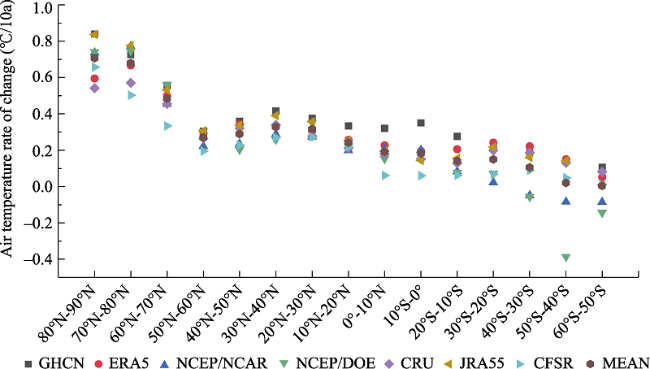
Figure 2 The distributions of the rates of change of temperature with latitude
Table 3 Rate of change of temperature (℃/10a) and temperature variation (℃) with latitude
Latitude (°N) Rate of change of temperature (℃/10a) Temperature
variation (℃)
Latitude (°S) Rate of change of temperature (℃/10a) Temperature variation (℃)
80-90 0.707** 2.757 10-0 0.182** 0.710
70-80 0.680** 2.652 20-10 0.141** 0.550
60-70 0.484** 1.888 30-20 0.150** 0.585
50-60 0.270** 1.053 40-30 0.105** 0.410
40-50 0.289** 1.127 50-40 0.02 0.078
30-40 0.328** 1.279 60-50 0.004 0.016
20-30 0.316** 1.232
10-20 0.242** 0.944
0-10 0.191** 0.745

Note: ** means that it is significant at the 0.01 level.

The warming trend slowed down at 40°N-50°N and 50°N-60°N, and this was actually lower than in the subtropical zones. In the southern hemisphere, the rate of increase in the mean annual temperature decreased as the latitude increased. At latitudes greater than 30°S-60°S, a decreasing trend was observed in the mean annual temperature as evidenced for the NCEP/NCAR and NCEP/DOE datasets.

4.2.2 Spatial characteristics

The spatial variation of the mean annual temperature for the reanalysis datasets illustrated that most of the land surface experienced a warming trend and represented 98.176% (CRU), 94.490% (NCEP/NCAR), 91.428% (NCEP/DOE), 99.405% (ERA5), 98.324% (GHCN), 85.373% (CFSR) and 98.225% (JRA55) of the total land area, respectively. The land areas which were clearly subject to warming (P < 0.05) accounted for 82.543% (CRU), 68.874% (NCEP/NCAR), 67.889% (NCEP/DOE), 82.373% (ERA5), 83.454% (GHCN), 54.519% (CFSR) and 81.043% (JRA55) of the total land. These findings basically meant that the global land surface temperature had increased. According to the average values for the seven datasets, the areas that had undergone significant warming accounted for 80% and greater of the total land area (Figure 3).
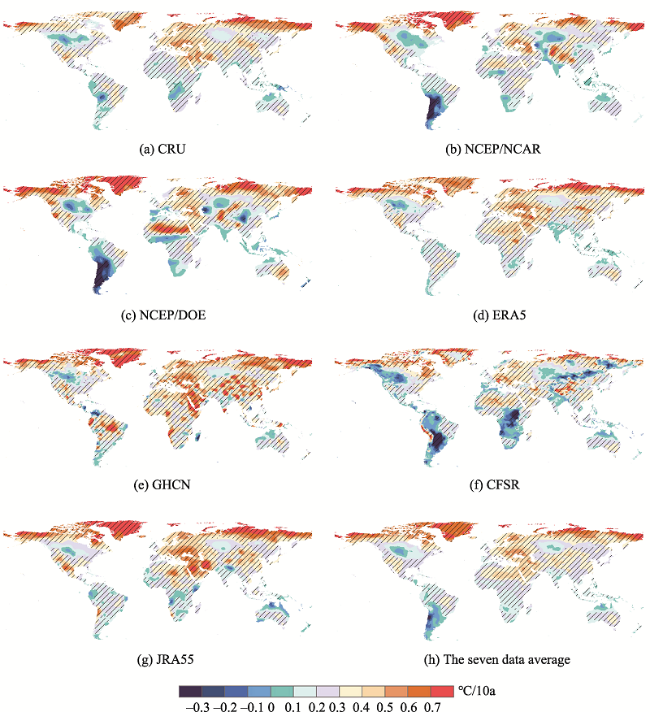
Figure 3 The spatial distributions for the global rates of change of temperature (The shaded parts represent a significant tendency at the 5% level)
Note: This figure has been prepared based on the standard map provided by the Ministry of Natural Resources of the People’s Republic of China, which can be found on the service website (GS(2016)2965). No modification of the base map was performed.
To confirm the spatial temperature characteristics for the areas subject to warming, overlays of the areas in question for all datasets were prepared and the overlapping areas were taken as being representative of the spatial characteristics since the 1980s (Figure 3). As may be seen, the target areas were concentrated in northern and eastern Canada (0.594℃/10a), parts of Greenland (0.687℃/10a), eastern (0.692℃/10a) and northern Russia (0.594℃/10a), the Middle East (0.446℃/10a), Northern Africa (0.435℃/10a), and Southern Europe (0.469℃/10a). The values in brackets represent the average values. Amongst these regions, eastern Russia had the largest warming rate relative to any continent.

4.2.3 Spatial change of the mean annual temperature in major countries

To further explore the variation of the mean annual temperature in different countries, the rate of change of the mean annual temperature and its variation based on national boundaries were calculated to ascertain the trends. Especially, if the area of a country is relatively small, the accuracy of the data will be affected due to the cutting error. Thus this study examined only 146 countries and obtained the magnitude and rate of temperature variation for these countries. The results showed that the number of countries with warming trends accounted for 98.630% (CRU), 97.945% (GHCN), 95.205% (NCEP/NCAR), 91.096% (NCEP/DOE), 100% (ERA5), 95.890% (JRA55) and 88.356% (CFSR), respectively, of the countries. The number of countries with clear warming trends accounted for 95.205% (CRU), 95.890% (GHCN), 84.247% (NCEP/NCAR), 67.808% (NCEP/DOE), 97.260% (ERA5), 87.671% (JRA55) and 65.735% (CFSR), respectively, of the total land area.
To compare the temperature variation of the countries, we first analyzed the differences between the results of the seven datasets. The rate of temperature change was calculated, and the results for the correlation coefficients for the seven datasets ranged from 0.349-0.910, thus suggesting that the trends in the rates of temperature change for the seven datasets were similar. Each country selected was given a number in ascending or descending order to express the tendency with respect to temperature change. Also each dataset was allocated a serial number and from which we were able to compute the values of the seven correlation coefficients. As can be seen from the results, the correlation coefficients for the seven datasets ranged from 0.424 to 0.873, confirming highly significant correlation, which in turn meant that the sequences obtained from the seven datasets were also highly coincident with each other. Thus, we were able to calculate the rate of temperature variation on the basis of the average result for each of the seven datasets and to compare the results for the different countries (Table 4).
Table 4 Correlation coefficients for the rates of change of temperature for the seven datasets (bold) and correlation coefficients for the countries (by serial number)
CRU NCEP/NCAR NCEP/DOE ERA5 GHCN CFSR JRA55
CRU 1 0.529** 0.574** 0.488** 0.856** 0.827** 0.673**
NCEP/NCAR 0.586** 1 0.492** 0.437** 0.537** 0.490** 0.475**
NCEP/DOE 0.591** 0.534** 1 0.910** 0.525** 0.390** 0.438**
ERA5 0.514** 0.446** 0.873** 1 0.470** 0.349** 0.405**
GHCN 0.830** 0.588** 0.591** 0.512** 1 0.868** 0.569**
CFSR 0.814** 0.529** 0.488** 0.424** 0.859** 1 0.626**
JRA55 0.666** 0.546** 0.494** 0.404** 0.641** 0.687** 1

Note: ** means that it is significant at the 0.01 level.

Of the 146 countries selected, 136 countries exhibited warming trends (P <0.05) in terms of the results for the mean annual temperature, accounting for 93.151% of the total number of countries. Also, there were 130 countries exhibiting extreme warming trends (P <0.01), representing 89.041% of the total. The number of countries with no significant temperature change accounted for 6.849% of the total. A reduction in temperature was noted for only three countries, namely, Argentina, Chile, and Paraguay (P >0.05, 2.055%). Countries with no significant temperature change or decreasing trends were all in the southern hemisphere, mainly in western South America and Southern Africa. The most serious warming trends were found at latitudes 40°N and above (greater than 0.45℃/10a), especially at higher latitudes, such as Greenland, followed by Russia. Slow warming areas were mainly in New Zealand, regions near the equator in South America, Southeast Asia, as well as Southern Africa, which had rates of less than 0.15℃/10a.
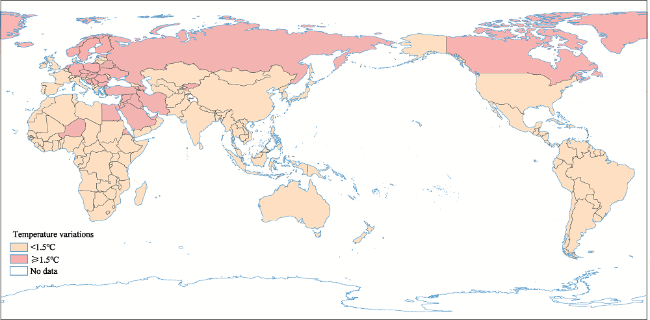
Figure 4 Spatial distribution of countries and regions experiencing a warming of 1.5℃ and greater
Note: This figure has been prepared based on the standard map of the Ministry of Natural Resources of the People’s Republic of China, which can be found on the service website (GS(2016)1563). There has been no modification to the base map.
Since the 1980s, four countries have exhibited a warming of over 2.0℃; 30 countries between 1.5℃ and 2.0℃; 34 countries between 1.0℃ and 1.5℃; 60 countries between 0.5℃ and 1.0℃; and 15 countries between 0℃ and 0.5℃. Three countries have experienced a decreasing trend of temperature, all within 1.0℃. That is to say, during the study period, a warming of greater than 1.5℃ was found in 34 countries (23%) and a warming of more than 0℃ was noted in 68 countries (47%) (Table 5).
Table 5 Rates of temperature changes for major countries and regions (℃/10a)
Country/Region CRU GHCN NCEP/NCAR NCEP/DOE ERA5 JRA55 CFSR MEAN
Greenland 0.526** 0.894** 0.71** 0.743** 0.542** 0.711** 0.455** 0.654**
Ukraine 0.528** 0.586** 0.55** 0.458** 0.564** 0.624** 0.424** 0.533**
Russia 0.557** 0.542** 0.489** 0.551** 0.578** 0.563** 0.385** 0.523**
Romania 0.571** 0.574** 0.536** 0.377** 0.509** 0.583** 0.471** 0.517**
Slovakia 0.466** 0.622** 0.457** 0.405** 0.51** 0.535** 0.582** 0.511**
Hungary 0.523** 0.449** 0.509** 0.462** 0.491** 0.564** 0.528** 0.504**
Finland 0.485** 0.553** 0.485** 0.555** 0.507** 0.508** 0.431** 0.503**
Serbia 0.551** 0.529** 0.525** 0.527** 0.443** 0.496** 0.442** 0.502**
Armenia 0.426** 0.642** 0.699** 0.593** 0.44** 0.459** 0.056 0.474**
Bosnia and Herzegovina 0.523** 0.495** 0.443** 0.369** 0.436** 0.59** 0.452** 0.473**
Norway 0.537** 0.535** 0.427** 0.3** 0.579** 0.648** 0.272** 0.471**
Bulgaria 0.533** 0.659** 0.382** 0.16 0.454** 0.518** 0.508** 0.459**
Azerbaijan 0.438** 0.608** 0.477** 0.43** 0.438** 0.439** 0.358** 0.455**
Kyrgyzstan 0.388** 0.632** 0.701** 0.797** 0.291** 0.26** 0.109 0.454**
Syria 0.468** 0.537** 0.383** 0.338** 0.5** 0.6** 0.342** 0.453**
Turkey 0.466** 0.524** 0.388** 0.473** 0.487** 0.532** 0.25** 0.446**
Belarus 0.458** 0.527** 0.411** 0.419** 0.445** 0.514** 0.33** 0.444**
Jordan 0.505** 0.665** 0.236** 0.255** 0.448** 0.575** 0.411** 0.442**
Saudi Arabia 0.406** 0.633** 0.304** 0.35** 0.443** 0.591** 0.362** 0.441**
Iran 0.482** 0.435** 0.346** 0.37** 0.441** 0.644** 0.361** 0.44**
Poland 0.447** 0.496** 0.36** 0.39** 0.444** 0.474** 0.436** 0.435**
Iraq 0.496** 0.408** 0.391** 0.373** 0.491** 0.617** 0.262** 0.434**
Czech Republic 0.471** 0.458** 0.29* 0.343* 0.454** 0.502** 0.516** 0.433**
United Arab Emirates 0.41** 0.601** 0.29** 0.288** 0.4** 0.527** 0.422** 0.42**
Iceland 0.462** 0.517** 0.348** 0.364** 0.477** 0.395** 0.297** 0.408**
Eritrea 0.348** 0.995** 0.281** 0.373** 0.303** 0.326** 0.215** 0.406**
Egypt 0.45** 0.529** 0.26** 0.378** 0.445** 0.411** 0.341** 0.402**
Germany 0.42** 0.38** 0.297** 0.344** 0.417** 0.462** 0.492** 0.402**
Sweden 0.415** 0.451** 0.436** 0.353** 0.428** 0.422** 0.299* 0.401**
Canada 0.286** 0.452** 0.421** 0.436** 0.374** 0.435** 0.346** 0.393**
Estonia 0.427** 0.378** 0.323* 0.427** 0.397** 0.385** 0.391** 0.39**
Austria 0.457** 0.476** 0.189 0.062 0.462** 0.512** 0.554** 0.387**
Netherlands 0.411** 0.377** 0.376** 0.393** 0.377** 0.398** 0.377** 0.387**
Country/Region CRU GHCN NCEP/NCAR NCEP/DOE ERA5 JRA55 CFSR MEAN
Niger 0.243** 0.323** 0.343** 0.646** 0.385** 0.355** 0.405** 0.386**
Libya 0.26** 0.404** 0.321** 0.498** 0.41** 0.469** 0.309** 0.381**
Lithuania 0.419** 0.435** 0.263* 0.307* 0.393** 0.425** 0.318* 0.366**
Georgia 0.429** 0.495** 0.3** 0.254* 0.489** 0.511** 0.08 0.365**
Croatia 0.519** 0.344** 0.187* 0.03 0.436** 0.584** 0.453** 0.365**
Latvia 0.414** 0.403** 0.293* 0.325* 0.378** 0.403** 0.321* 0.363**
Denmark 0.414** 0.416** 0.304** 0.261* 0.373** 0.371** 0.386** 0.361**
Belgium 0.427** 0.325** 0.306** 0.351** 0.369** 0.407** 0.304** 0.356**
Mongolia 0.435** 0.436** 0.226* 0.265* 0.391** 0.422** 0.133 0.33**
Sudan 0.31** 0.384** 0.285** 0.372** 0.435** 0.335** 0.18** 0.329**
Afghanistan 0.354** 0.39** 0.181* 0.333** 0.395** 0.407** 0.24** 0.329**
Djibouti 0.305** 0.793** 0.234** 0.103 0.22** 0.301** 0.334** 0.327**
Greece 0.422** 0.374** 0.346** 0.217** 0.365** 0.273** 0.287** 0.326**
Montenegro 0.517** 0.363** 0.141 -0.102 0.434** 0.509** 0.396** 0.323**
Algeria 0.207** 0.349** 0.307** 0.478** 0.326** 0.288** 0.297** 0.322**
Bhutan 0.232** 0.693** 0.468* 0.412** 0.184** 0.132* 0.116 0.32**
Kosovo 0.511** 0.276** 0.201* 0.01 0.465** 0.394** 0.36** 0.317**
United States of America 0.33** 0.359** 0.306** 0.305** 0.326** 0.358** 0.228** 0.316**
Chad 0.24** 0.309** 0.222** 0.29** 0.395** 0.472** 0.235** 0.309**
Ethiopia 0.265** 0.586** 0.258** 0.26** 0.281** 0.249** 0.17* 0.296**
China 0.255** 0.394** 0.266** 0.236** 0.303** 0.315** 0.28** 0.293**
Nepal 0.295** 0.42** 0.587** 0.639** 0.18** -0.174 0.102 0.293**
Yemen 0.199** 0.676** 0.19** 0.113* 0.261** 0.279** 0.298** 0.288**
Switzerland 0.4** 0.501** -0.083 -0.081 0.354** 0.408** 0.443** 0.278**
Turkmenistan 0.352** 0.406** 0.042 0.084 0.4** 0.401** 0.249* 0.276**
Kenya 0.21** 0.229** 0.379** 0.447** 0.223** 0.244** 0.195** 0.275**
Mali 0.15** 0.267** 0.302** 0.402** 0.301** 0.192** 0.312** 0.275**
Mauritania 0.182** 0.34** 0.272** 0.381** 0.268** 0.153* 0.287** 0.269**
Italy 0.369** 0.392** 0.172** 0.04 0.327** 0.262** 0.286** 0.264**
South Korea 0.303** 0.511** 0.192** 0.17* 0.297** 0.216** 0.158** 0.264**
Uzbekistan 0.349** 0.368** -0.02 0.039 0.437** 0.358** 0.306** 0.263**
Pakistan 0.319** 0.259** 0.34** 0.361** 0.204** 0.23** 0.121 0.262**
Mexico 0.278** 0.325** 0.213** 0.193** 0.282** 0.391** 0.152** 0.262**
DPRK 0.257** 0.41** 0.217** 0.206* 0.299** 0.297** 0.148 0.262**
France 0.327** 0.316** 0.259** 0.184** 0.276** 0.284** 0.183** 0.261**
Albania 0.447** 0.325** 0.182* -0.111 0.375** 0.373** 0.179** 0.253**
Somaliland 0.178** 0.557** 0.175** 0.206** 0.226** 0.131** 0.277** 0.25**
Tajikistan 0.309** 0.444** 0.181 0.173 0.332** 0.205 0.101 0.249**
Oman 0.326** 0.221** 0.173** 0.144** 0.206** 0.358** 0.281** 0.244**
Japan 0.329** 0.39** 0.04 0.056 0.324** 0.349** 0.215** 0.243**
Country/Region CRU GHCN NCEP/NCAR NCEP/DOE ERA5 JRA55 CFSR MEAN
Tunisia 0.298** 0.363** 0.175** 0.165** 0.282** 0.29** 0.059 0.233**
Western Sahara 0.234** 0.246** 0.233** 0.337** 0.238** 0.125 0.213** 0.232**
Myanmar 0.169** 0.302** 0.366** 0.259** 0.133** 0.222** 0.172** 0.232**
Kazakhstan 0.301** 0.295** 0.099 0.101 0.348** 0.291** 0.178 0.23*
Cote d'Ivoire 0.171** 0.392** 0.199** 0.073* 0.195** 0.27** 0.312** 0.23**
Central African Republic 0.205** 0.312** 0.27** 0.099 0.357** 0.332** 0.001 0.225**
Uganda 0.204** 0.489** 0.361** 0.322** 0.268** 0.122** -0.245 0.217**
Laos 0.199** 0.271** 0.193** 0.162** 0.153** 0.328** 0.195** 0.214**
Cameroon 0.173** 0.522** 0.132** 0.024 0.244** 0.215** 0.171** 0.211**
Tanzania 0.167** 0.25** 0.316** 0.317** 0.215** 0.146** 0.064 0.211**
India 0.225** 0.409** 0.185** 0.206** 0.104** 0.176** 0.145** 0.207**
Guinea 0.202** 0.48** 0.193** 0.132** 0.143** 0.135** 0.163 0.207**
Gabon 0.166** 0.363** 0.119** 0.182** 0.204** 0.287** 0.096* 0.203**
United Kingdom 0.262** 0.157* 0.21** 0.13 0.224** 0.209** 0.204** 0.199**
Cambodia 0.199** 0.233** 0.184** 0.12** 0.157** 0.303** 0.193** 0.199**
Thailand 0.197** 0.354** 0.193** 0.138** 0.111* 0.17** 0.218** 0.197**
Somalia 0.116** 0.404** 0.295** 0.167** 0.171** -0.003 0.224** 0.196**
Spain 0.265** 0.429** 0.091 0.03 0.239** 0.252** 0.045 0.193**
South Sudan 0.188** 0.299** 0.25** 0.236** 0.464** 0.266** -0.356 0.192**
Madagascar 0.237** 0.011 0.192** 0.208** 0.199** 0.245** 0.252** 0.192**
Namibia 0.179** 0.374** 0.035 0.016 0.207** 0.396** 0.129* 0.191**
Burundi 0.14** 0.342** 0.332** 0.293** 0.19** 0.056 -0.026 0.19**
Brazil 0.262** 0.327** 0.154** 0.131** 0.216** 0.189** 0.03 0.187**
Morocco 0.26** 0.278** 0.151* 0.15* 0.215** 0.168** 0.084 0.187**
Burkina Faso 0.179** 0.303** 0.092* 0.05 0.215** 0.214** 0.233** 0.184**
Senegal 0.227** 0.353** 0.209** 0.186** 0.14** 0.131** 0.031 0.182**
Malawi 0.173** 0.269** 0.215** 0.213** 0.14** 0.152** 0.108 0.181**
Republic of the Congo 0.124** 0.309** 0.183** 0.15** 0.264** 0.212** 0.025 0.181**
Guatemala 0.221** 0.298** 0.11* 0.076 0.219** 0.313** 0.026 0.18**
Nigeria 0.186** 0.426** 0.11** -0.044 0.194** 0.168** 0.216** 0.18**
Vietnam 0.161** 0.143** 0.174** 0.175** 0.139** 0.299** 0.157** 0.178**
Ghana 0.165** 0.334** 0.079* -0.037 0.204** 0.265** 0.222** 0.176**
Liberia 0.154** 0.401** 0.201** 0.097** 0.114** 0.042 0.209** 0.174**
Guinea-Bissau 0.234** 0.428** 0.196** 0.135* 0.107** 0.033 0.083 0.174**
Mozambique 0.23** 0.301** 0.169** 0.224** 0.158** 0.117** 0.015 0.174**
Australia 0.162** 0.179** 0.15** 0.229** 0.203** 0.1* 0.192** 0.174**
Venezuela 0.221** 0.231** 0.19** 0.135* 0.176** 0.212** 0.038 0.172**
Benin 0.176** 0.343** 0.079* -0.077 0.211** 0.236** 0.229** 0.171**
South Africa 0.264** 0.254** 0.116* 0.106 0.217** 0.135* 0.09 0.169**
Country/Region CRU GHCN NCEP/NCAR NCEP/DOE ERA5 JRA55 CFSR MEAN
Democratic Republic of the Congo 0.075* 0.336** 0.266** 0.22** 0.275** 0.129** -0.13 0.167**
Sierra Leone 0.176** 0.456** 0.185** 0.098** 0.106** -0.073 0.218** 0.167**
Ecuador 0.053 0.685** 0.06 0.036 0.098* -0.029 0.234** 0.162**
Dominica 0.107** 0.223** 0.198** 0.143** 0.186** 0.071 0.175** 0.158**
Zambia 0.113* 0.261** 0.208** 0.156* 0.136* 0.162** 0.032 0.153**
Angola 0.042 0.458** 0.186** 0.178** 0.177** 0.087 -0.078 0.15**
Peru 0.066 0.327** 0.047 0.004 0.18** 0.158** 0.242** 0.146**
Malaysia 0.168** 0.265** 0.067** 0.026 0.1** 0.192** 0.206** 0.146**
Ireland 0.148* 0.206** 0.141** 0.138* 0.13* 0.149* 0.106 0.145*
Guyana 0.192** 0.306** 0.048 0.19** 0.097* 0.215** -0.043 0.144**
Suriname 0.175** 0.238** 0.099 0.212** 0.074 0.104* 0.093 0.142**
Botswana 0.219** 0.234** 0.125 0.121 0.115 0.078 0.101 0.142
Portugal 0.219** 0.339** 0.046 0.022 0.173** 0.159** 0.027 0.141*
Zimbabwe 0.229** 0.142* 0.125* 0.211 0.105 0.148* -0.036 0.132*
Cuba 0.19** 0.097* 0.182** 0.162** 0.196** -0.038 0.119* 0.13**
Colombia 0.173** 0.099* 0.175** 0.14** 0.178** 0.144** -0.002 0.129**
Sri Lanka 0.178** 0.239** 0.148** 0.102 0.042 0.042 0.117* 0.124**
Indonesia 0.12** 0.216** 0.094** 0.042 0.112** 0.112** 0.153** 0.121**
Bangladesh 0.096 0.297** 0.089* 0.156** 0.1* 0.113** -0.005 0.121**
Costa Rica 0.095* 0.133* 0.164** 0.074 0.112* 0.132* 0.095* 0.115**
Belize 0.221** -0.002 0.123** 0.061 0.197** 0.187** 0.009 0.114**
Philippines 0.13** 0.211** 0.062* 0.011 0.114** 0.105** 0.102** 0.105**
Panama 0.121** 0.127* 0.162** 0.027 0.143** 0.02 0.126** 0.104*
Lesotho 0.248** 0.067 0.067 -0.144 0.29** 0.19** -0.047 0.096
Papua New Guinea -0.033 0.344** 0.107** 0.018 0.063* 0.044 0.089* 0.09**
Nicaragua 0.124** -0.056 0.15** 0.115 0.112** 0.13* -0.007 0.081*
New Zealand 0.134* 0.257** 0.043 -0.296 0.176** 0.084 0.087 0.069
Honduras 0.161** -0.042 0.1* 0.019 0.12** 0.093* -0.065 0.055
Bolivia -0.022 0.313** -0.178 -0.24 0.247** 0.235** -0.026 0.047
Uruguay 0.129* 0.137* -0.037 -0.072 0.119* 0.122* -0.09 0.044
East Timor 0.006 0.042 0.126** 0.117** 0.082* -0.052 -0.149 0.024
Paraguay 0.159** 0.331** -0.212 -0.356 0.33** 0.26** -0.549 -0.005
Argentina 0.112** 0.148** -0.245 -0.401 0.195** 0.159** -0.121 -0.022
Chile 0.098* 0.177** -0.746 -0.883 0.116** 0.367** 0.071 -0.114

Note: * and ** mean that it is significant at the 0.05 and 0.01 levels, respectively.

5 Discussion

(1) The results of this study have been compared with those of existing research as listed in Table 6. It can be seen that the annual rate of change of the global land temperature during the period 1981-2019 was 0.320℃/10a, a value which is slightly higher than that for inde-pendent studies as the trend in the rate of temperature change tends to increase for a longer study period. For example, from the early 1980s to around 2010, the rates of temperature increase were all below 0.2℃/10a; to 2014 (2015) the rates were between 0.25 and 0.30℃/10a; to 2019, the rates were between 0.231 and 0.403℃/10a. There is also evidence for an increasing global mean annual temperature for land.
Table 6 Comparison of the results of different groups since the 1980s
Study area Author(s) Study period Data Rate of temperature change (℃/10a)
Foster and Rahmstorf, 2011 1979-2010 GISS 0.171
GHCN 0.175
HadCRUT3v 0.17
RSS 0.157
UAH 0.141
Sun, 2018 1979-2015 CMA-LASTv1.0 0.25
CRUTEM4.1.1 0.254
GHCN-V3.2.0 0.273
Global Wang et al., 2017 1979-2014 CRUTEM4.4.0.0 0.304±0.060
Sun, 2018 1979-2014 CMA-LAST 0.272±0.025
Hansen et al., 2010 1979-2010 GISS 0.254±0.049
Lawrimore et al., 2011 1979-2010 GHCN 0.273±0.047
Kim et al., 2013 1979-2012 ERA-Interim 0.11
Chu et al., 2016 1981-2010 MERRA 0.13
This study 1981-2019 CRU 0.310
NCEP/NCAR 0.283
NCEP/DOE 0.307
ERA5 0.347
GHCN 0.403
CFSR 0.231
JRA55 0.358
In average 0.320
Sun, 2018 1979-2015 CMA-LASTv1.0 0.319
Xu et al., 2018 1979-2014 CMA-LAST 0.305±0.030
Northern
Hemisphere
Jones et al., 2012 1979-2010 CRUTEM4 0.35
1979-2010 ERA-Interim 0.38
This study 1981-2019 CRU 0.347
NCEP/NCAR 0.332
NCEP/DOE 0.364
ERA5 0.380
GHCN 0.439
CFSR 0.271
JRA55 0.403
In average 0.362
Southern
Hemisphere
Sun, 2018 1979-2015 CMA-LASTv1.0 0.142
Jones et al., 2012 1979-2010 CRUTEM4 0.13
1979-2010 ERA-Interim 0.12
Xu et al., 2018 1979-2014 CMA-LAST 0.142±0.021
This study 1981-2019 CRU 0.161
NCEP/NCAR 0.081
NCEP/DOE 0.072
ERA5 0.211
GHCN 0.267
CFSR 0.066
JRA55 0.169
In average 0.147
The rate of variation of land temperature in the northern hemisphere since the 1980s calculated on the basis of the seven datasets examined in this study was also slightly higher than that found in independent research. As for the southern hemisphere, the results in this study for the NCEP/NCAR, NCEP/DOE and CRSR datasets were slightly lower than the values for existing research, while the results for datasets were slightly higher.
The reasons that led to differences in the results for the seven datasets are listed below. Previous studies have pointed out that the precision of the reanalysis data may be affected by the observation error, the prediction error, and the assimilation error (Thorne and Vose, 2010; Dee et al., 2014; Parker, 2016). For instance, coupling of climate forecasting models and assimilation systems can lead to higher results for the CFSR and JRA55 datasets, as these sources assimilate the observation resources, the sea ice and aerosols. The limited data coverage for the small land area regions in the southern hemisphere is another reason for differences in the results (Saha et al., 2010; Kobayashi et al., 2015). Given that the GHCN and CRU data are based on interpolations at meteorological stations globally, their results are higher than those for the ERA5, NCEP/DOE and NCEP/NCAR datasets. The NCEP/NCAR dataset is a first-generation reanalysis dataset, which does not consider surface change during the data assimilation process. That is why the former results are lower than those of the NCEP/DOE and the ERA5 (Kalnay, 1996; Kanamitsu et al., 2002; Hersbach, 2020).
(2) The results showed that the highest warming rate occurred for 70°N-90°N, the same as reported by Kim et al. (2013) and Screen (2014). The CRU data indicated that the areas of land experiencing a warming trend accounted for 98.176% of the total area of the globe, the results for the NCEP/NCAR, NCEP/DOE, ERA5, GHCN, CFSR and JRA55 datasets being 94.490%, 91.428%, 99.405%, 98.324%, 85.373% and 98.225%, respectively. This finding is in accordance with the conclusion that climate warming extended to almost all land areas during the period 1977 and 2014 as reported by Wang et al. (2017) based on analysis of CRUTEM4.4.0.0. Current research did not reveal the spatial characteristics of the temperature change at the regional level, thus we were not able to make such a comparison.
(3) This study calculated and analyzed the rates of temperature variation and the temperature values for 146 countries since the 1980s and selected those exhibiting clear and definitive changes. To date, the temperature changes have been examined in many countries (Table 7). To aid comparison with previous research, we have listed the temperature characteristics of selected countries for the same period (Table 7). The results for the CRU dataset proved to be similar to those reported in independent work.
Table 7 Comparisons based on the temperature variations of different countries
Country/region Author(s) Data source Study period Rate of temperature change (℃/10a) Main conclusion (℃/10a)
Slovenia De Luis et al., 2014 Meteorological stations 1959-2008 0.15-0.36 0.23**
Switzerland Ceppi et al., 2012 Meteorological stations 1959-2008 0.35 0.28**
Nigeria Oguntunde et al., 2012 CRU 1901-2000 0.03 -0.002
Japan Fujibe, 2015 Meteorological stations 1979-2013 0.29 0.35**
Canada Vincent et al., 2007 Meteorological stations 1953-2005 1.2 1.29**
India Arora et al., 2005 Meteorological stations 1941-1999 0.42 0.57*
South Korea Kim et al., 2015 Meteorological stations 1960-2010 0.2 0.22**
Saudi Arabia Almazroui et al., 2012 Meteorological stations 1979-2009 0.51 0.407**
Central Asia Hu et al., 2014 Meteorological stations 1979-2011 0.41 0.364**
Cambodia Thoeun, 2015 Meteorological stations 1951-2001 0.23 0.147**
Armenia Gevorgyan et al., 2016 Meteorological stations 1961-2014 0.18 0.19**
China Ge et al., 2013 Meteorological stations 1951-2010 0.21±0.02 0.22**
Du et al., 2019 Meteorological stations 1998-2012 -0.221 -0.192

Note: * and ** mean that it is significant at the 0.05 and 0.01 levels, respectively.

(4) During the period 1981-2019, countries and regions exhibiting the fastest warming were located mainly at high latitudes in the northern hemisphere. However, in the southern hemisphere, the growth rate for the mean annual temperature decreased as the latitude increased. For instance, the NCEP/NCAR and NCEP/DOE datasets showed a decreasing trend over the range 30°S-60°S. Existing studies have indicated that climate warming in the Arc-tic region is more serious than in any other place on the globe, the increase being 1.2℃/10a, which is 2-3 times the global average. This phenomenon has been described as the Arctic Amplification (Serreze and Barry, 2011). The differential warming is considered to be due mainly to regional feedback and heat transfer to the polar region (Wu et al., 2019). A decrease of sea ice has also led to a decrease of the regional albedo; the near-surface temperature increased as the surface of the ocean released more heat into the atmosphere. A positive ice-albedo feedback mechanism then resulted (Bushuk et al., 2017). Besides the effect due to the area of sea ice, Lang et al. (2017) used numerical modeling to show that the Arctic Amplification was still present when the sea ice became thinner, the contribution rate being 37%. Graversen and Wang (2019) stated that the change of sea ice cannot explain the Arctic Amplification. The increase of clouds and aqueous water vapor correlated positively with the increase of the long-wave radiative flux, which caused further aggravation of warming in the Arctic Region (Liu and Key, 2014). The Pacific Decadal Oscillation (PDO) and the Atlantic Multidecadal Oscillation (AMO) are also important factors that lead to warming in the Arctic Region. The most apparent warming in the Arctic Region was observed when the PDO and the AMO were both in positive phase (2016). In addition, the weakening of the polar vortex, the strengthening of southerly winds aroused by the northward movement of the center of the Siberian High, as well as a transfer of warm air to the polar regions were also primary causes (Feng and Wu, 2015; Overland and Wang, 2016).
However, the countries and regions with the highest decreasing rate of mean annual temperature were located in central and southern South America within 30°S-60°S, such as Chile, Argentina, and Paraguay. Falvey and Garreaud’s research (2009) indicated that the decreasing rate of temperature in southern South America along the Pacific Ocean coast during 1979-2006 was -0.2℃/10a, a result which is similar to that found in the present study. Vuille et al. (2015) and Burger et al. (2018) were of the opinion that this variation was due to the transfer of the Interdecadal Pacific Oscillation (IPO) and the PDO to the negative phase. Schneider et al. (2017) pointed out that the cooling trend for South America is related to the strengthening of the Southeast Pacific Anticyclone (SEPA), as it intensified the upwelling and compensation currents off the southeast coasts of the Pacific Ocean, so that the temperature of the sea surface and of the countries near the coast decreased (Gupta and England, 2006). In addition, the SEPA enhanced the cooling trend in the negative IPO phase (Garreaud and Falvey, 2010).
(5) The global warming hiatus over the period 1998-2012 has attracted widespread interest amongst the science community, and was listed as one of the “Top 10 Science Stories of 2014” (Morello et al., 2014). Easterling and Wehner (2009) argued that global warming had stagnated since 1998. This paper presents an opposite conclusion based primarily on the results of the Mann-Kendall mutation tests on the CRU data from 1901-2019. The results show that, although the point of intersection of the positive sequence curve (UF) and the negative sequence curve (UB) was found around 1998, the value was not within the 0.05 confidence level. Thus, the year 1998 was not a time point exhibiting an abrupt temperature change (Figure 5). The mean annual global land temperature during 1998-2019 did increase, however, that of 1998-2012 did not pass the significance test. The period of 1998-2019 is thought to be the fastest warming period (extremely clear warming trend) in the last 100 years (Table 8). It is concluded that a warming trend for the period 1998-2012 existed based on extending the monitoring period to 2019. Hence, the authors hold a contrary opinion to that of Easterling and Whhner (2009), namely, that there had not been a global warming hiatus since 1998. Mudelsee (2019) reached a similar conclusion to that of this study.
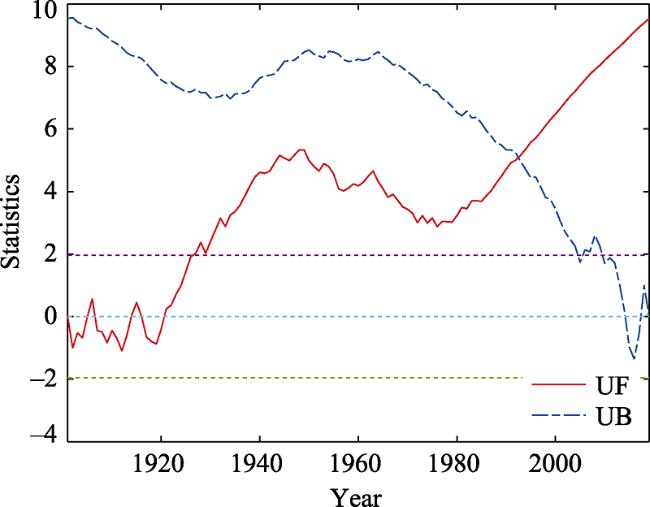
Figure 5 Results of Mann-Kendall mutation tests from 1901 to 2019
Table 8 Global temperatures and trends for different periods
Period Temperature (℃) Rate of temperature
change (℃/10a)
1901-2016 8.260 0.109*
1970-1997 8.277 0.257*
1998-2012 8.965 0.207
1998-2019 9.073 0.279*

Note: * means that it is significant at the 0.05 level.

Besides, due to the differences in the spatial resolutions of the seven datasets, errors associated with the resampling of data cannot be avoided. For instance, during the data vectorization, there were errors caused by graph correction, and boundary tracking; errors also existed in the cutting and splicing of the layers. All these sources can have a negative effect on the accuracy of the rate change data.

6 Conclusions

Much research has been undertaken on global temperature change since the 1980s, but there has been a relative lack of studies that have focused on the spatial heterogeneity of global temperature change at a country level basis. Since the IPCC highlighted global warming of 1.5℃ above pre-industrial levels, governments and the public have paid more attention to the climate change debate and have started to take measures to mitigate the effects on the planet. This study has surveyed key scientific literature in the context of global climate governance and there is some evidence that a hiatus phase of temperature change has occurred since the 1980s. The main conclusions are as follows:
(1) The trend regarding the variation of the global land mean annual temperature since the 1980s was 0.320℃/10a, indicating an extremely clear increasing trend (P<0.01) with a cumulative increase of 0.835℃. The rates of variation for the southern and northern hemispheres were 0.147℃/10a and 0.362℃/10a, respectively, both regions witnessing extremely clear increasing trends with cumulative increases of 0.874℃ and 0.828℃, respectively. The rates of variation for the mean annual temperatres at all latitudes in the northern hemisphere were higher than those at the same latitudes in the southern hemisphere. The regions with the highest warming rate were found at 80°N-90°N, with an average warming rate of 0.707℃/10a, followed by 70°N-80°N and 60°N-70°N. We believe that no global warming hiatus has occurred since 1998.
(2) Since the 1980s, a warming trend was observed for nearly 97% of global land, 80% of which exhibited an extremely clear trend, being distributed mainly in eastern and northern Canada, and some parts of Greenland in North America, eastern and northern Russia, and the Middle East, NorthernAfrica, as well as most parts of Southern Europe.
(3) Of the 146 countries examined, clear warming trends were found in 136 countries, accounting for 93.151% of the total number of countries examined. No obvious change was discerned for the other 10 countries, and 3 out of the 10 countries witnessed decreasing trends (P >0.05), representing 2.055% of the total number of countries.
(4) Since the 1980s, 34 countries exhibited an average annual warming of 1.5℃ or above (23.288% of the total); 68 countries exhibited an average annual warming of 1.0℃ or above (46.575% of the total); and 128 countries exhibited an average annual warming of 0.5℃ or above (87.671% of the total).
[1]
Almazroui M, Nazrul Islam M, Athar H et al., 2012. Recent climate change in the Arabian Peninsula: Annual rainfall and temperature analysis of Saudi Arabia for 1978-2009. Atmospheric Research, 111(32): 29-45. https://doi.org/10.1016/j.atmosres.2012.02.013.

DOI

[2]
Arora M, Goel N K, Singh P, 2005. Evaluation of temperature trends over India/Evaluation de tendances de température en Inde. Hydrology Sciences Journal, 50(1): 81-93. https://doi.org/10.1623/hysj.50.1.81.56330.

[3]
Burger F, Brock B, Montecinos A, 2018. Seasonal and elevational contrasts in temperature trends in central Chile between 1979 and 2015. Global and Planetary Change, 162: 136-147. https://doi.org/10.1016/j.gloplacha.2018.01.005.

DOI

[4]
Bushuk M, Msadek R, Winton M et al., 2017. Summer enhancement of Arctic Sea ice volume anomalies in the September-ice zone. Journal of Climate, 30: 2341-2362. https://doi.org/10.1175/JCLI-D-16-0470.1.

DOI

[5]
Ceppi P, Scherrer S C, Fischer A M et al., 2012. Revisiting Swiss temperature trends 1959-2008. International Journal of Climatology, 32(2): 203-213. https://doi.org/10.1002/joc.2260.

DOI

[6]
Chu Duo, Yang Yong, Luobu Jianshen et al., 2016. Applicability analysis of MERRA surface air temperature over the Qinghai-Xizang Plateau. Plateau Meteorology, 35(2): 337-350. https://doi.org/10.7522/j.issn.1000-0534.2015.00018. (in Chinese)

[7]
De Luis M, Čufar K, Saz M A et al., 2014. Trends in seasonal precipitation and temperature in Slovenia during 1951-2007. Regional Environmental Change, 14(5): 1801-1810. https://doi.org/10.1007/s10113-012-0365-7.

DOI

[8]
Dee D P, Balmaseda M, Balsamo G et al., 2014. Toward a consistent reanalysis of the climate system. Bulletin of the American Meteorological Society, 95(8): 1235-1248. https://doi.org/10.1175/BAMS-D-13-00043.1.

DOI

[9]
Du Q Q, Zhang M J, Wang S J et al., 2019. Changes in air temperature over China in response to the recent global warming hiatus. Journal of Geographical Sciences, 29(4): 496-516. https://doi.org/10.1007/s11442-019-1612-3.

DOI

[10]
Easterling D R, Wehner M F, 2009. Is the climate warming or cooling? Geophysical Research Letters, 36(8): 262-275. https://doi.org/10.1029/2009GL037810.

[11]
Falvey M, Garreaud R D, 2009. Regional cooling in a warming world: Recent temperature trends in the southeast Pacific and along the west coast of subtropical South America (1979-2006). Journal of Geophysical Research: Atmospheres, 114(114): 217-221. http://dx.doi.org/10.1029/2008JD010519.

[12]
Feng C, Wu B Y, 2015. Enhancement of winter arctic warming by the Siberian High over the past decade. Atmospheric and Oceanic Science Letters, 8(5): 257-263. https://doi.org/10.3878/AOSL20150022.

[13]
Foster G, Rahmstorf S, 2011. Global temperature evolution 1979-2010. Environmental Research Letters, 6(4): 044022. https://doi.org/10.1088/1748-9326/6/4/044022.

DOI

[14]
Fujibe F, 2015. Relationship between interannual variations of extreme hourly precipitation and air/sea-surface temperature in Japan. SOLA, 11: 5-9. https://doi.org/10.2151/sola.2015-002.

DOI

[15]
Garreaud R D, Falvey M, 2010. The coastal winds off western subtropical South America in future climate scenarios. International Journal of Climatology, 29: 543-554. http://dx.doi.org/10.1002/joc.1716.

DOI

[16]
Ge Q S, Wang F, Luterbacher J et al., 2013. Improved estimation of average warming trend of China from 1951-2010 based on satellite observed land-use data. Climatic Change, 121(2): 365-379. https://doi.org/10.1007/s10584-013-0867-4.

DOI

[17]
Gevorgyan A, Melkonyan H, Aleksanyan T et al., 2016. An assessment of observed and projected temperature changes in Armenia. Arabian Journal of Geosciences, 9(1): 27. https://doi.org/10.1007/s12517-015-2167-y.

DOI

[18]
Graversen R G, Wang M, 2009. Polar amplification in a coupled climate model with locked albedo. Climate Dynamics, 33: 629-643. https://doi.org/10.1007/s00382-009-0535-6.

DOI

[19]
Gupta A S, England M H, 2006. Coupled ocean-atmosphere-ice response to variations in the southern annular mode. Journal of Climate, 19(18): 4457-4486. http://dx.doi.org/10.1175/JCLI3843.1.

DOI

[20]
Hansen J, Ruedy R, Sato M et al., 2010. Global surface temperature change. Reviews of Geophysics, 48(4): RG4004. https://doi.org/10.1029/2010RG000345.

[21]
Hersbach H, Bell B, Berrisford P et al., 2020. The ERA5 global reanalysis. Quarterly Journal of the Royal Meteorological Society, 146(730): 1999-2049. https://doi.org/10.1002/qj.3803.

DOI

[22]
Hu Z, Zhang C, Hu Q et al., 2014. Temperature changes in central Asia from 1979 to 2011 based on multiple datasets. Journal of Climate, 27(3): 1143-1167. https://doi.org/10.1175/jcli-d-13-00064.1.

DOI

[23]
Huang J, Li G X, Liu Y et al., 2018. Projections for temperature-related years of life lost from cardiovascular diseases in the elderly in a Chinese city with typical subtropical climate. Environmental Research, 167: 614-621. https://doi.org/10.1016/j.envres.2018.08.024.

DOI PMID

[24]
IPCC AR5 WGI, 2013. Climate Change: The Physical Science Basis. Contribution of Working Group I to the Fifth Assessment Report of the Intergovernmental Panel on Climate Change. Cambridge, United Kingdom and New York: Cambridge University Press.

[25]
IPCC, 2018. Special Report on Global Warming of 1.5°C. UK: Cambridge University Press.

[26]
Jones P D, Lister D H, Osborn T J et al., 2012. Hemispheric and large-scale land-surface air temperature variations: An extensive revision and an update to 2010. Journal of Geophysical Research: Atmospheres, 117(D5). https://doi.org/10.1029/2011jd017139.

[27]
Kalnay E, Kanamitsu M, Kistler R et al., 1996. The NCEP /NCAR 40 year reanalysis project. Bulletin of the American Meteorological Society, 77(3): 437-471. https://doi.org/10.1175/1520-0477(1996)077<0437:TNYRP>2.0.CO;2.

DOI

[28]
Kanamitsu M, Ebisuzaki W, Woollen J et al., 2002. NCEP-DOE AMIP-II Reanalysis (R-2). Bulletin of the American Meteorological Society, 83(11): 1631-1643. https://doi.org/10.1175/bams-83-11-1631.

DOI

[29]
Kim H S, Chung Y S, Tans P P et al., 2015. Climatological variability of air temperature and precipitation observed in South Korea for the last 50 years. Air Quality Atmosphere & Health, 9(6): 645-651. https://doi.org/10.1007/s11869-015-0366-z.

[30]
Kim S J, Choi H S, Kim B M et al., 2013. Analysis of recent climate change over the Arctic using ERA-Interim reanalysis data. Advances in Polar Science, 24: 326-338. https://doi.org/10.3724/SP.J.1085.2013.00326.

DOI

[31]
Kobayashi S, Ota Y, Harada Y et al., 2015. The JRA-55 Reanalysis: General specifications and basic characteristics. Journal of the Meteorological Society of Japan, 93(1): 5-48. https://doi.org/10.2151/jmsj.2015-001.

[32]
Lang A, Yang S, Kaas E, 2017. Sea ice thickness and recent Arctic warming. Geophysical Research Letters, 44(1): 409-418. https://doi.org/10.1002/2016GL071274.

DOI

[33]
Lawrimore J H, Menne M J, Gleason B E et al., 2011. An overview of the Global Historical Climatology Network monthly mean temperature dataset, version 3. Journal of Geophysical Research: Atmospheres, 116: D19121. https://doi.org/10.1029/2011JD016187.

DOI

[34]
Li X G, Hu N, 2015. Practical Meteorological Statistical Method. Beijing: China Meteorological Press.

[35]
Liu Y H, Key J R, 2014. Less winter cloud aids summer 2013 Arctic sea ice return from 2012 minimum. Environmental Research Letters, 9(4): 044002. https://doi.org/10.1088/1748-9326/9/4/044002.

DOI

[36]
Lizana X C, Andrea A, Tolaba A et al., 2017. Field responses of potato to increased temperature during tuber bulking: Projection for climate change scenarios, at high-yield environments of southern Chile. Agricultural and Forest Meteorology, 239: 192-201. https://doi.org/10.1016/j.agrformet.2017.03.012.

DOI

[37]
Morello L, Abbott A, Butler D et al., 2014. 365 days: 2014 in science. Nature, 516(7531): 300-303. https://doi.org/10.1038/516300a.

DOI

[38]
Mudelsee M, 2019. Trend analysis of climate time series: A review of methods. Earth-Science Reviews, 190: 310-322. https://doi.org/10.1016/j.earscirev.2018.12.005.

DOI

[39]
Oguntunde P G, Abiodun B J, Lischeid G, 2012. Spatial and temporal temperature trends in Nigeria, 1901-2000. Meteorology and Atmospherics Physics, 118(1/2): 95-105. https://doi.org/10.1007/s00703-012-0199-3.

[40]
Overland J E, Wang M, 2016. Recent extreme arctic temperatures are due to a split polar vortex. Journal of Climate, 29(15): 5609-5616. https://doi.org/10.1175/JCLI-D-16-0320.1.

DOI

[41]
Parker W S, 2016. Reanalyses and observations: What’s the difference? Bulletin of the American Meteorological Society, 97(9): 1565-1572. https://doi.org/10.1175/BAMS-D-14-00226.1.

DOI

[42]
Pontes-da-Silva E, Magnusson W E, Sinervo B et al., 2018. Extinction risks forced by climatic change and intraspecific variation in the thermal physiology of a tropical lizard. Journal of Thermal Biology, 73: 50-60. https://doi.org/10.1016/j.jtherbio.2018.01.013.

DOI PMID

[43]
Rossati A, 2017. Global warming and its health impact. International Journal of Occupational and Environmental Medicine, 8(1): 7-20. https://doi.org/10.15171/ijoem.2017.963.

[44]
Saha S, Moorthi S, Pan H L et al., 2010. The NCEP climate forecast system reanalysis. Bulletin of the American Meteorological Society, 91(8): 1015-1057. https://doi.org/10.1175/2010BAMS3001.1.

DOI

[45]
Schneider W, Donoso D, Garcés-Vargas J et al., 2017. Water-column cooling and sea surface salinity increase in the upwelling region off central-south Chile driven by a poleward displacement of the South Pacific High. Progress in Oceanography, 151: 38-48. http://dx.doi.org/10.1016/j.pocean.2016.11.004.

DOI

[46]
Screen J A, 2014. Arctic amplification decreases temperature variance in northern mid- to high-latitudes. Nature Climate Change, 4(7): 577-582. https://doi.org/10.1038/nclimate2268.

DOI

[47]
Screen J A, Deser C, Simmonds I, 2014. Local and remote controls on observed Arctic warming. Geophysical Research Letters, 39(10): L10709. https://doi.org/10.1029/2012GL051598.

[48]
Sequeira T N, Santos M S, Magalhães M, 2018. Climate change and economic growth: A heterogeneous panel data approach. Environmental Science and Pollution Research, 25(23): 22725-22735. https://doi.org/10.1007/s11356-018-2305-7.

DOI

[49]
Serreze M C, Barry R G, 2011. Processes and impacts of Arctic amplification: A research synthesis. Global and Planetary Change, 77: 85-96. https://doi.org/10.1016/j.gloplacha.2011.03.004.

DOI

[50]
Sun X B, 2018. Global land surface air temperature changes over the last century based on the new CMA-LAST v1.0 dataset[D]. Nanjing: Nanjing University of Information Science & Technology. (in Chinese)

[51]
Thoeun H C, 2015. Observed and projected changes in temperature and rainfall in Cambodia. Weather and Climate Extremes, 7: 61-71. https://doi.org/10.1016/j.wace.2015.02.001.

DOI

[52]
Thorne P W, Vose R S, 2010. Reanalyses suitable for characterizing long-term trends: Are they really achievable? Bulletin of the American Meteorological Society, 91(3): 353-361. https://doi.org/10.1175/2009BAMS2858.1.

DOI

[53]
Tokinaga H, Xie S, Mukougawa H, 2016. Early 20th-century Arctic warming intensified by Pacific and Atlantic multidecadal variability. Proceedings of the National Academy of Sciences of the United States of America, 114(24): 6227-6232. https://doi.org/10.1073/pnas.1615880114.

[54]
Vincent L A, Van Wijngaarden W A, Hopkinson R, 2007. Surface temperature and humidity trends in Canada for 1953-2005. Journal of Climate, 20(20): 5100-5113. https://doi.org/10.1175/JCLI4293.1.

DOI

[55]
Vuille M, Franquist E, Garreaud R et al., 2015. Impact of the global warming hiatus on Andean temperature. Journal of Geophysical Research: Atmospheres, 120(9): 3745-3757. http://dx.doi.org/10.1002/2015JD023126.

DOI

[56]
Wang J F, Xu C D, Hu M G et al., 2017. Global land surface air temperature dynamics since 1880. International Journal of Climatology, 38: E466-E474. https://doi.org/10.1002/joc.5384.

DOI

[57]
Wu F M, Li W K, Li W, 2019. Causes of Arctic amplification: Review. Advances in Earth Science, 34(3): 232-242. https://doi.org/10.11867/j.issn.1001-8166.2019.03.0232. (in Chinese)

[58]
Xu W H, Li Q X, Jones P et al., 2018. A new integrated and homogenized global monthly land surface air temperature dataset for the period since 1900. Climate Dynamics, 50(7): 2513-2536. https://doi.org/10.1007/s00382-017-3755-1.

DOI

[59]
Zhao L Y, Ding R, Moore J C, 2016. The High Mountain Asia glacier contribution to sea-level rise from 2000 to 2050. Annals of Glaciology, 57(71): 223-231. https://doi.org/10.3189/2016AoG71A049.

DOI

Outlines

/