×
模态框(Modal)标题
在这里添加一些文本
关闭
关闭
提交更改
取消
确定并提交
×
模态框(Modal)标题
×
期刊
文章
图表
检索
EN
中文
首页
关于期刊
期刊介绍
数据库收录
期刊荣誉
编委会
投稿指南
在线期刊
当期目录
优先出版
过刊浏览
推荐文章
专题
按栏目浏览
阅读排行
下载排行
引用排行
E-mail Alert
RSS
期刊订阅
广告合作
联系我们
EN
中文
图/表 详细信息
Structured representation and compression method of viewshed: An example analysis of communication viewshed
WANG Yiwen, ZHU Jun, DOU Wanfeng
地理学报(英文版), 2026, 36(
5
): 1299-1320. DOI:
10.1007/s11442-026-2493-x
Base station
coordinates
Coverage rate
Coverage density
Coverage strength
Degree of matching
(172, 235)
0.762
0.457
0.94
0.974
(186, 238)
0.769
0.441
0.962
0.981
(311, 220)
0.634
0.438
0.991
0.899
(331, 225)
0.665
0.433
0.986
0.916
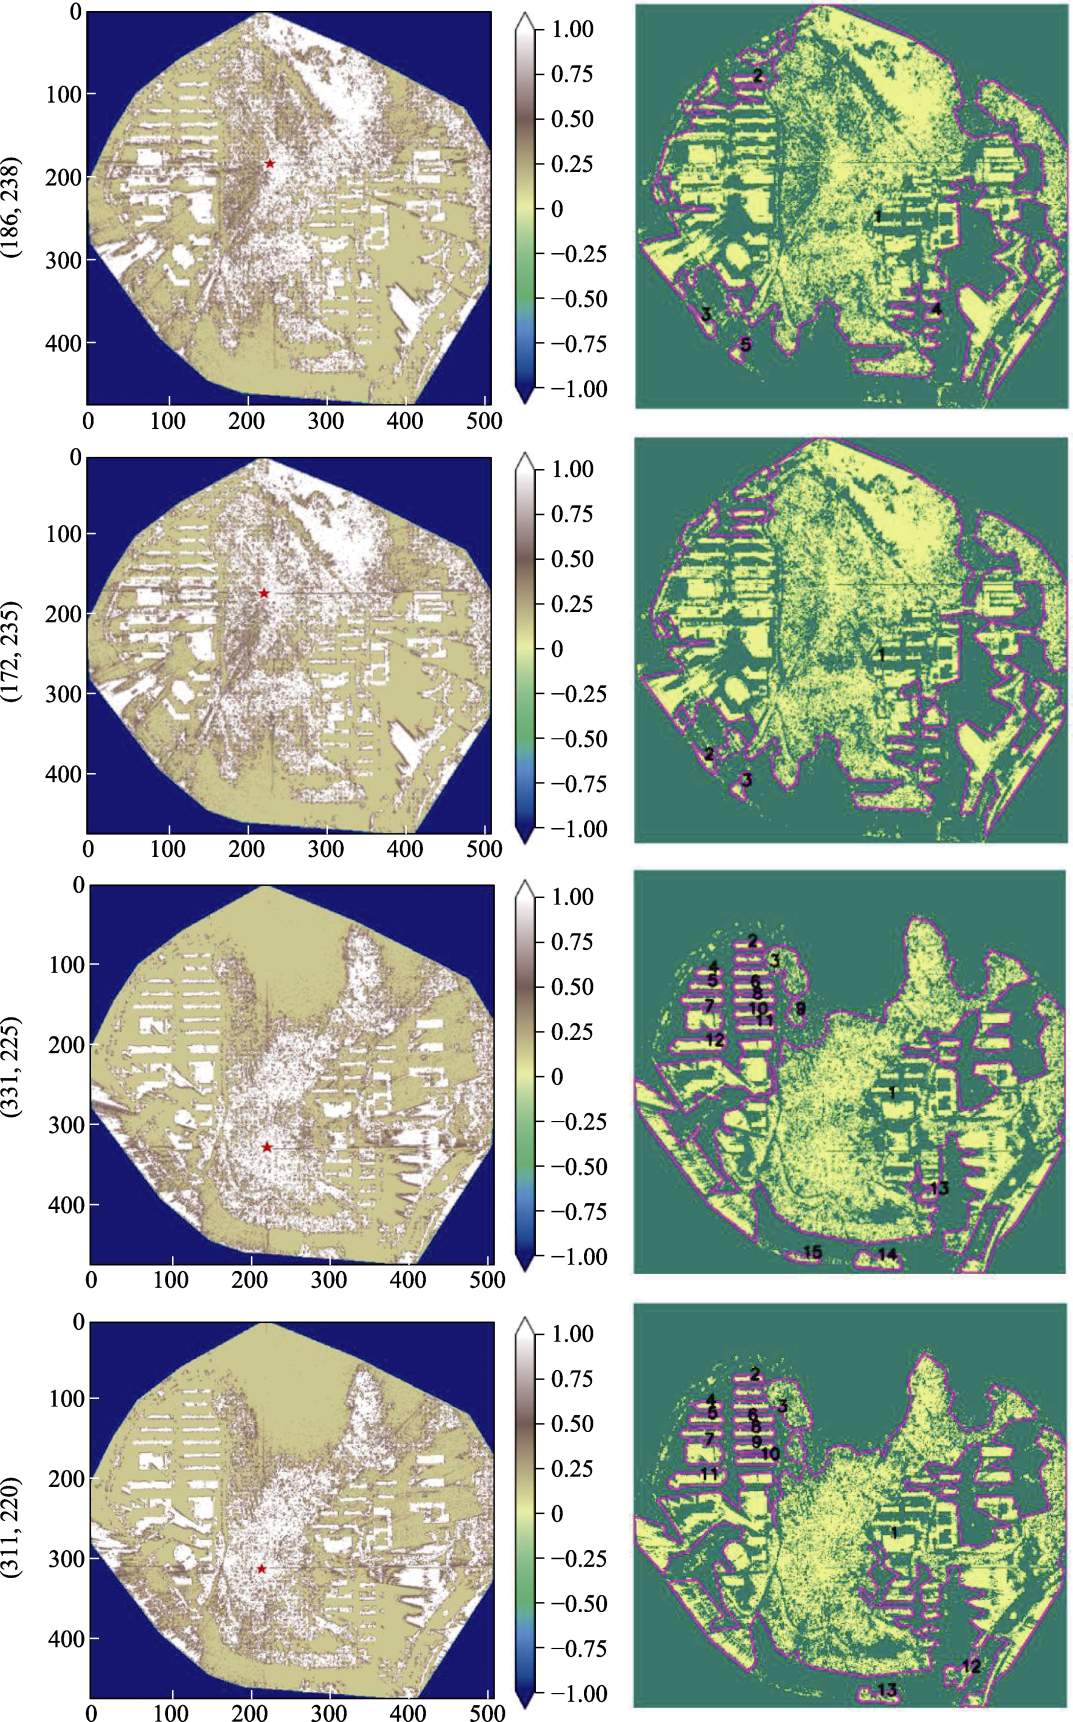
Table 1
Index values and matching degree values of the top four base stations in terms of matching scores
本文的其它图/表
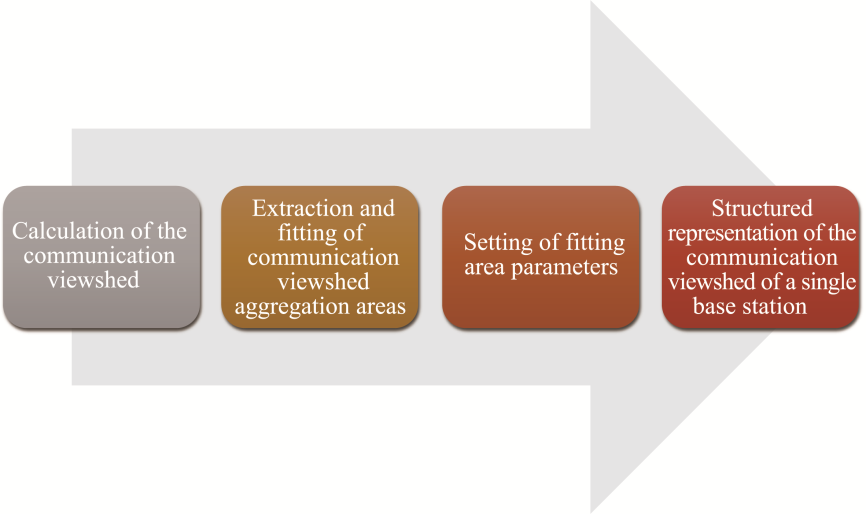
Figure 1
Overall framework of the communication viewshed structured representation method
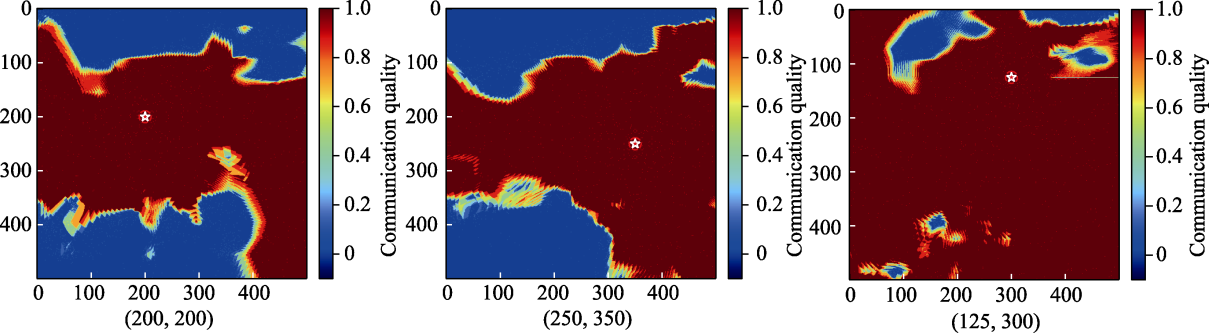
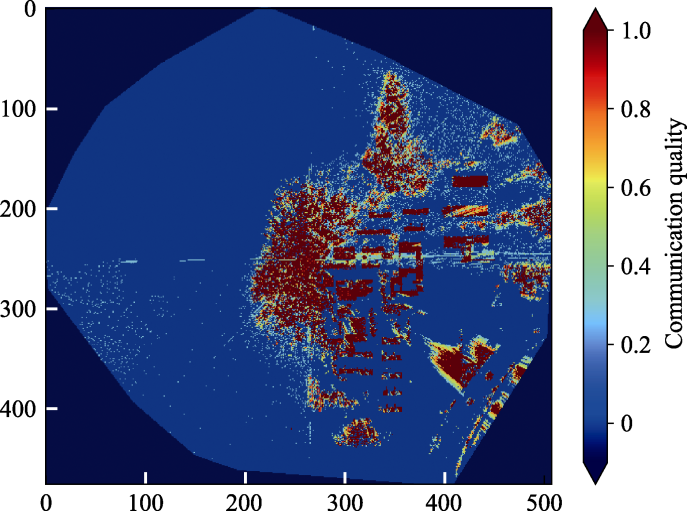
Figure 2
Schematic diagrams of the terrain and communication viewshed for the base station at three different terrain points (the red part of each figure indicates that the communication quality is close to 1 and is good, whereas the blue part indicates that the communication quality is close to 0 and is poor.)
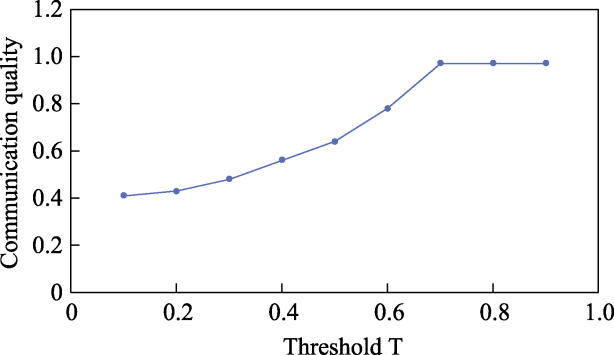
Figure 3
Sensitivity of regional communication quality to the binarization threshold T
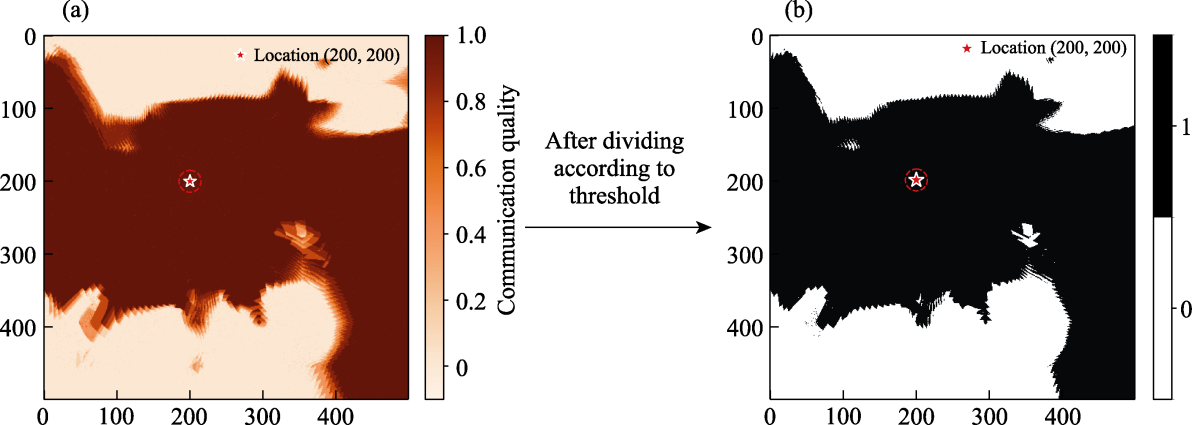
Figure 4
Comparison of the communication viewshed before and after threshold division (the black area in (b) indicates good communication quality, whereas the white area indicates poor communication quality.)
Figure 5
Schematic diagram of gaps in the communication viewshed (the fuzzy boundaries of the spatially aggregated regions in this communication viewshed lead to a reduction in the accuracy of feature extraction.)
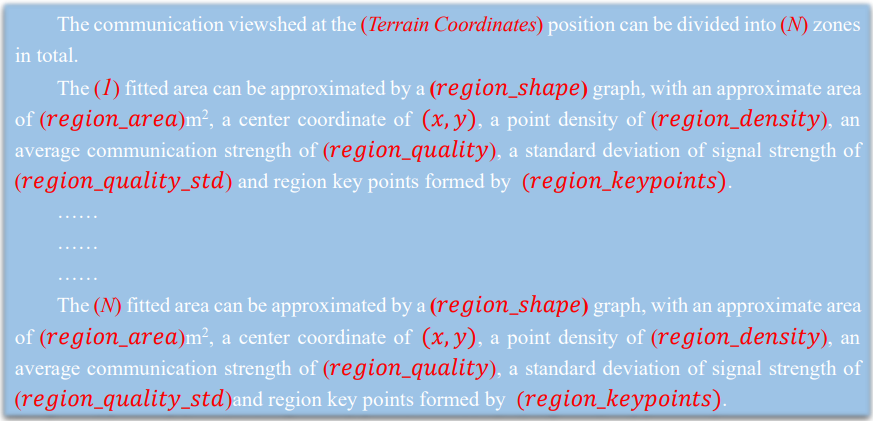
Figure 6
Structured representation template of the communication viewshed of a single base station
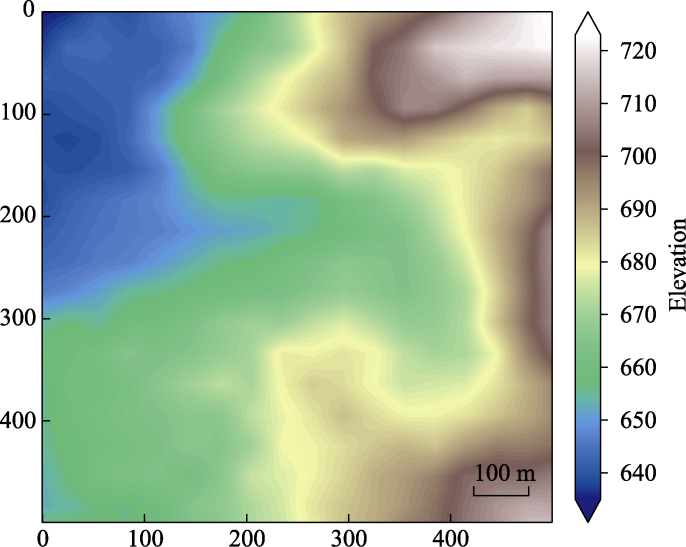
Figure 7
Terrain diagram for the experiment
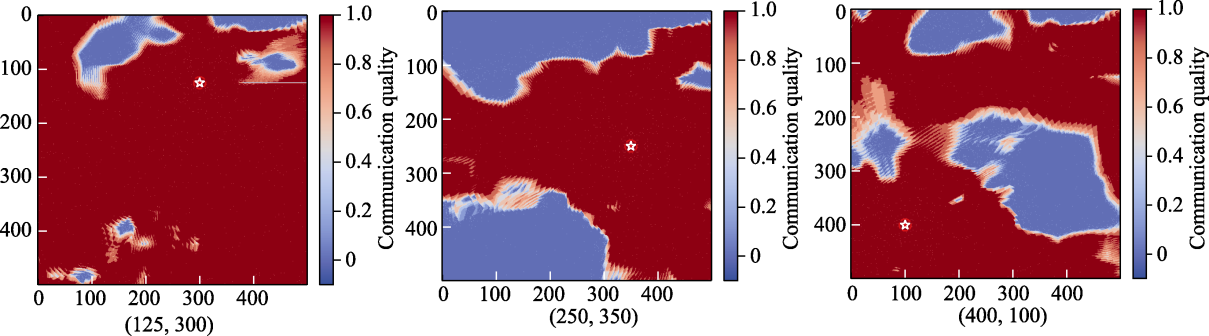
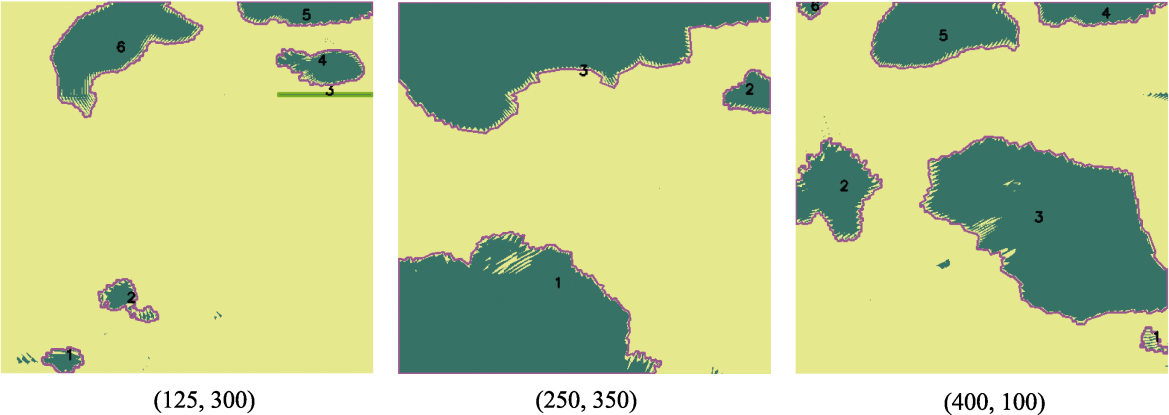
Figure 8
Schematic diagrams of the communication viewsheds of base stations at three terrain points
Figure 9
Schematic diagrams of the regional division of the communication viewsheds of three base stations during feature extraction
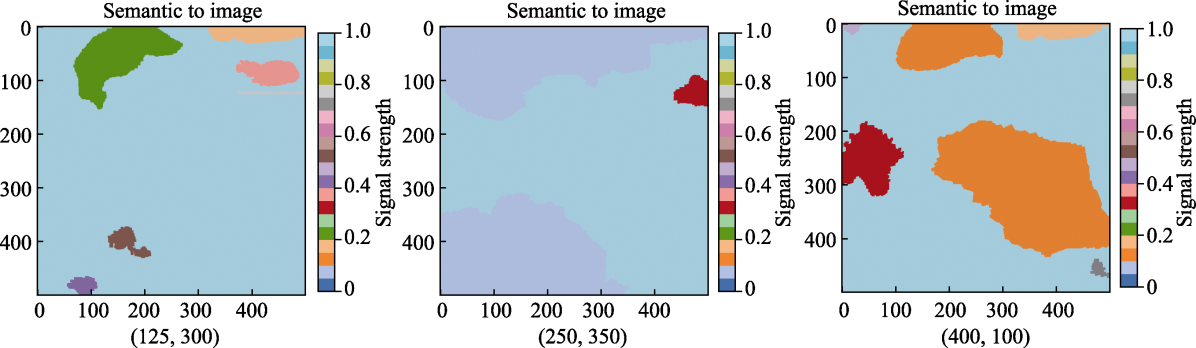
Figure 10
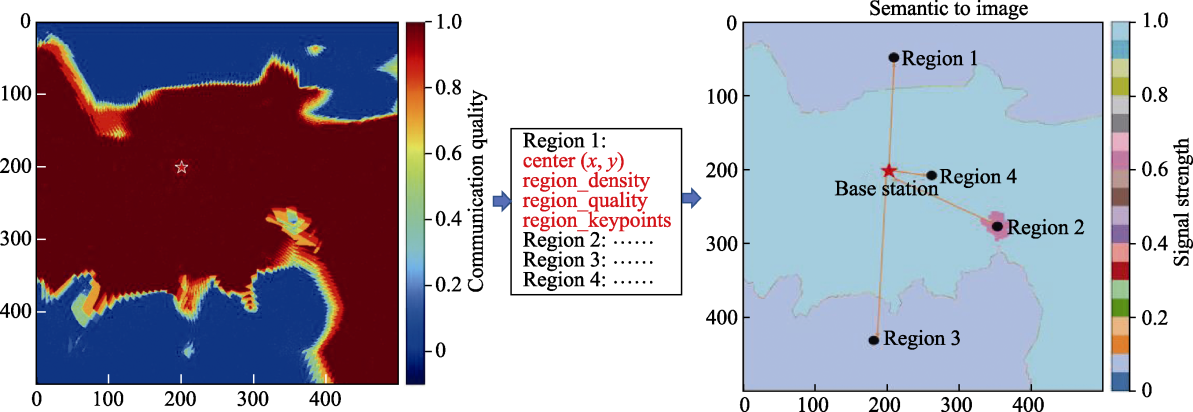
Results of analyzing the structured representations of the communication viewsheds of the three base stations and translating the analytic content into graphs
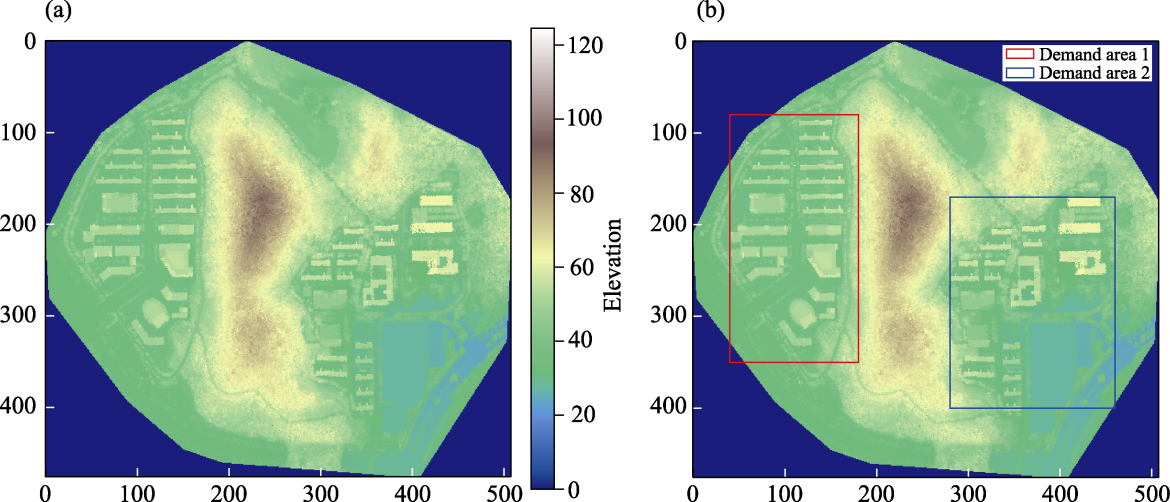
Figure 11
Topographic map of the North District of Nanjing Normal University (a) and signal coverage demand area (b)
Figure 12
Schematic diagrams of the communication viewsheds of the top four base stations in terms of the matching score ranking and the regional division results obtained via feature extraction (the color bar in the figure represents the communication quality.)
Table 2
Computation times of two algorithms for solving a single-base-station location problem
Figure 13
Comparison of the spatial distribution of the communication viewshed as reflected by the parameters in the structured representation
Table 3
Parameters of each area covered by the base station at (200, 200)
Table 4
Error of contour fitting for each region when a structured representation is used
Table 5
Average relative error of the communication quality values for each region when structured expressed
Table 6
Comparison of space occupied when communication viewshed data on terrains of different sizes are stored in various forms
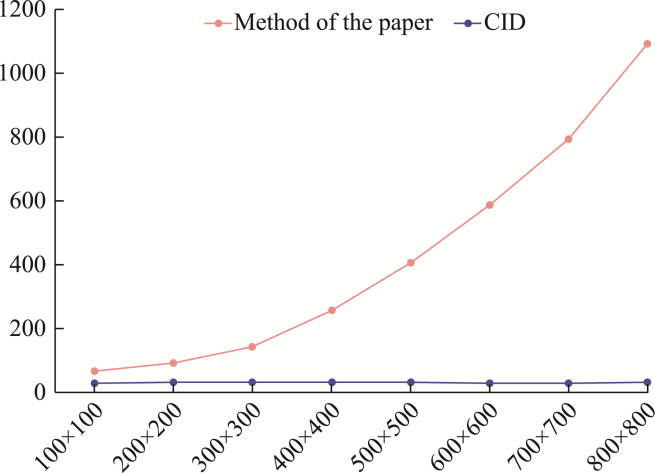
Figure 14
Compression ratios of the two different compression methods for terrains of different sizes
Table 7
Compression ratios for each method on a 500×500 terrain