×
模态框(Modal)标题
在这里添加一些文本
关闭
关闭
提交更改
取消
确定并提交
×
模态框(Modal)标题
×
期刊
文章
图表
检索
EN
中文
首页
关于期刊
期刊介绍
数据库收录
期刊荣誉
编委会
投稿指南
在线期刊
当期目录
优先出版
过刊浏览
推荐文章
专题
按栏目浏览
阅读排行
下载排行
引用排行
E-mail Alert
RSS
期刊订阅
广告合作
联系我们
EN
中文
图/表 详细信息
Comparative analysis of different machine learning algorithms for urban footprint extraction in diverse urban contexts using high-resolution remote sensing imagery
GUI Baoling, Anshuman BHARDWAJ, Lydia SAM
地理学报(英文版), 2025, 35(
3
): 664-696. DOI:
10.1007/s11442-025-2339-y
Image ID
SAM
Image ID
SAM
1
0.83
9
0.97
2
0.76
10
0.98
3
0.91
11
0.93
4
0.83
12
0.94
5
0.78
13
0.91
6
0.89
14
0.94
7
0.75
15
0.98
8
0.94
16
0.95
Table 2
Summary of Kappa precision values for UF extraction based on SAM
本文的其它图/表
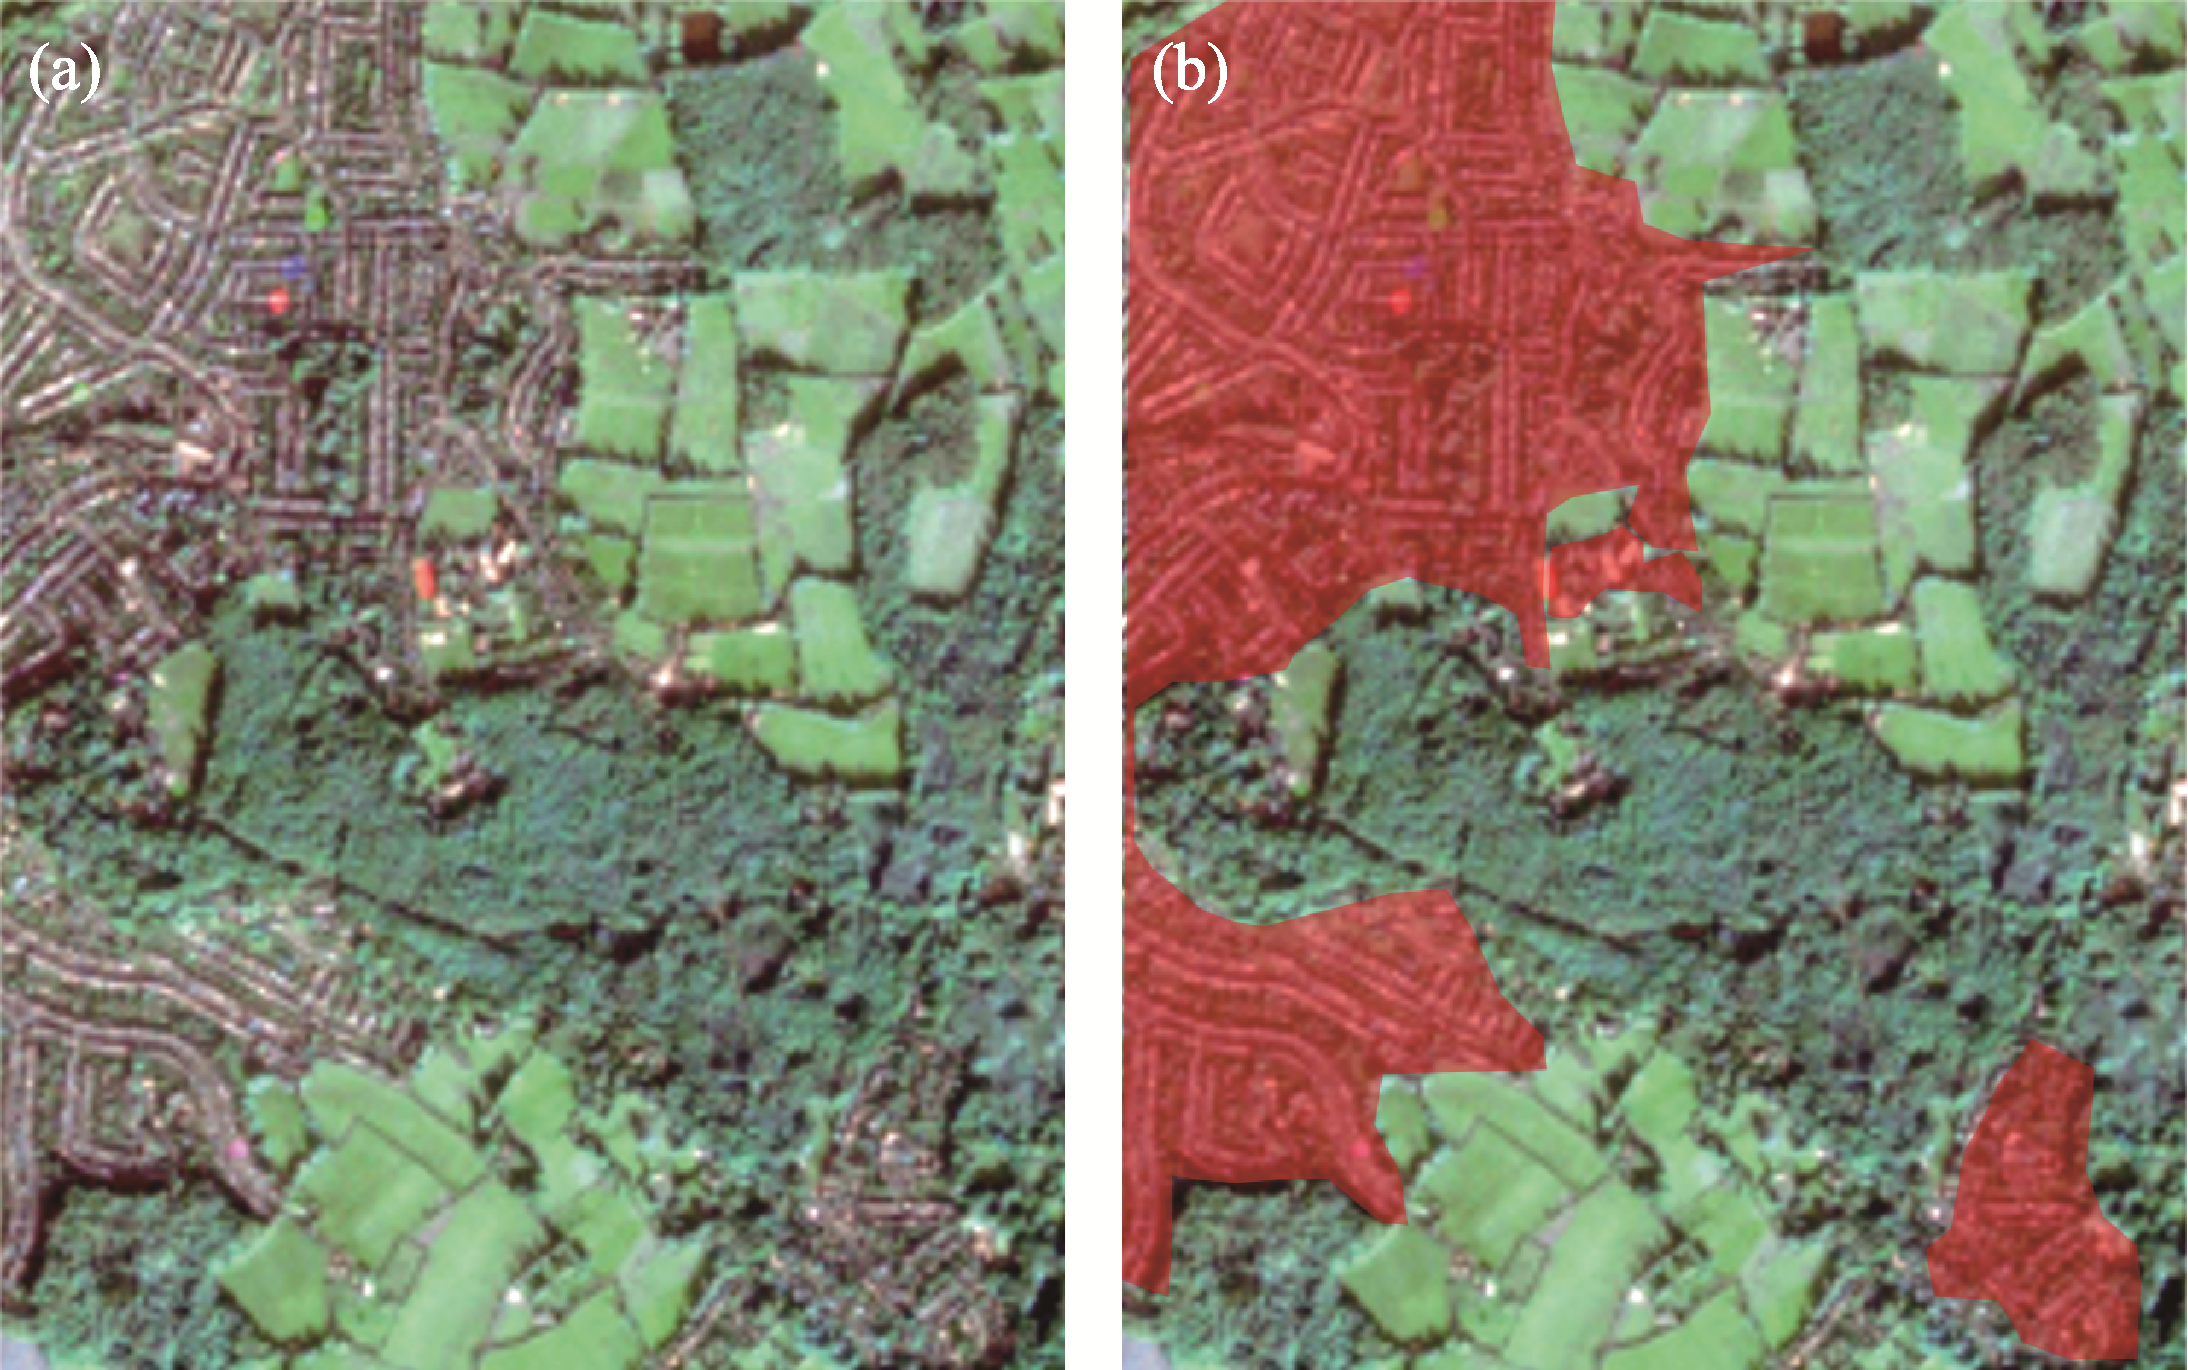
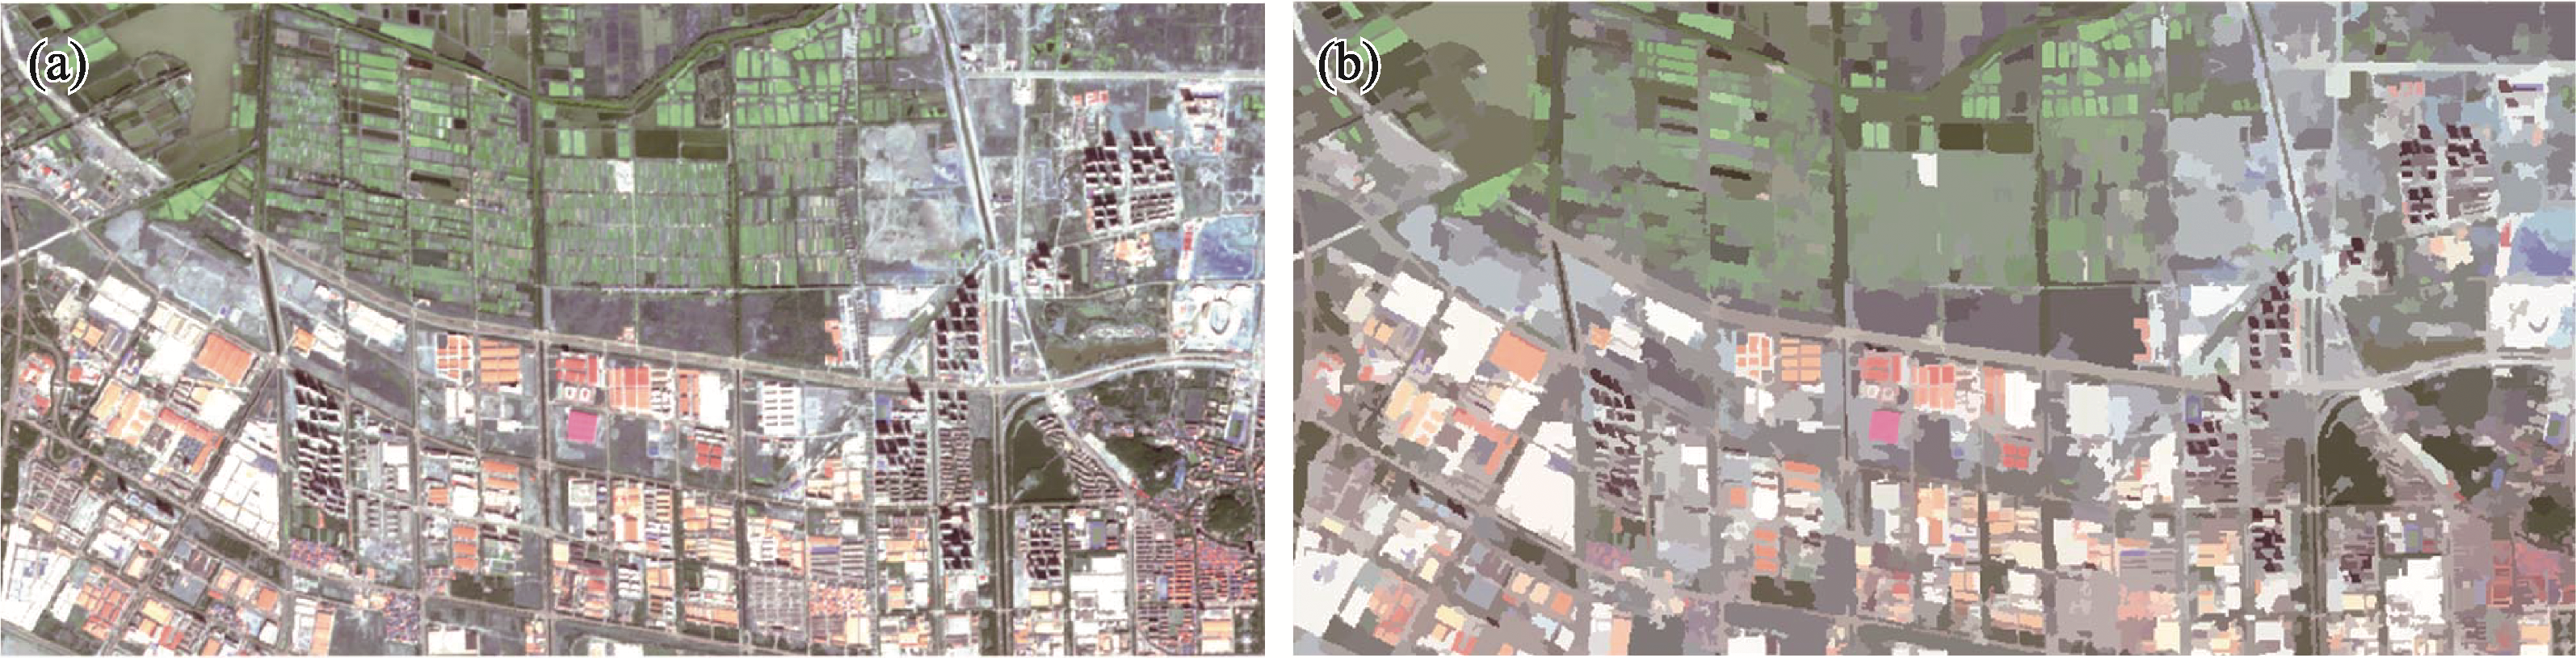
Figure 1
Schematic representation of UF coverage (a. original image; b. UF coverage)
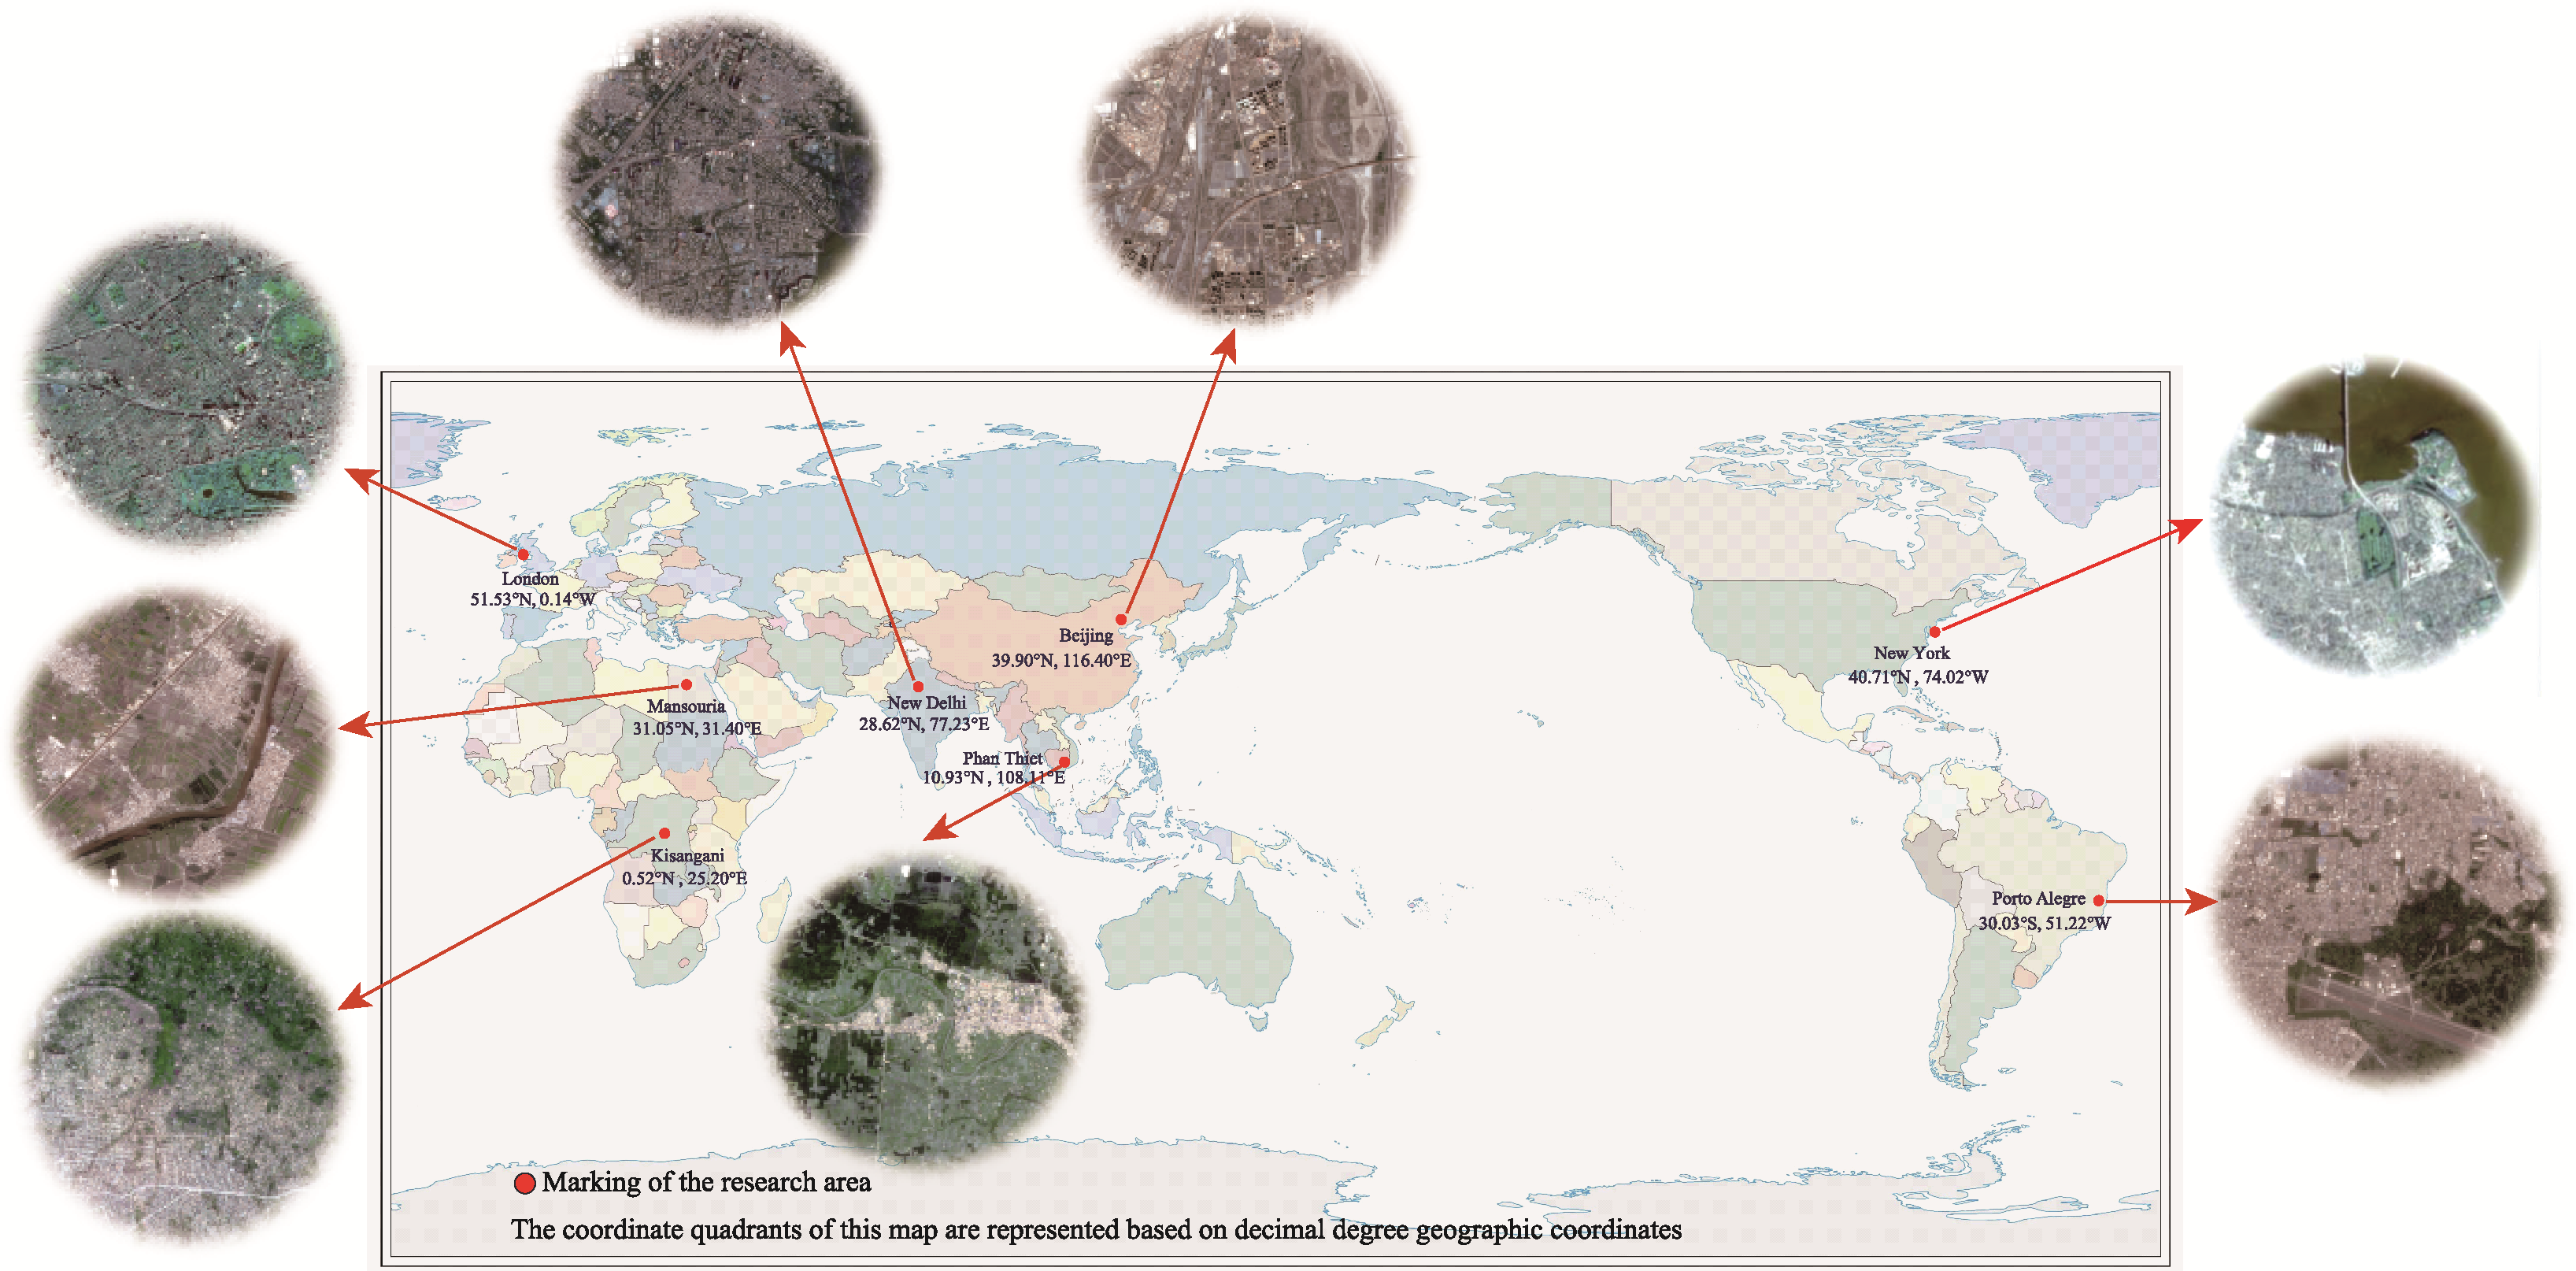
Figure 2
Map of the study area (eight cities across the world)
Table 1
Detailed description of the characteristics of different cities
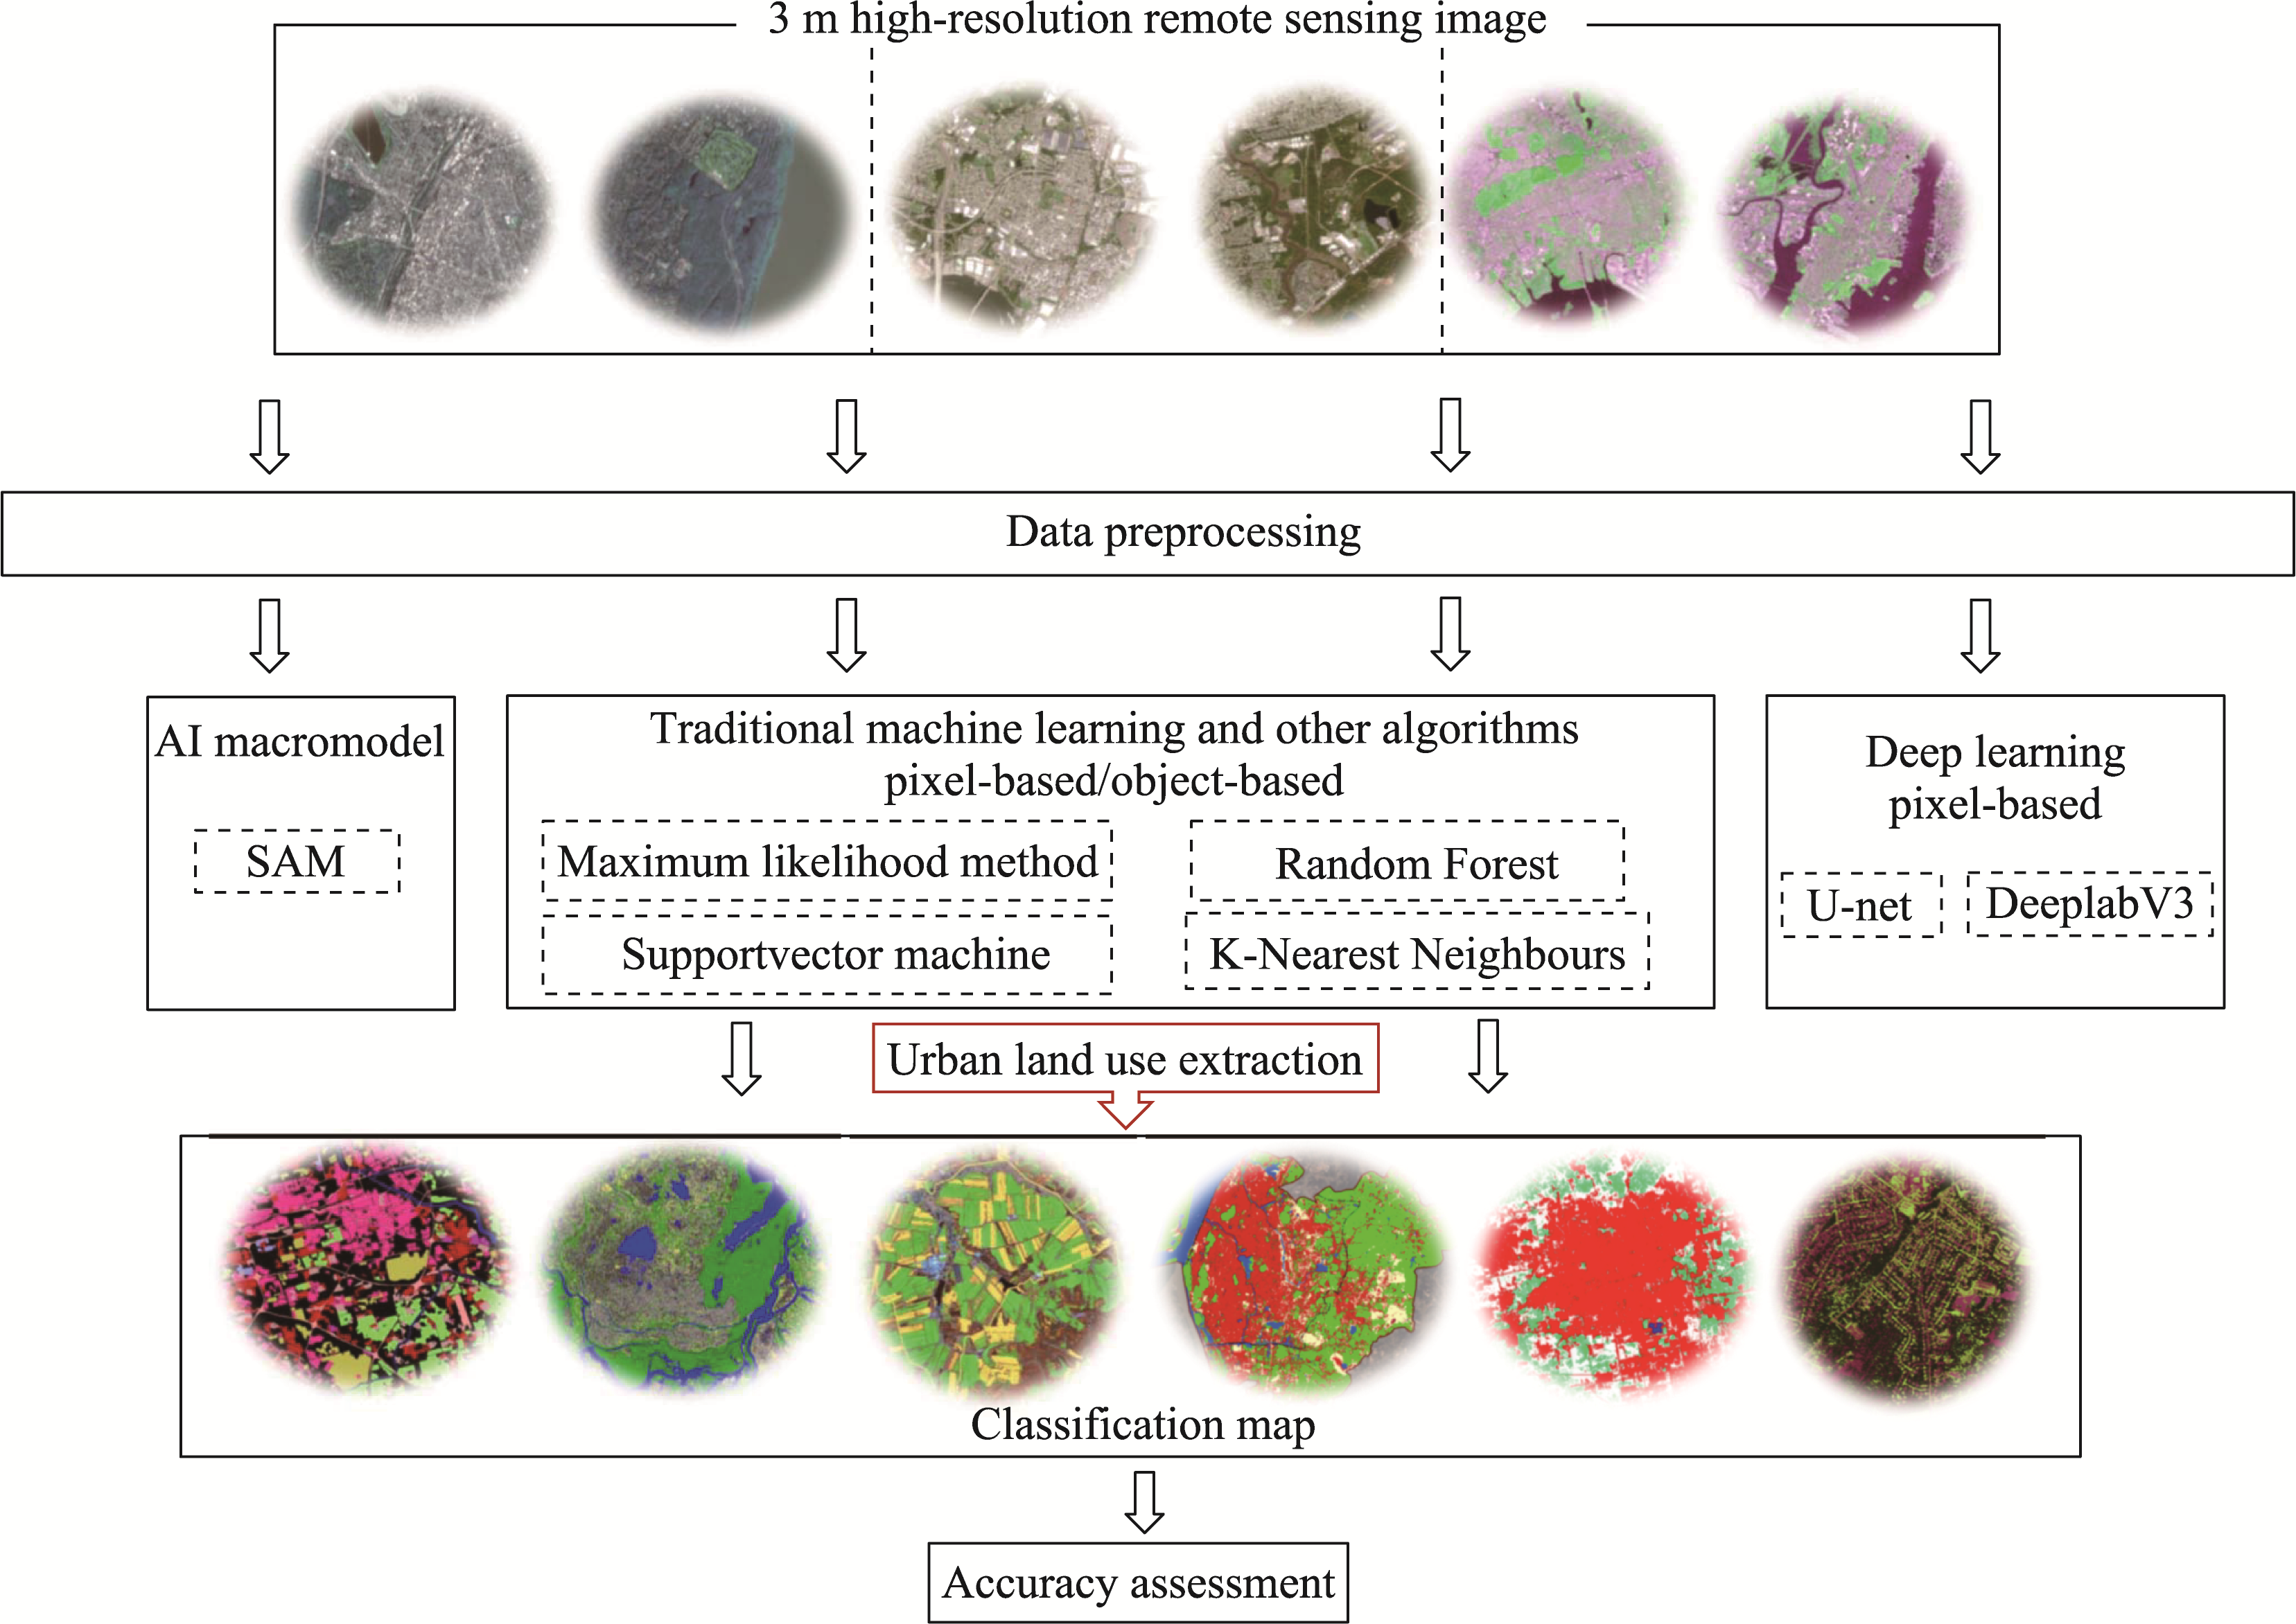
Figure 3
Flowchart of the operation of this experiment
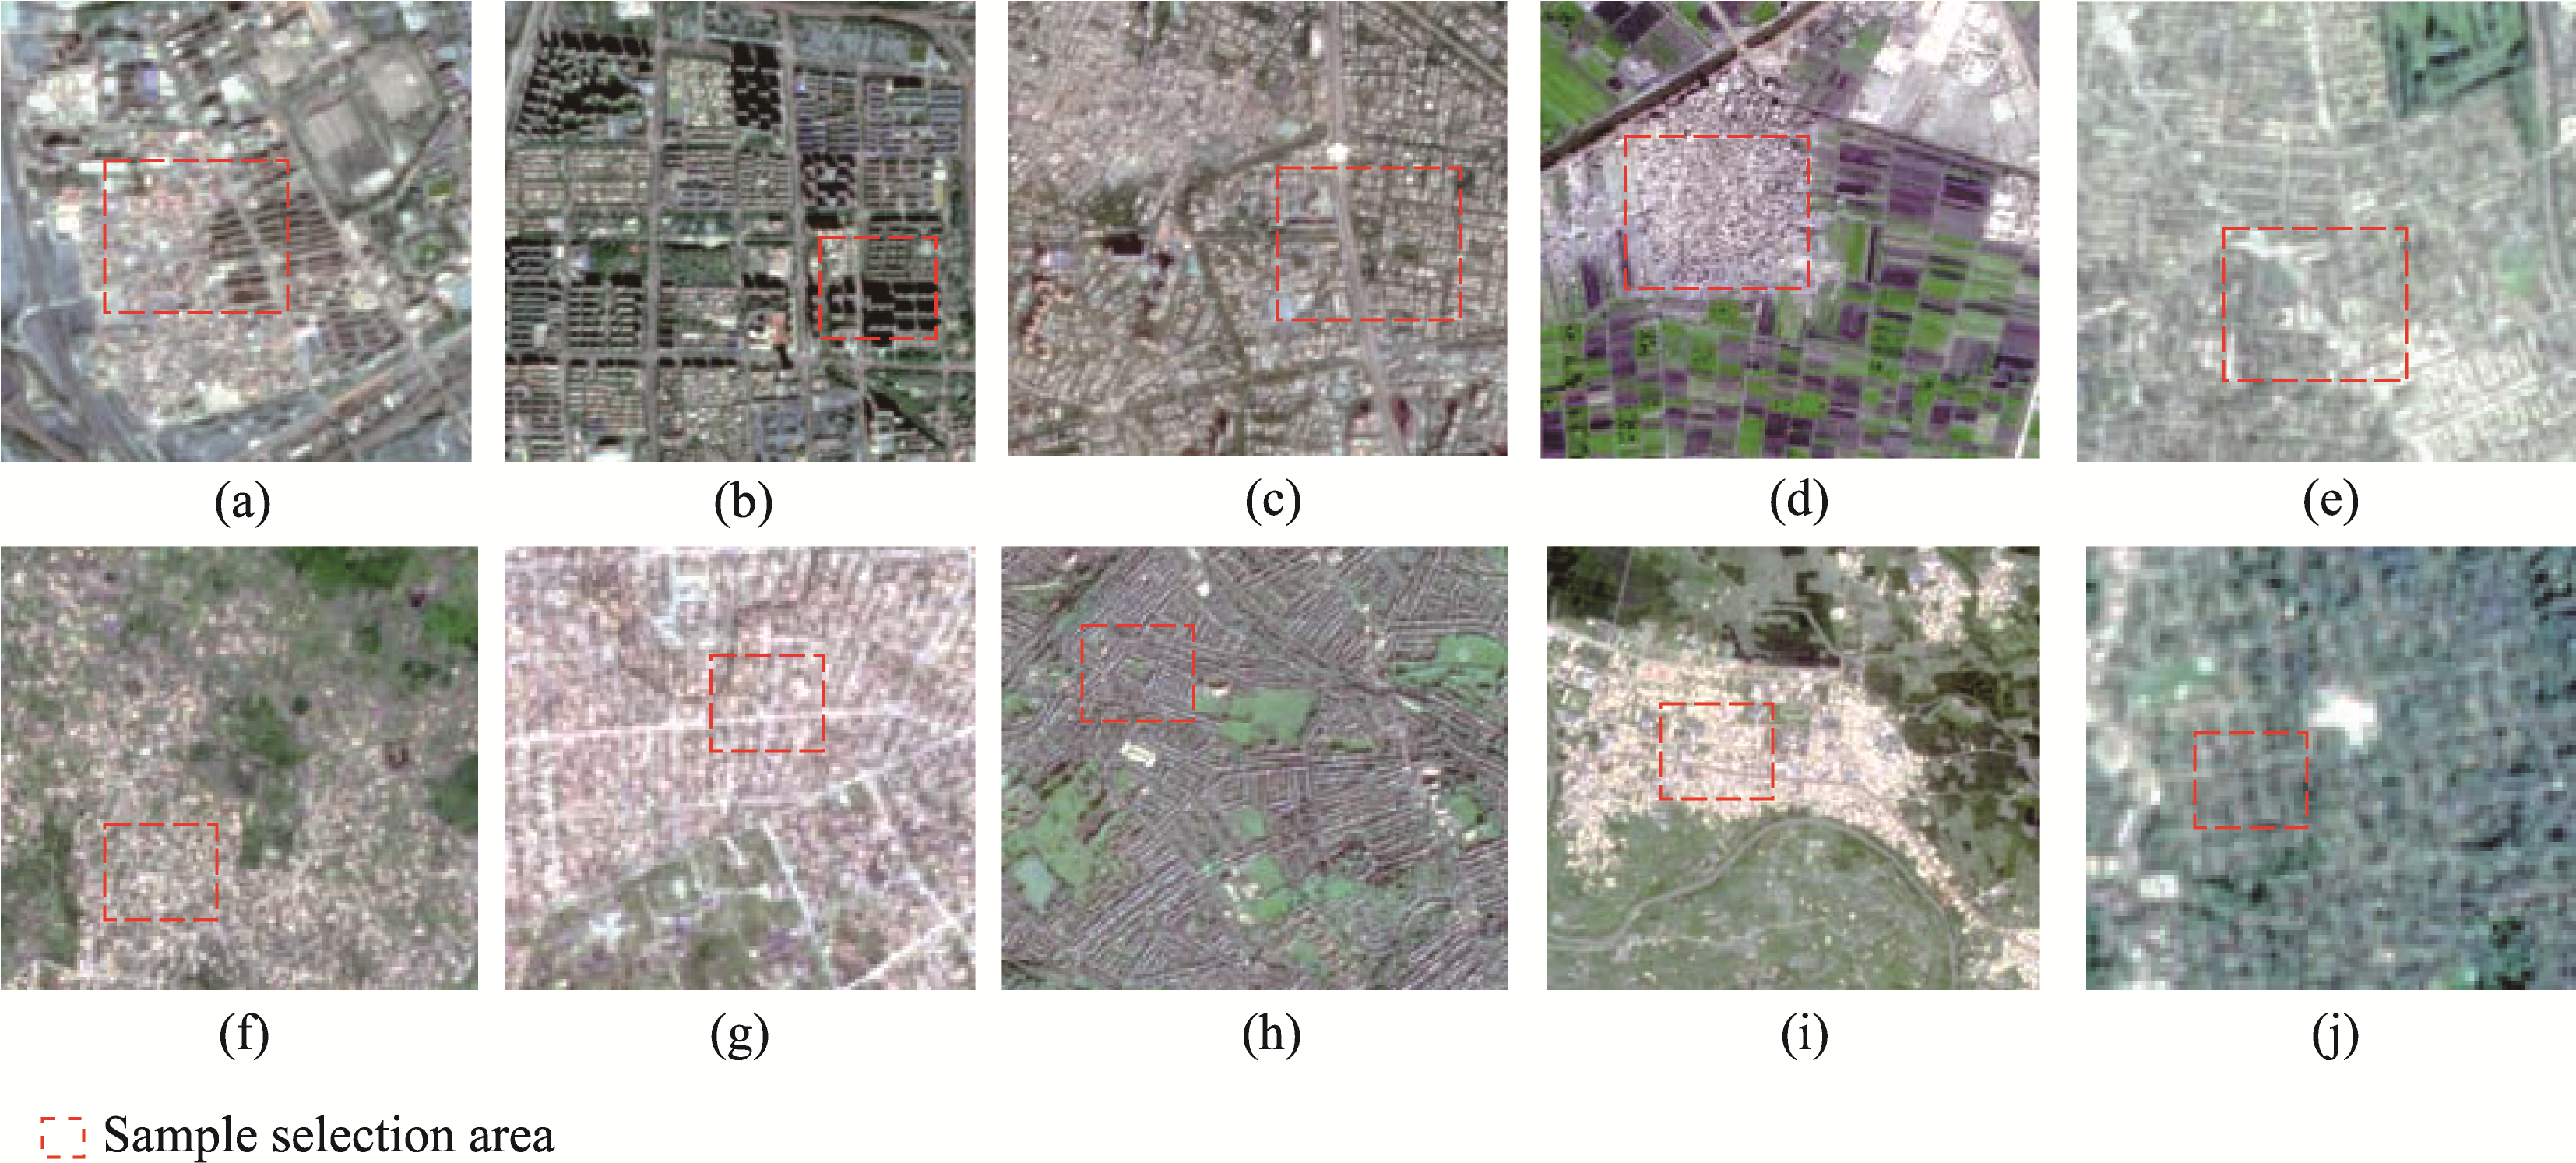
Figure 4
Illustration of an example of sample selection for UF extraction (a-j represent the layout of different cities and the selection of samples. a and b correspond to Beijing, c to New Delhi, d to Mansouria, e to Porto Alegre, f and g to Kisangani, h and i to London, and j to New York.)
Figure 5
Segmentation results based on the Mean Shift algorithm (a. original image; b. segmentation result)
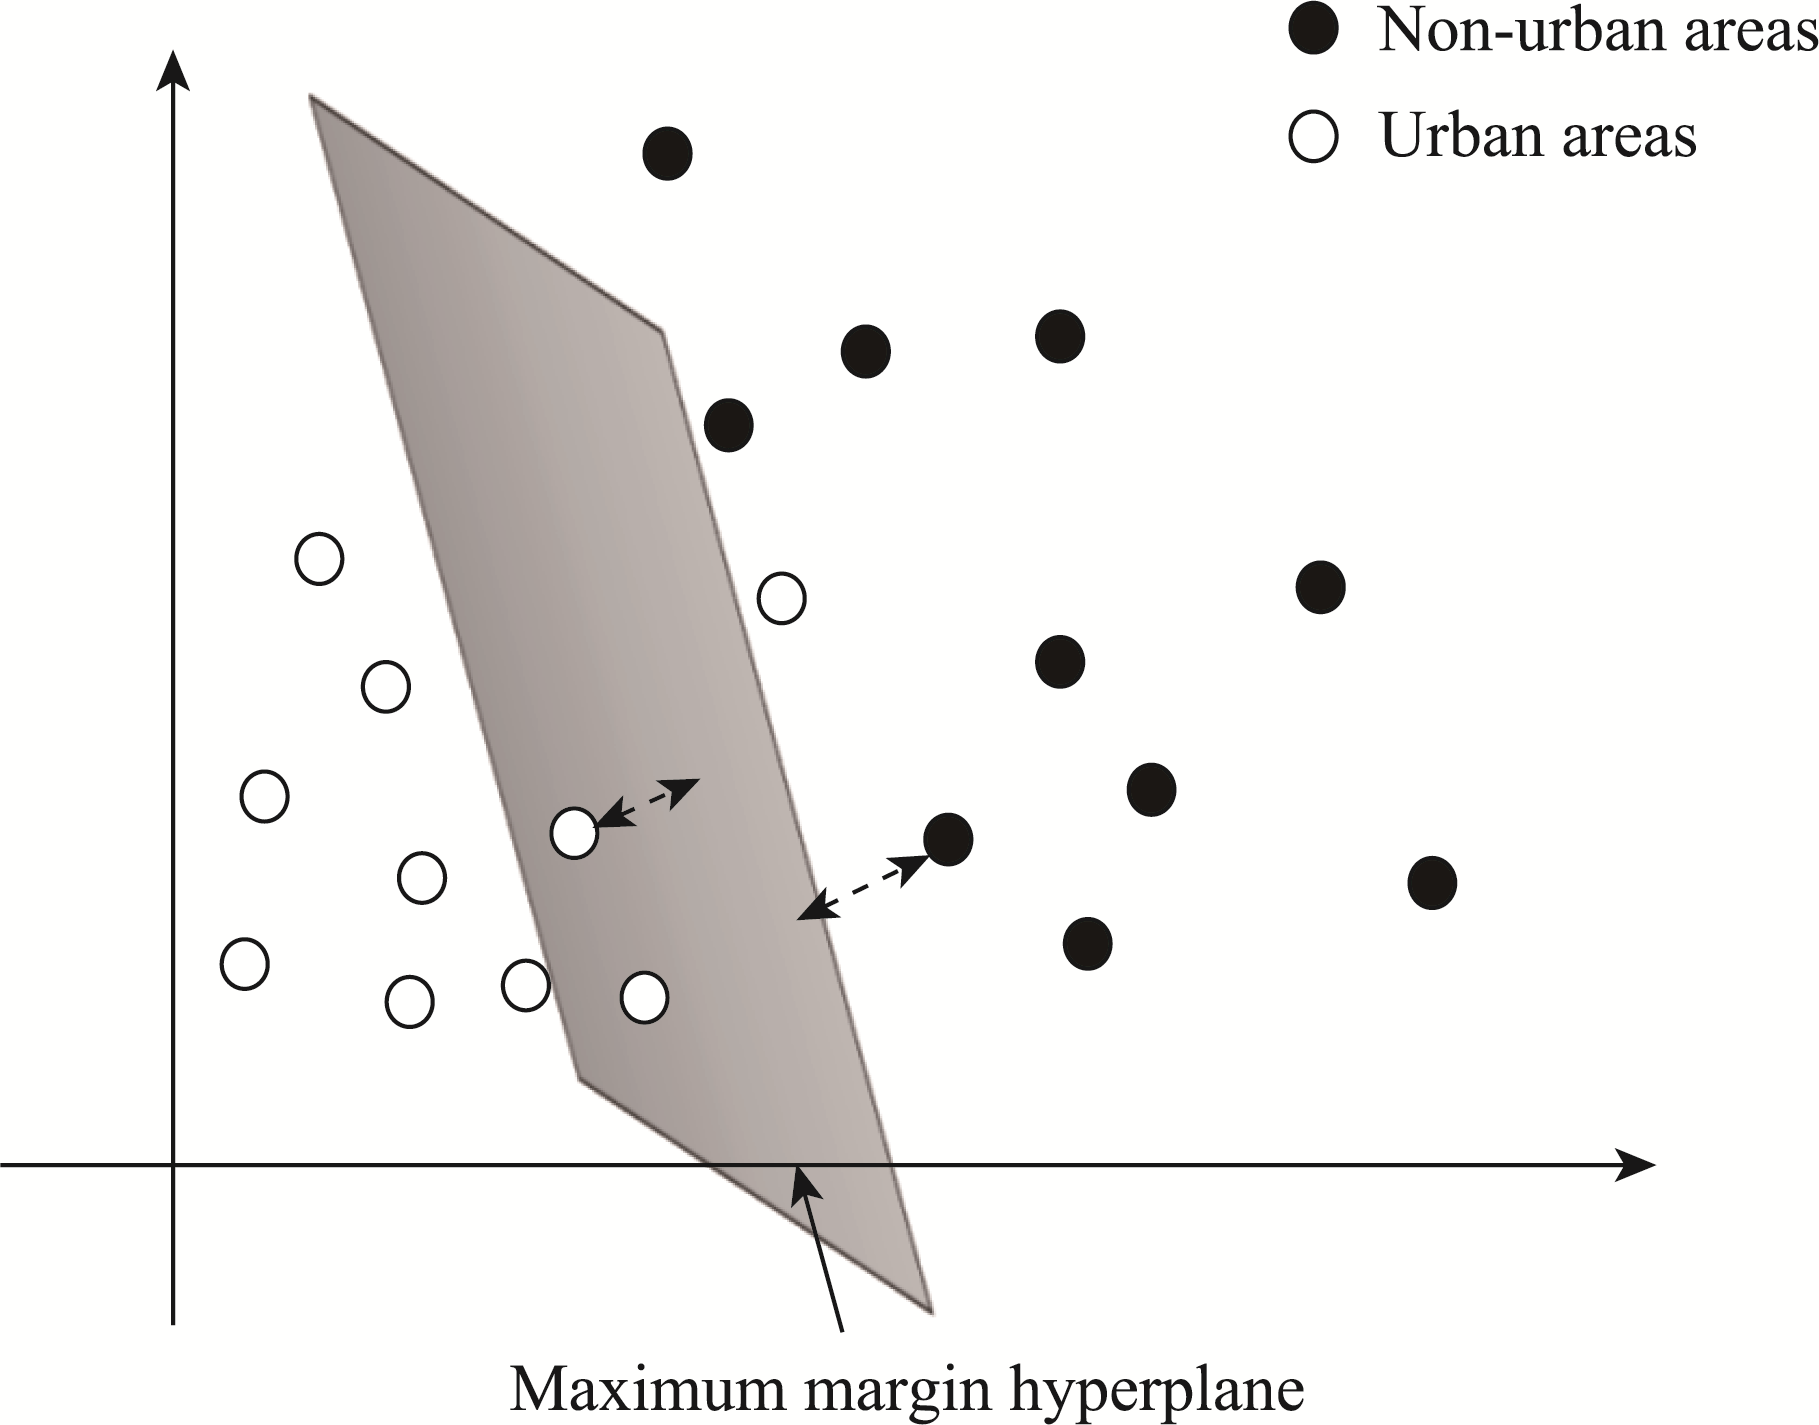
Figure 6
Schematic diagram of the classification principle of SVM
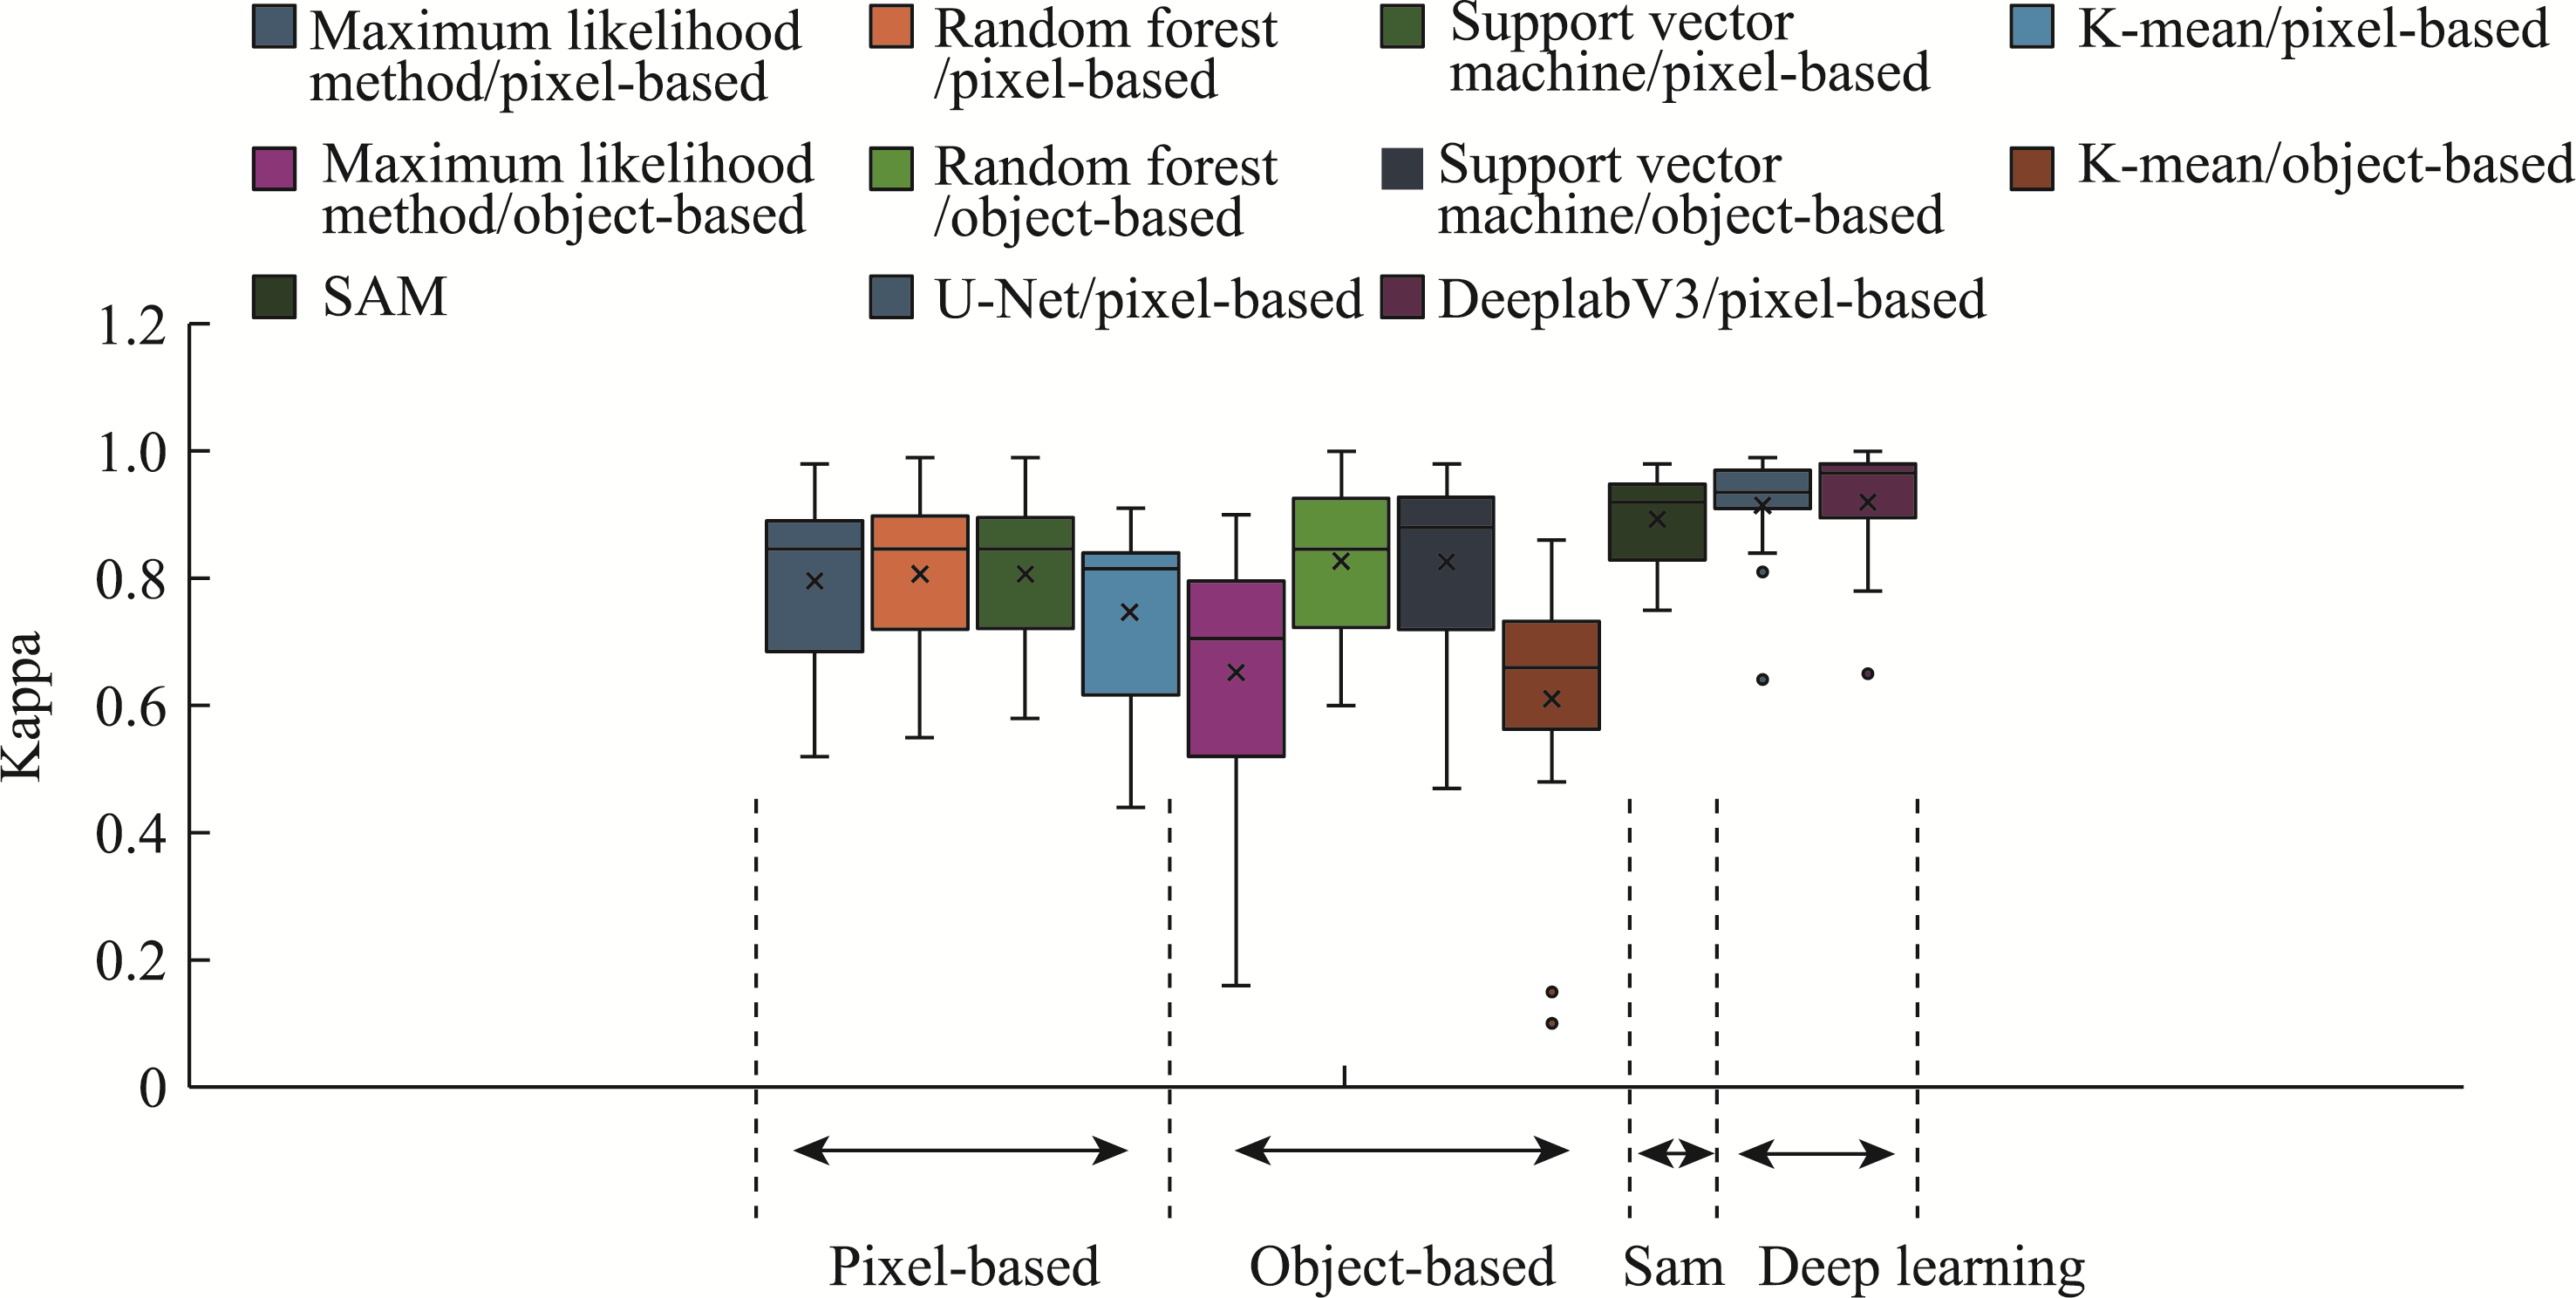
Figure 7
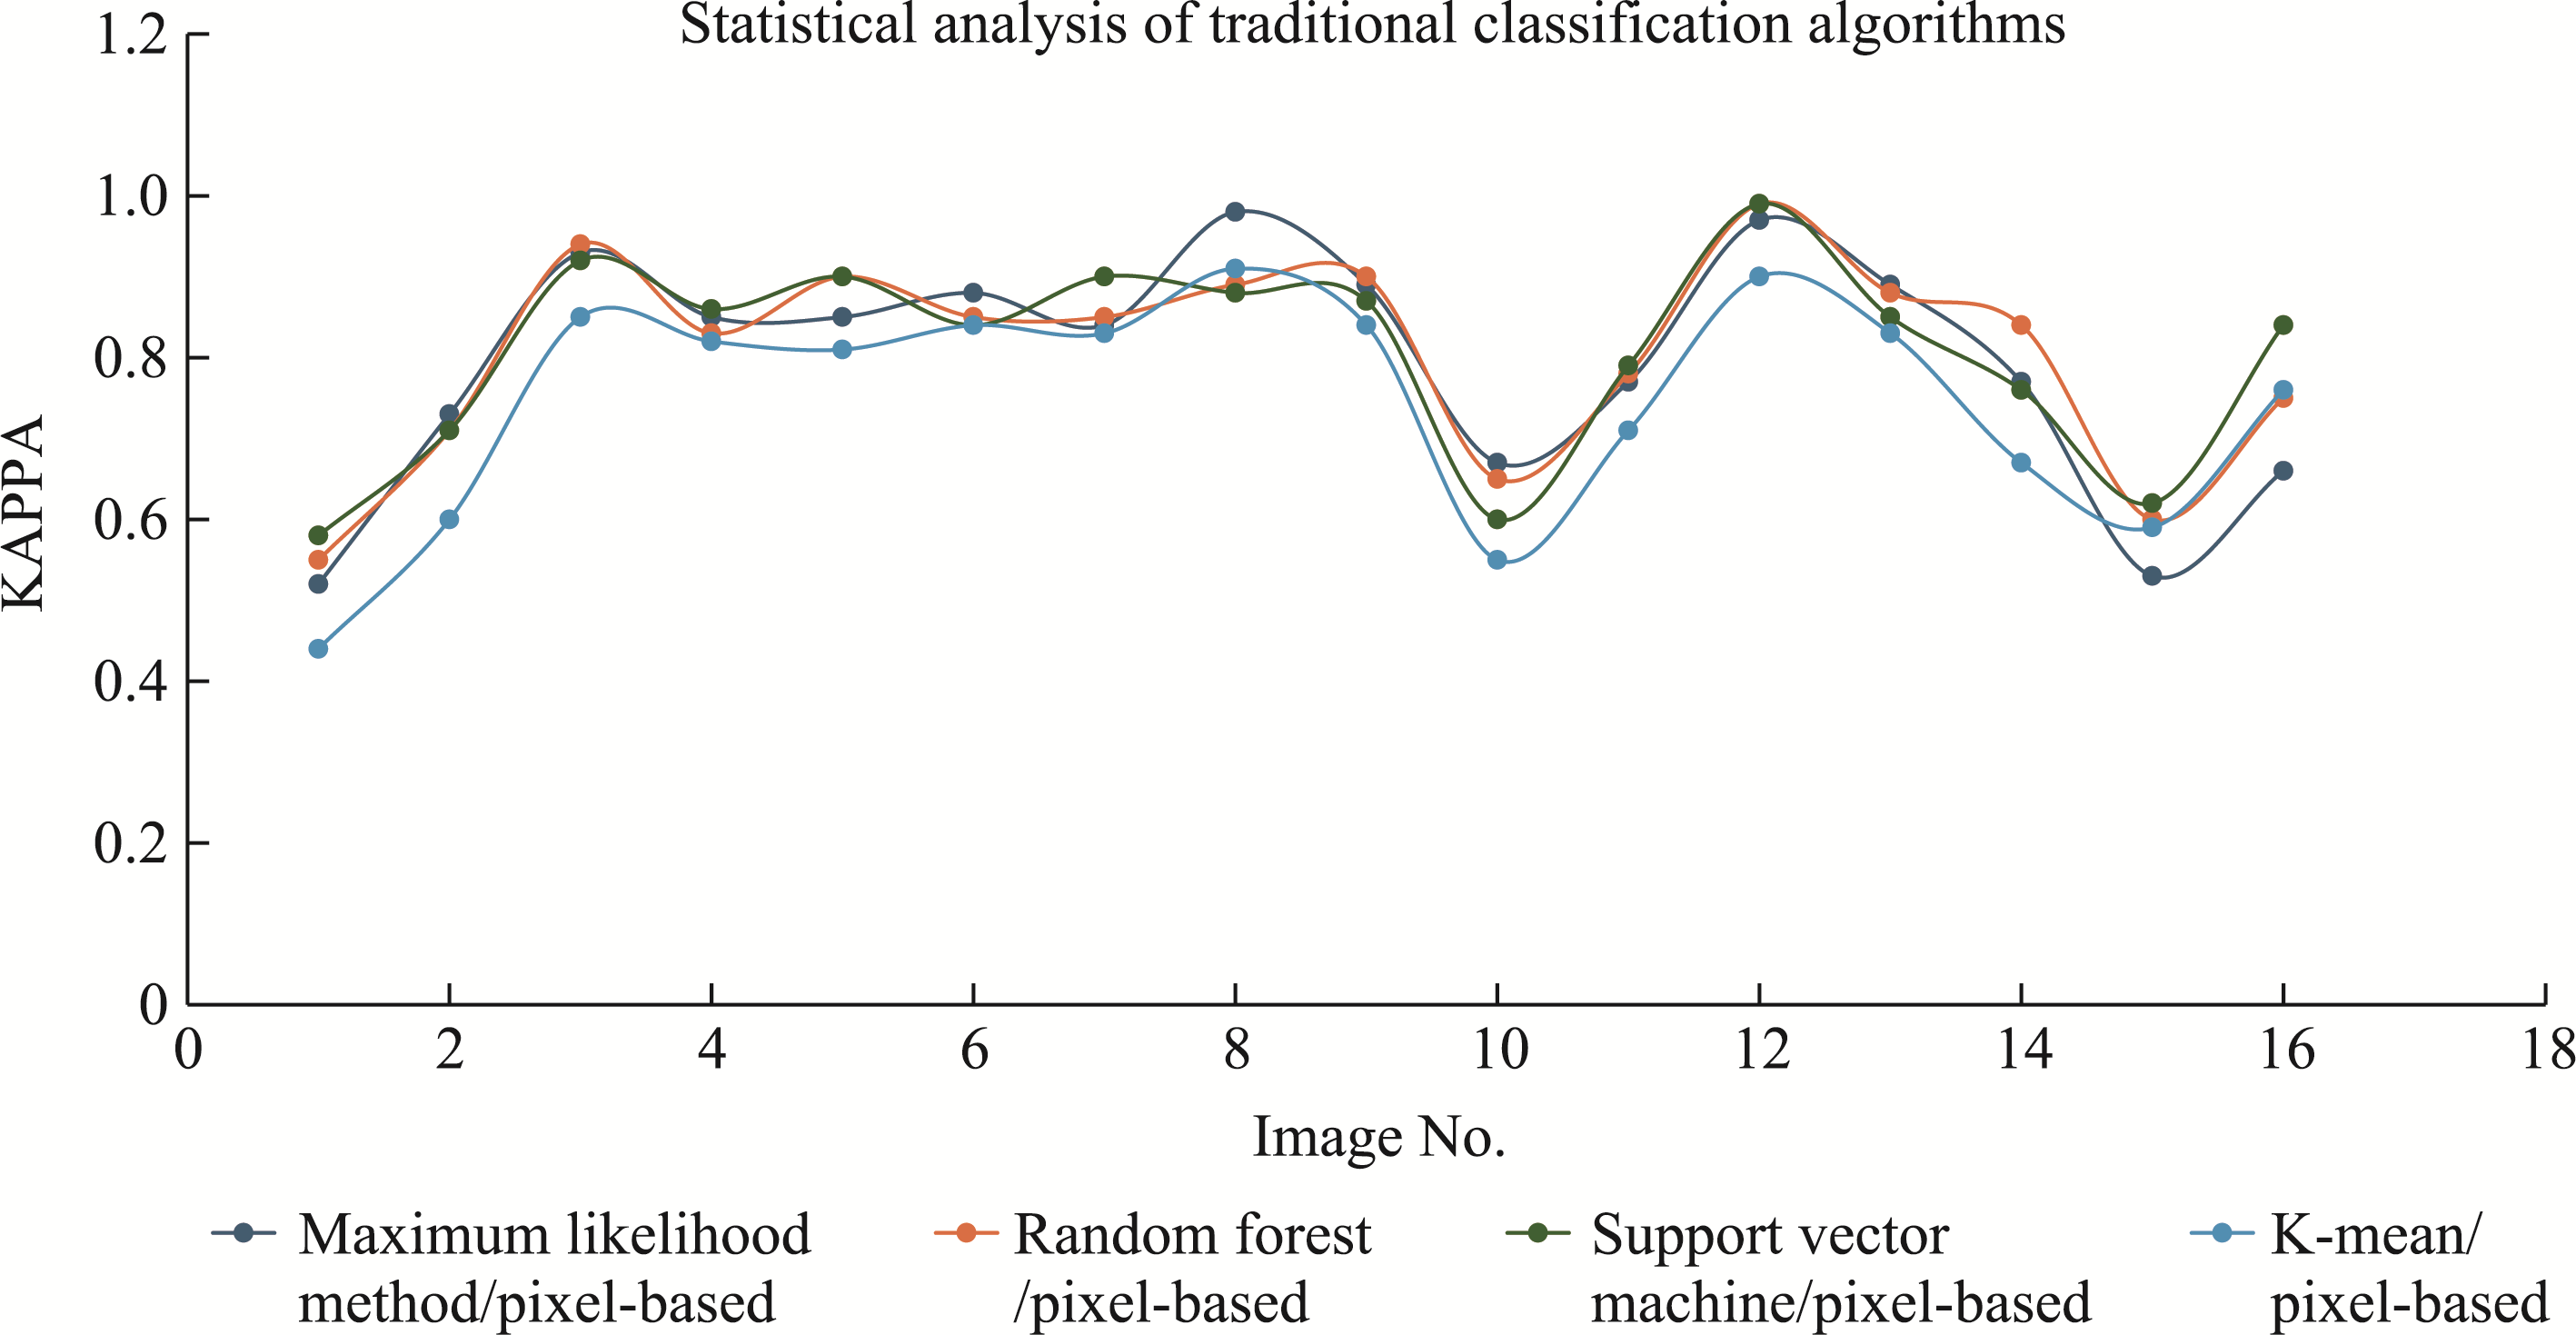
Kappa accuracy values for all images under different classification methods
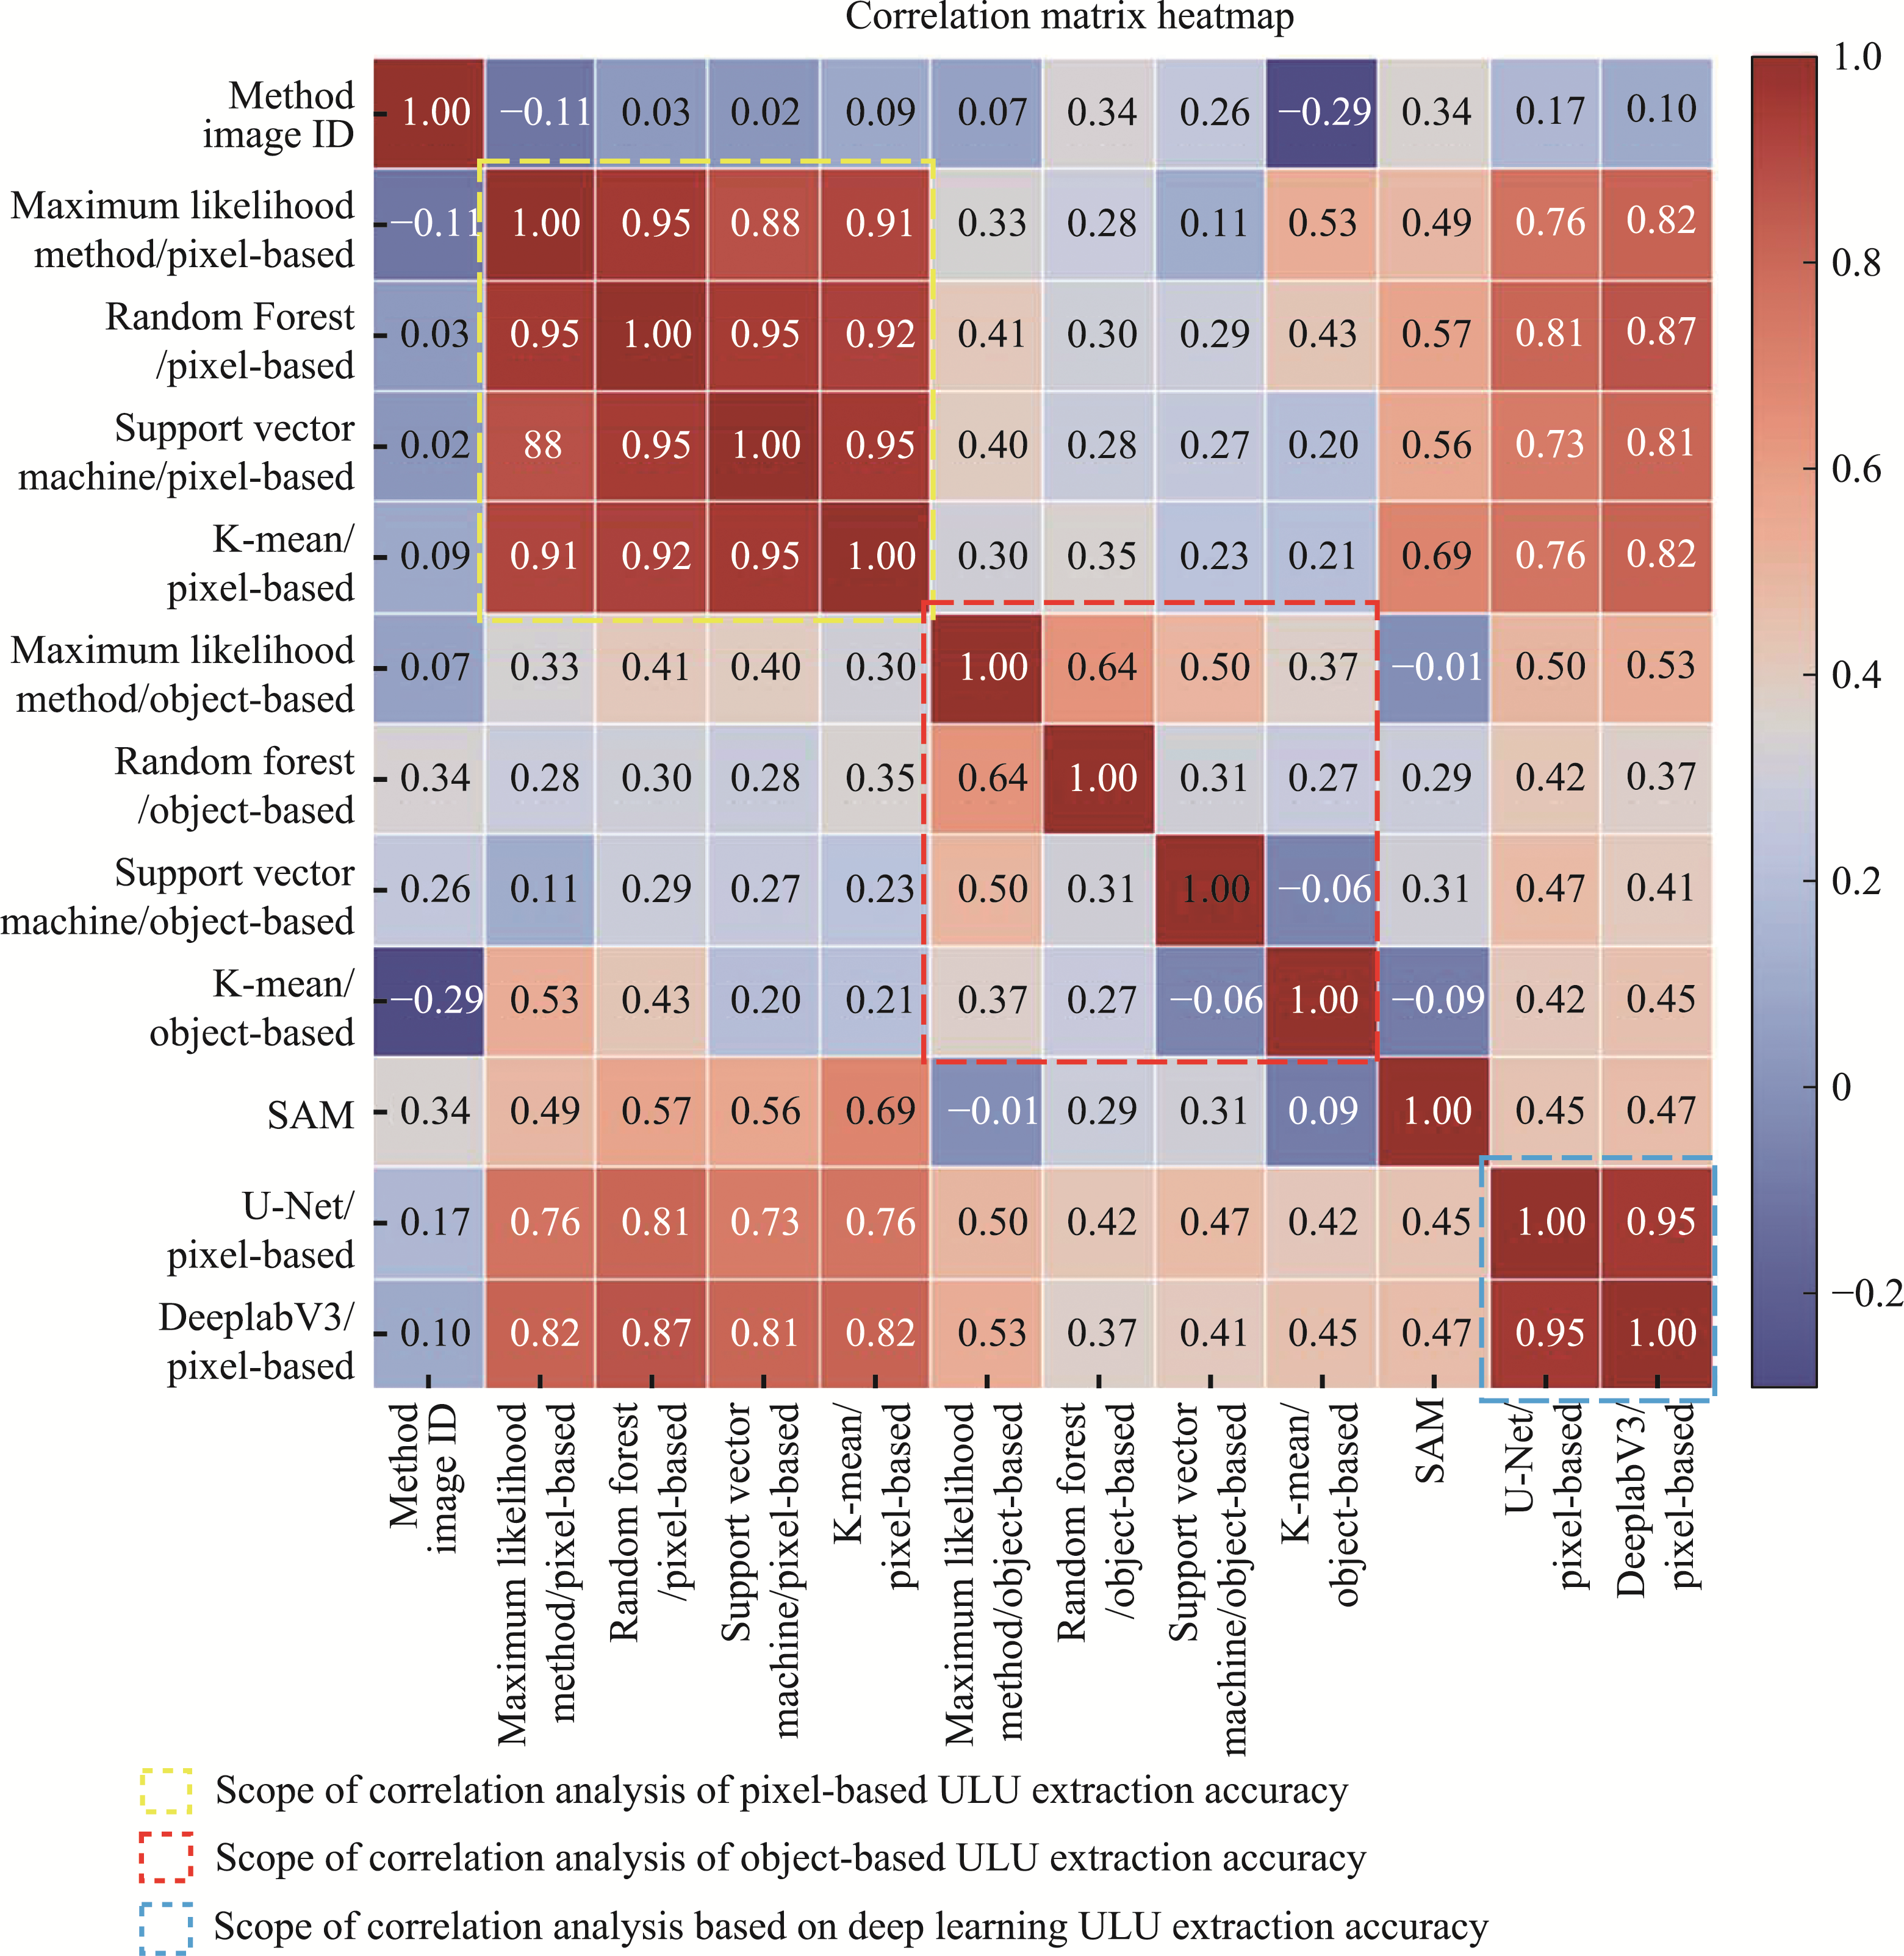
Figure 8
Correlation analysis diagram of UF extraction accuracy (Kappa) with different algorithms
Figure 9
Pixel-based UF extraction Kappa precision numerical graph based on four traditional algorithms
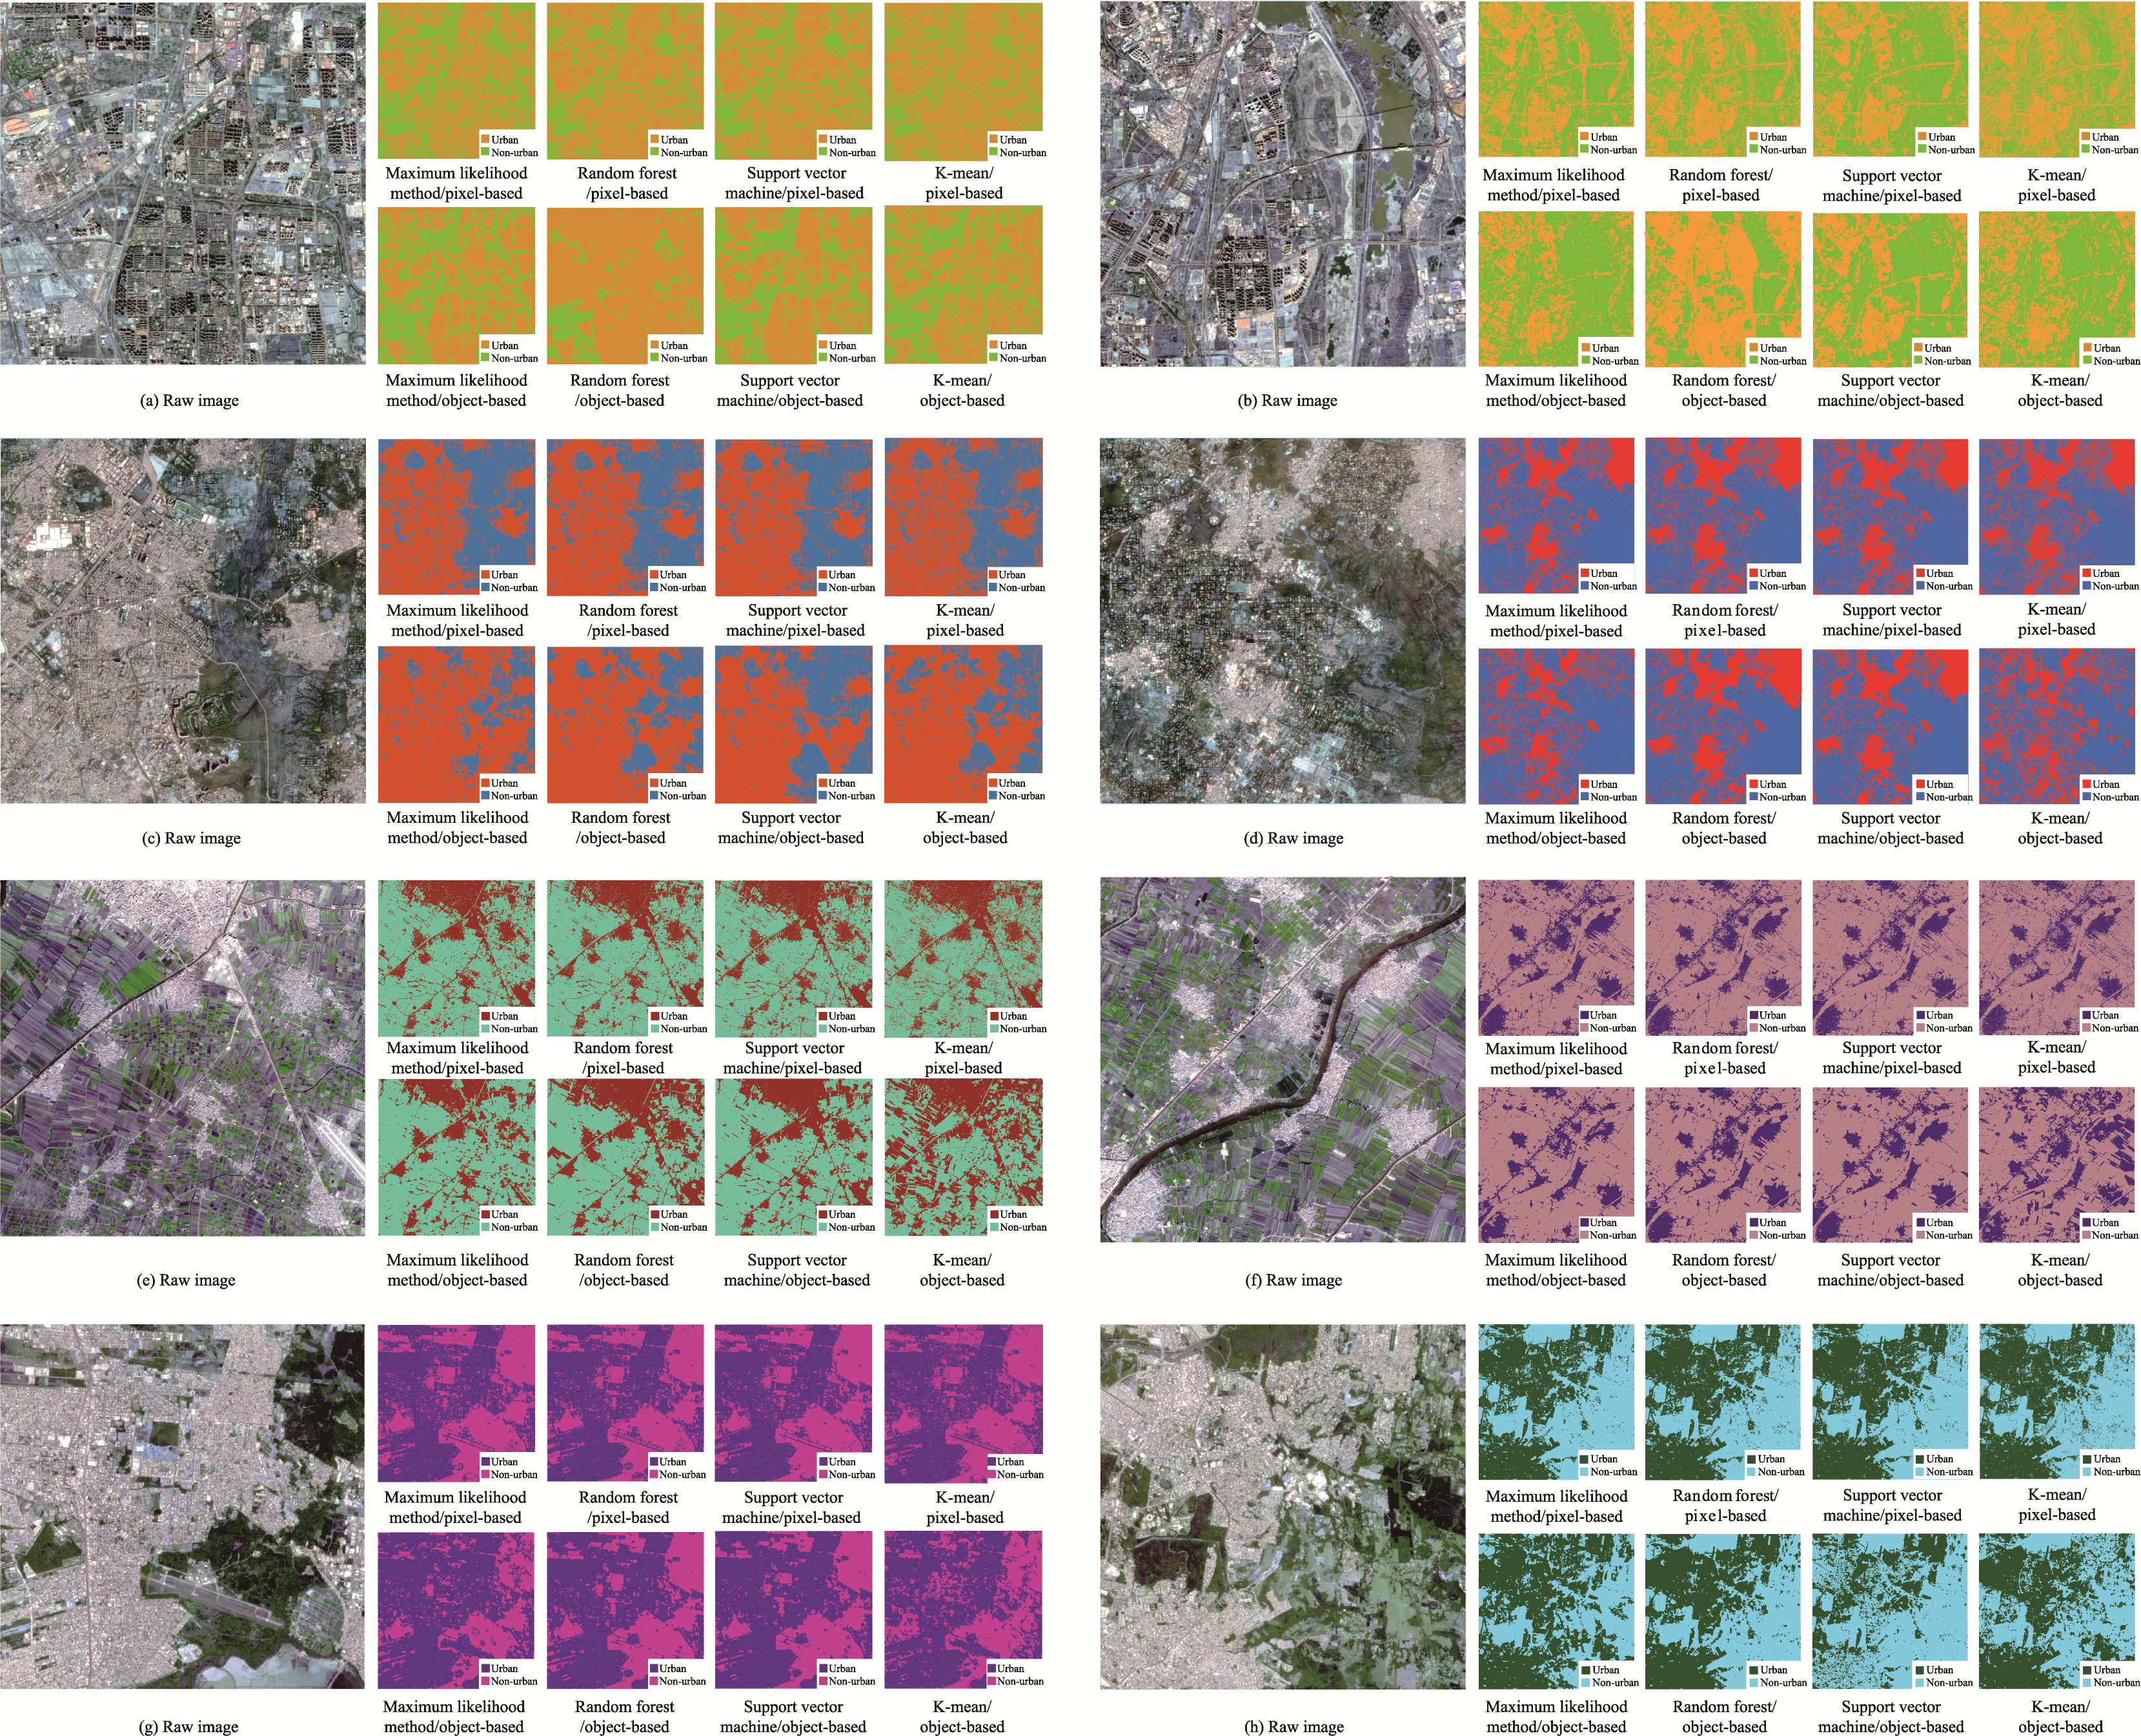
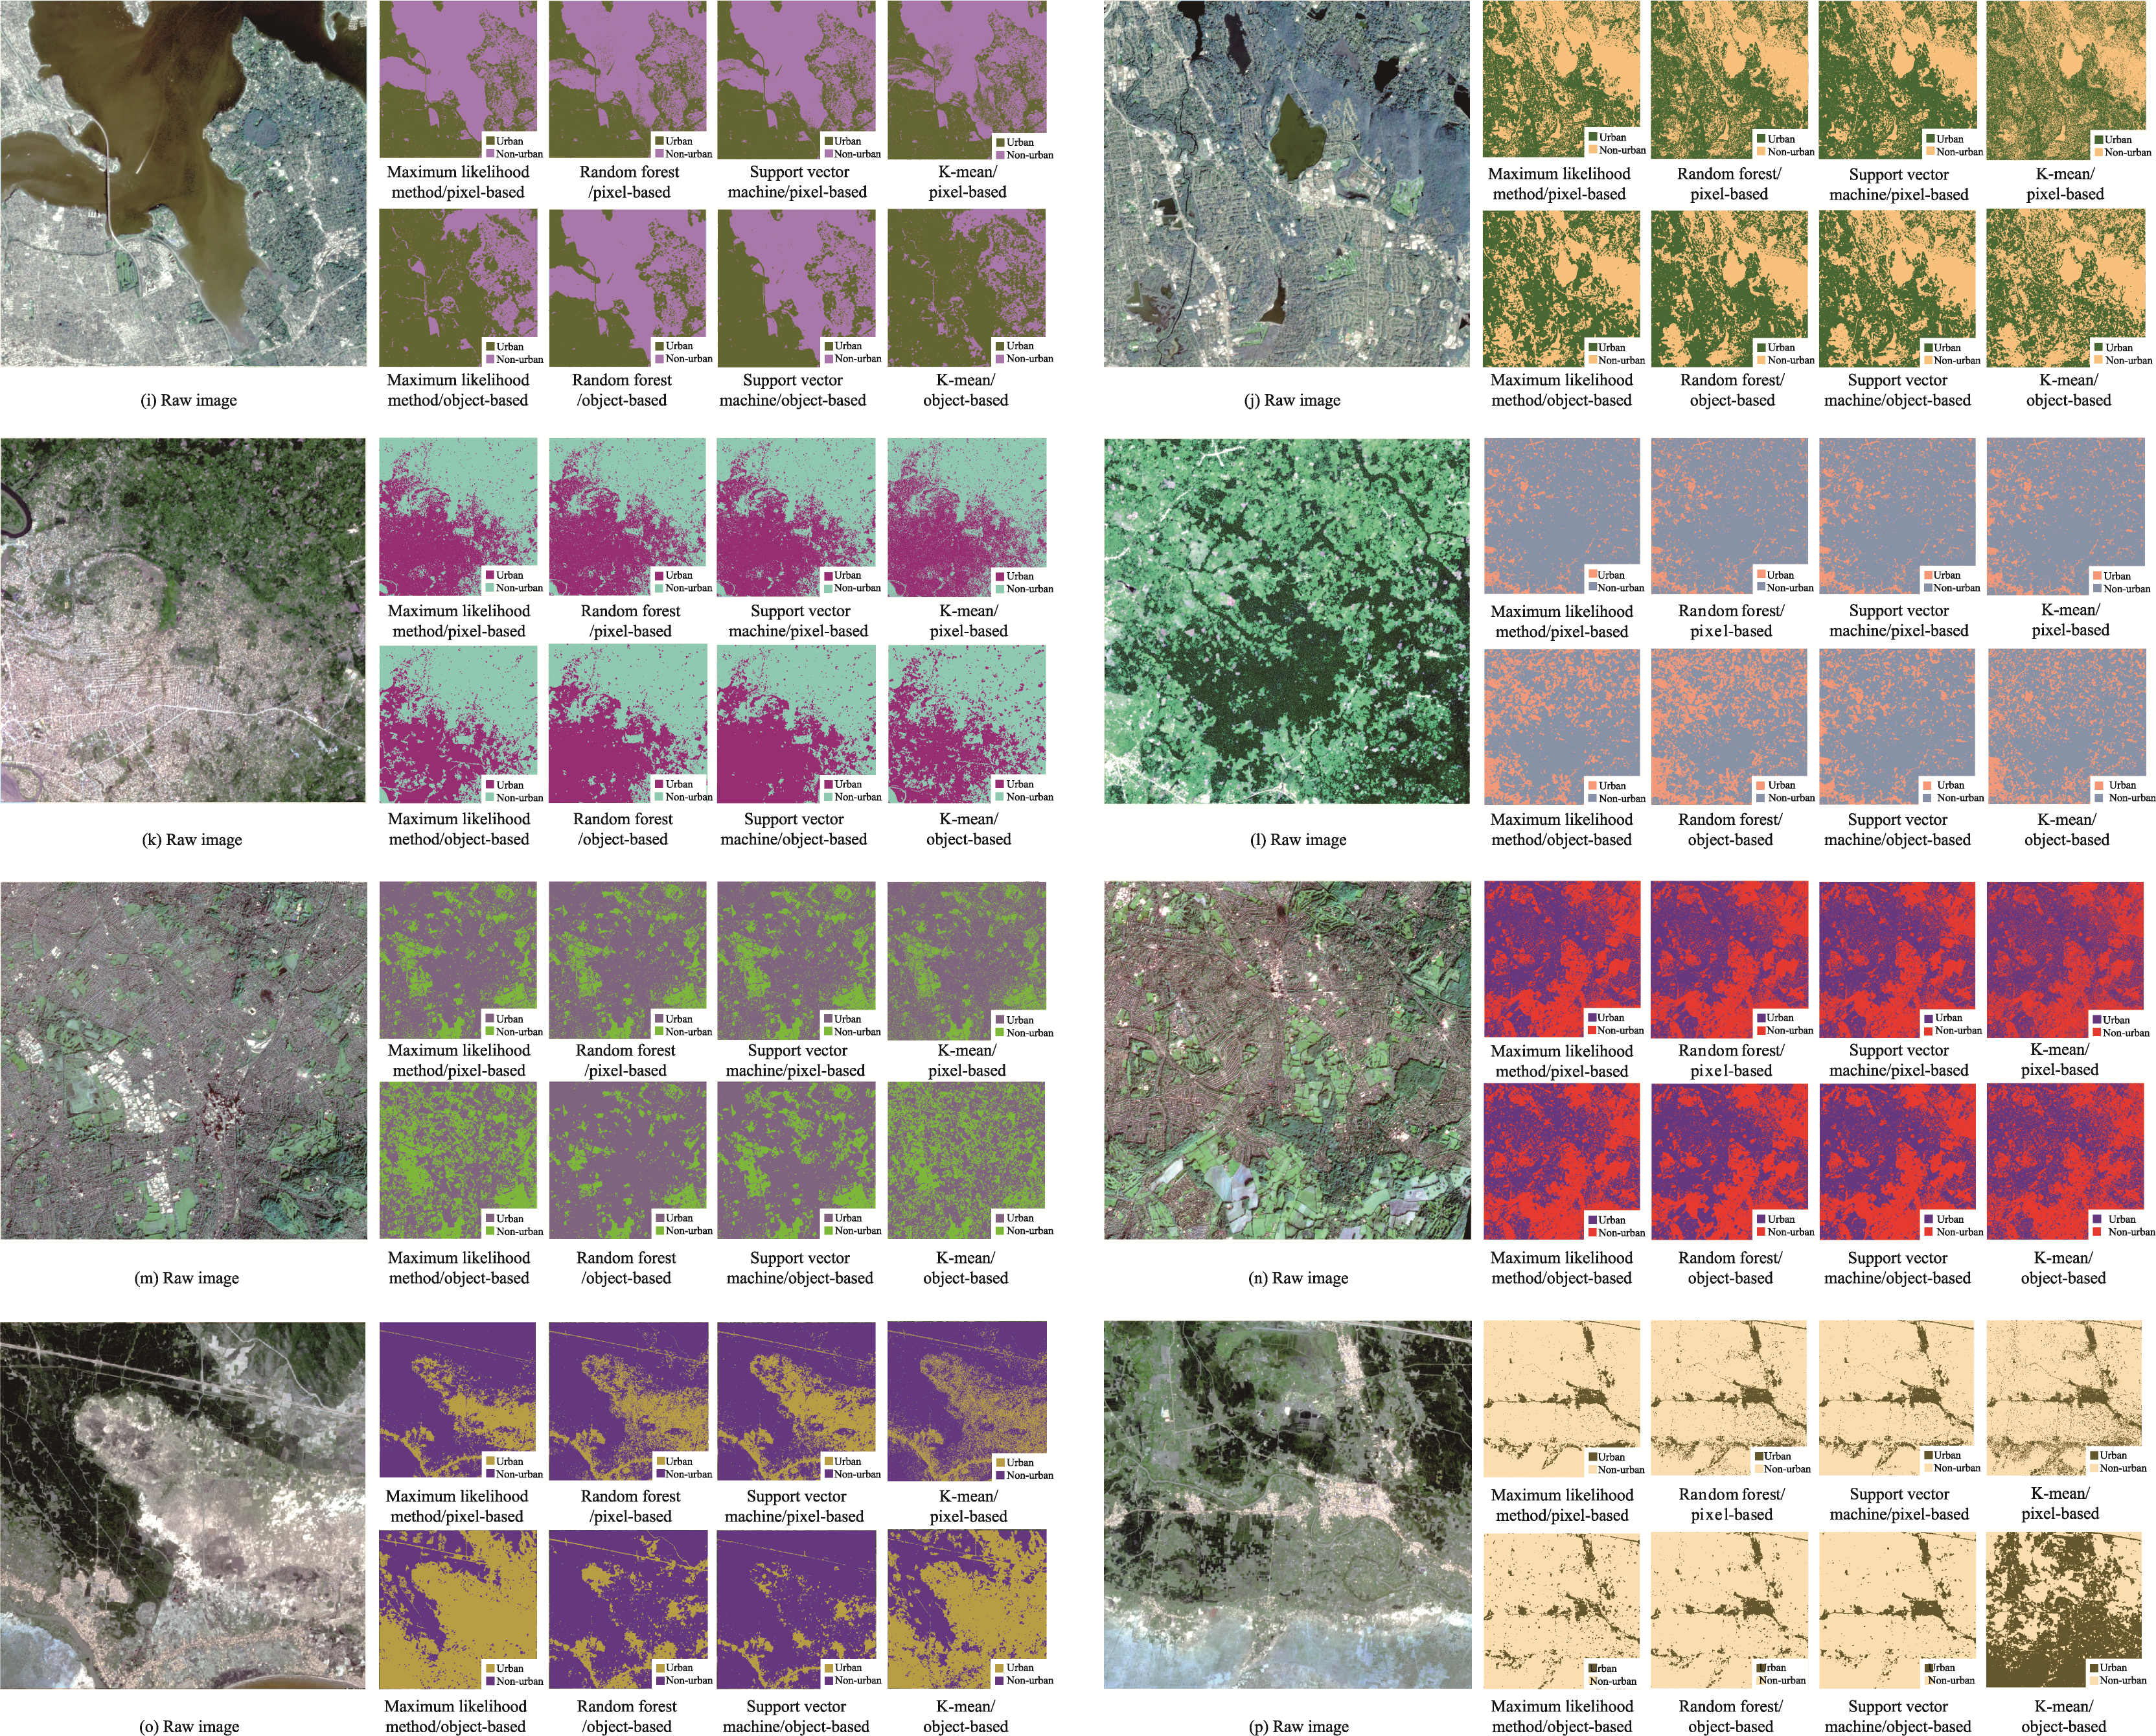
Figure 10
a to h images of UF extraction results based on four traditional algorithms, both pixel-based and object-based. Among them, Image a and b are from Beijing, China, c and d are from New Delhi, India, e and f are from Mansouria, Egypt, and g and h are from Porto Alegre, Brazil.
Figure 11
The results of UF extraction based on four traditional algorithms, both pixel-based and object-based, are presented for images i through p. Among them, Image i and j from New York, USA, k and l from Kisangani, Sudan, m and n from London, UK, o and p from Phan Thiet, Vietnam.
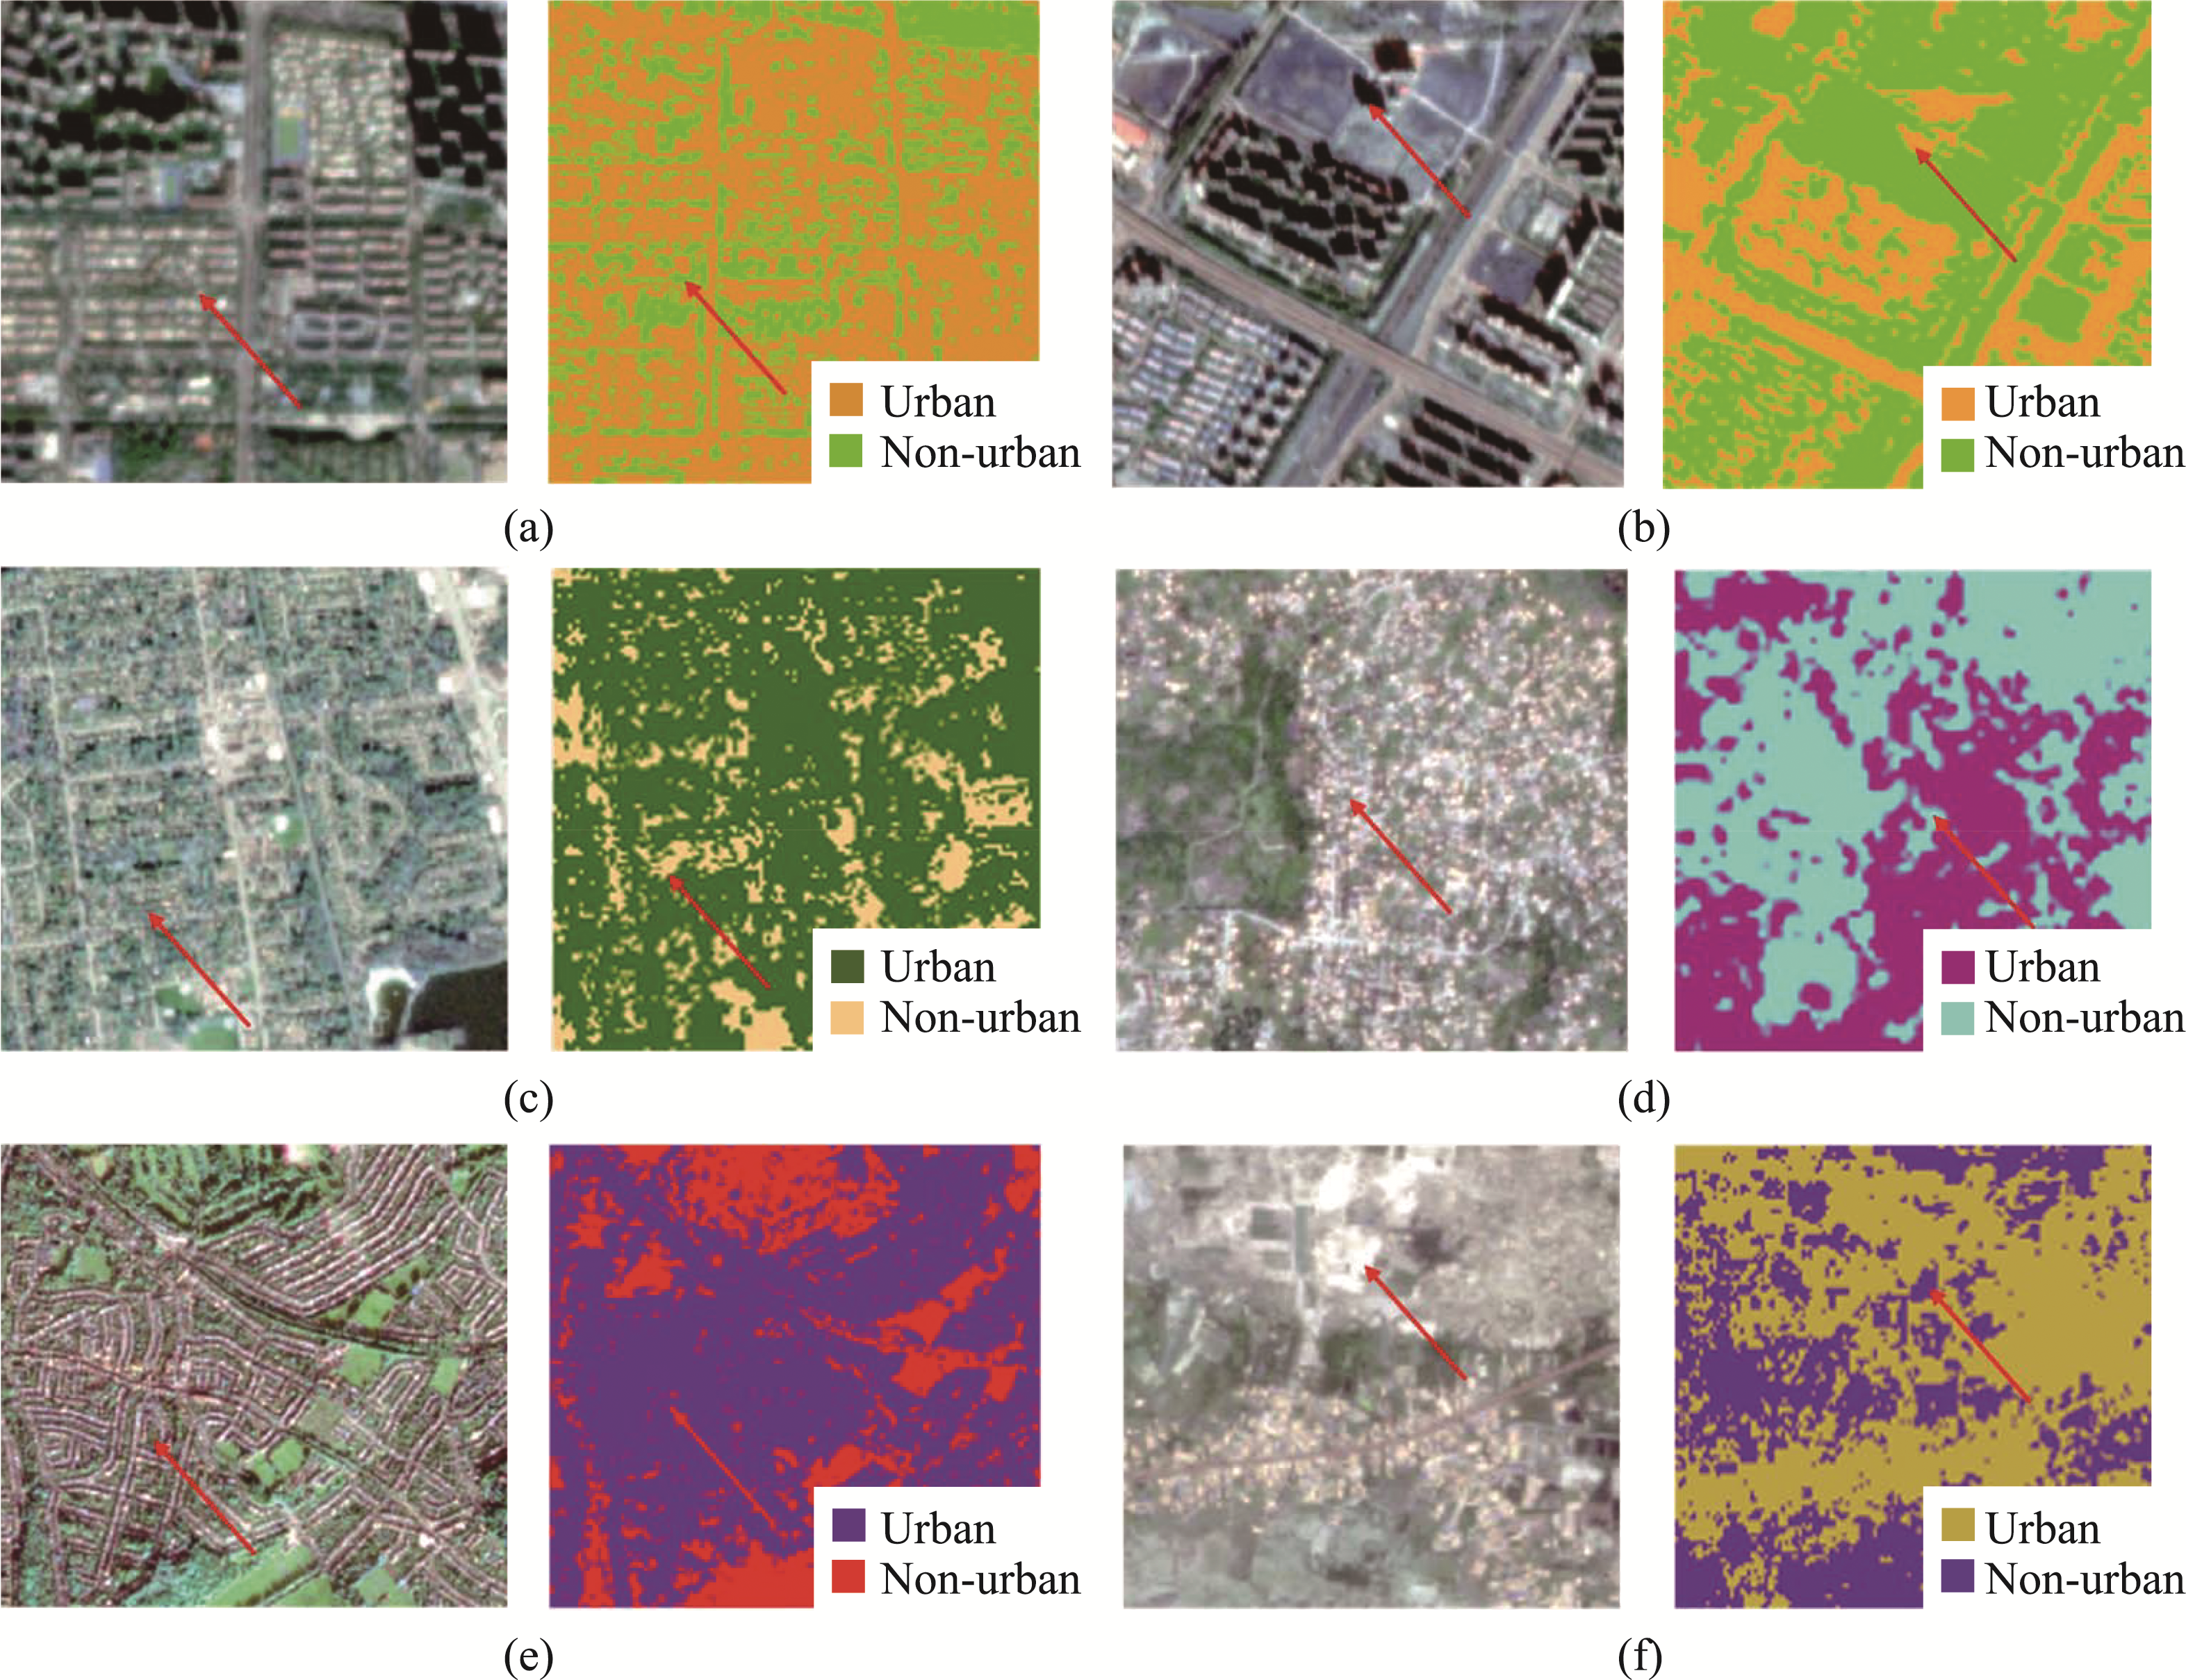
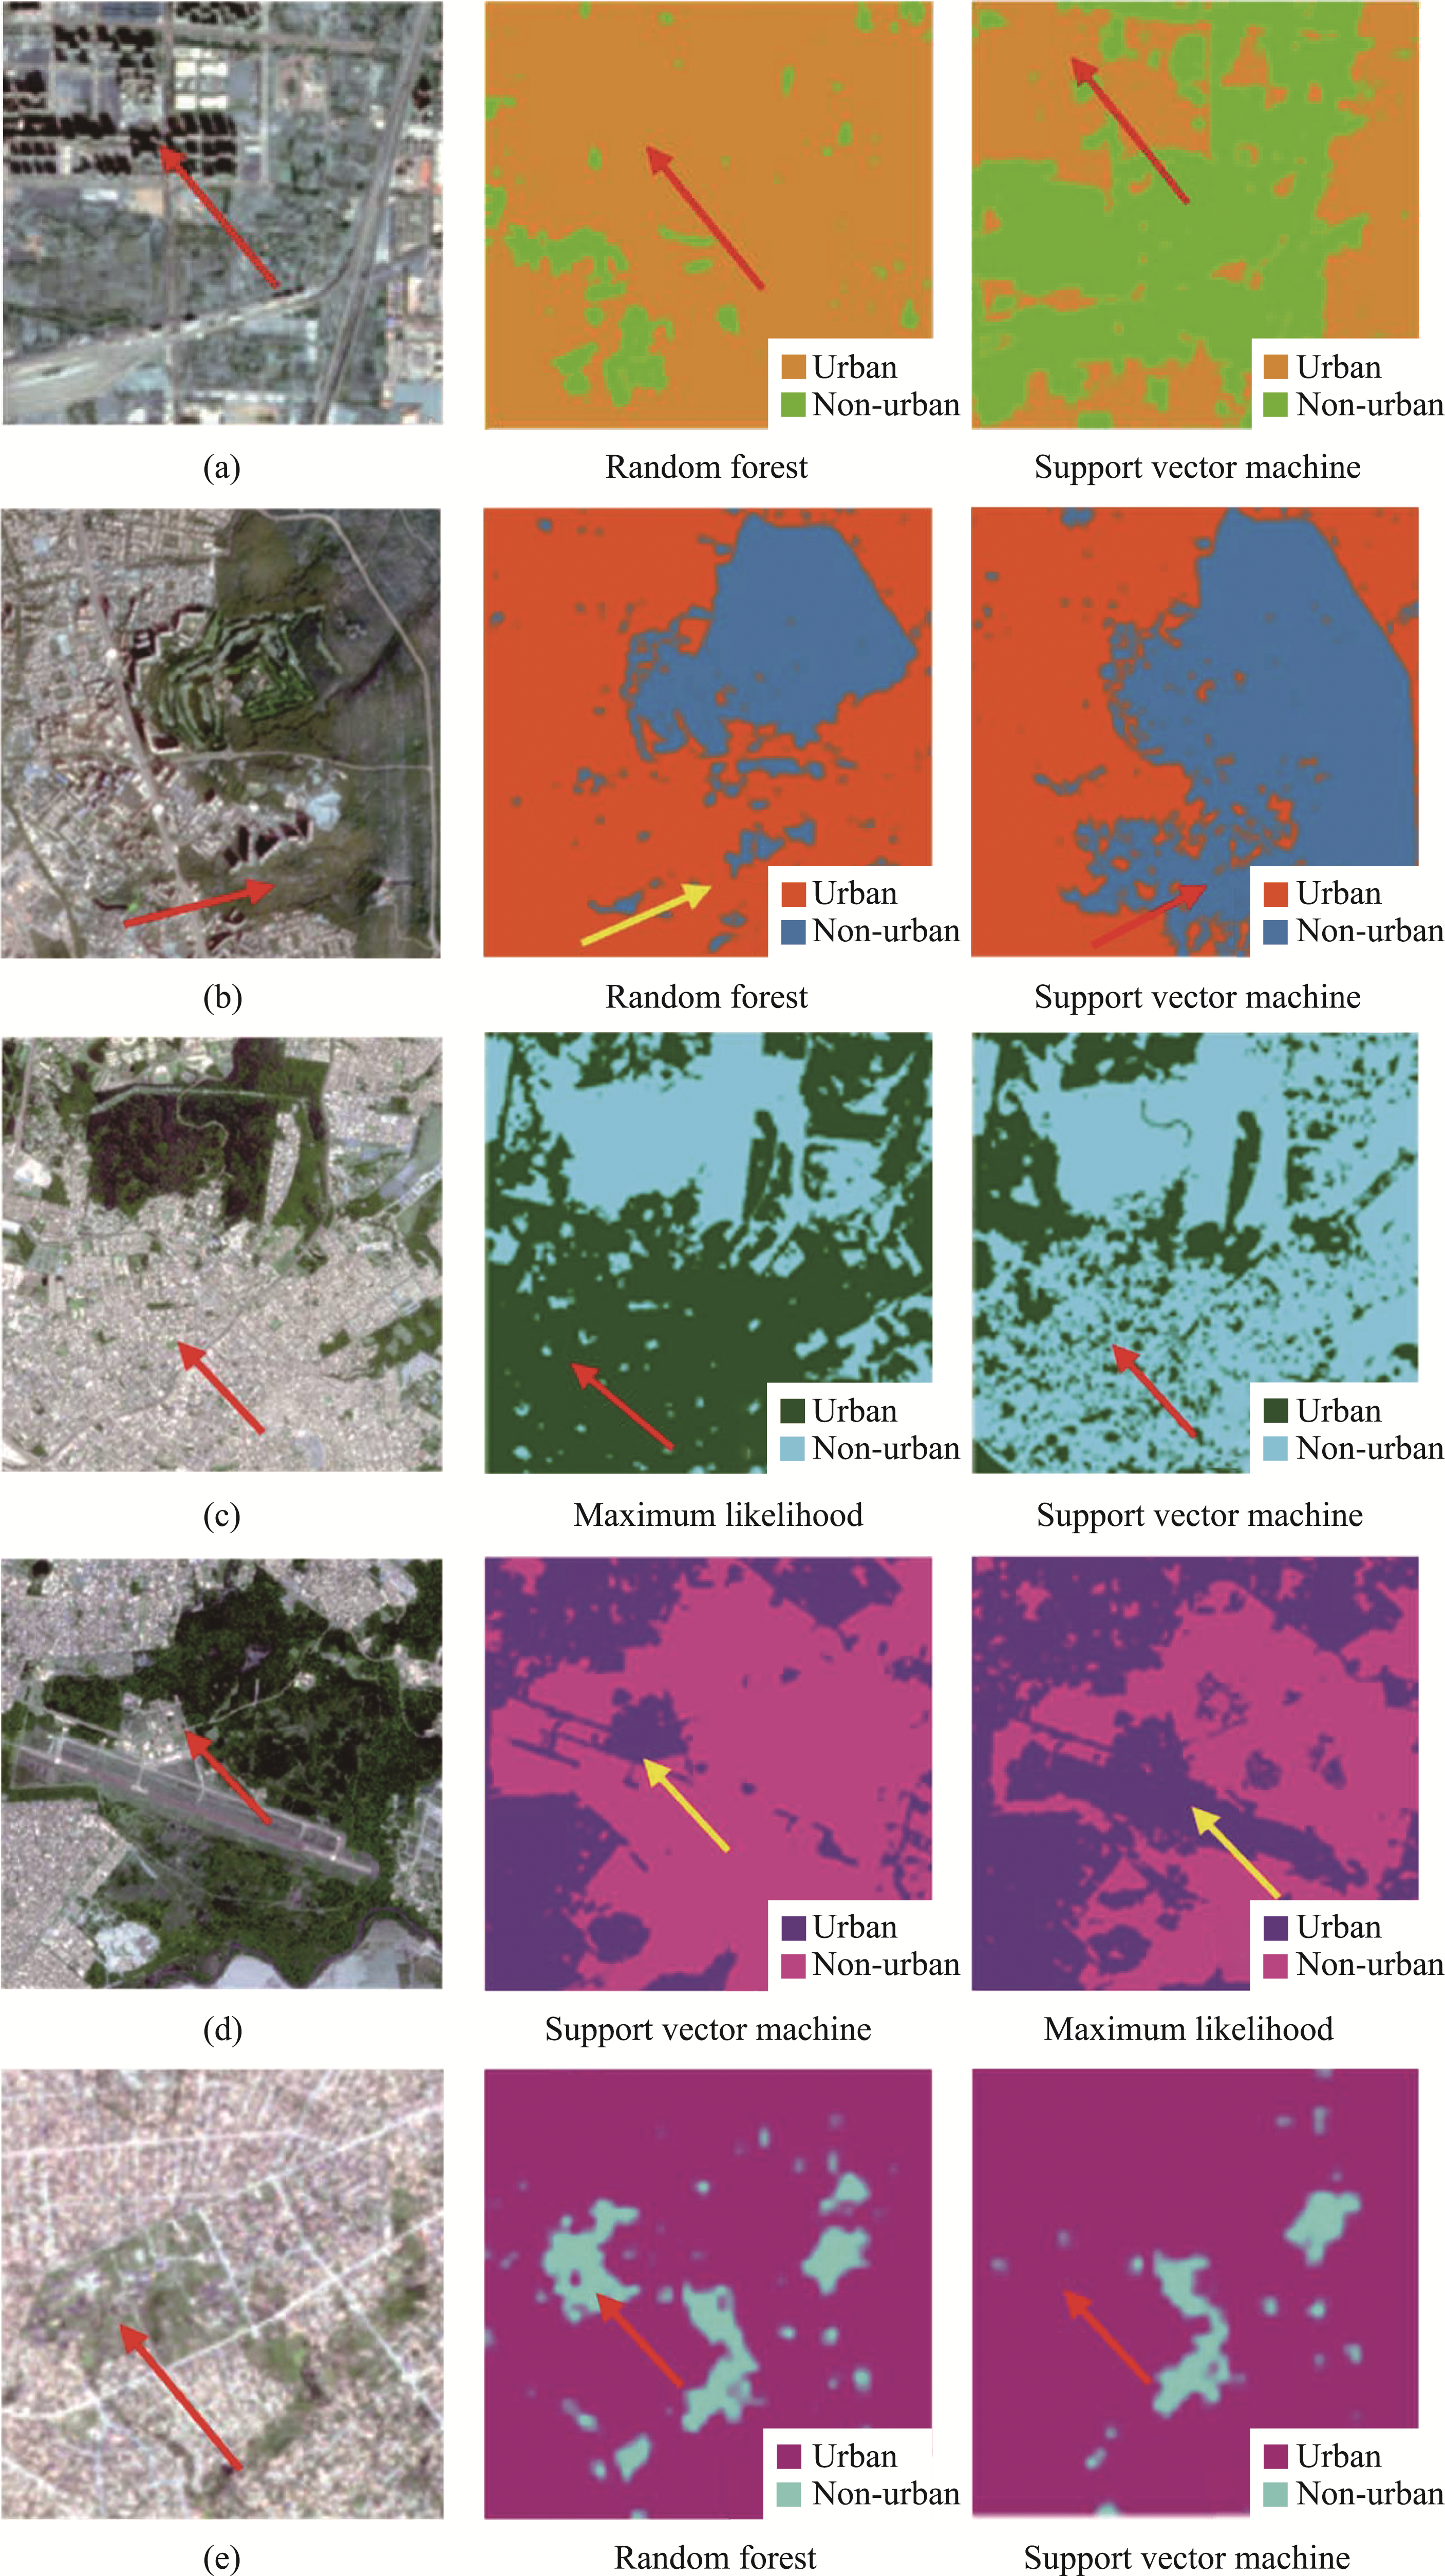
Figure 12
Partial classification misclassification region visualization results (pixel-based)
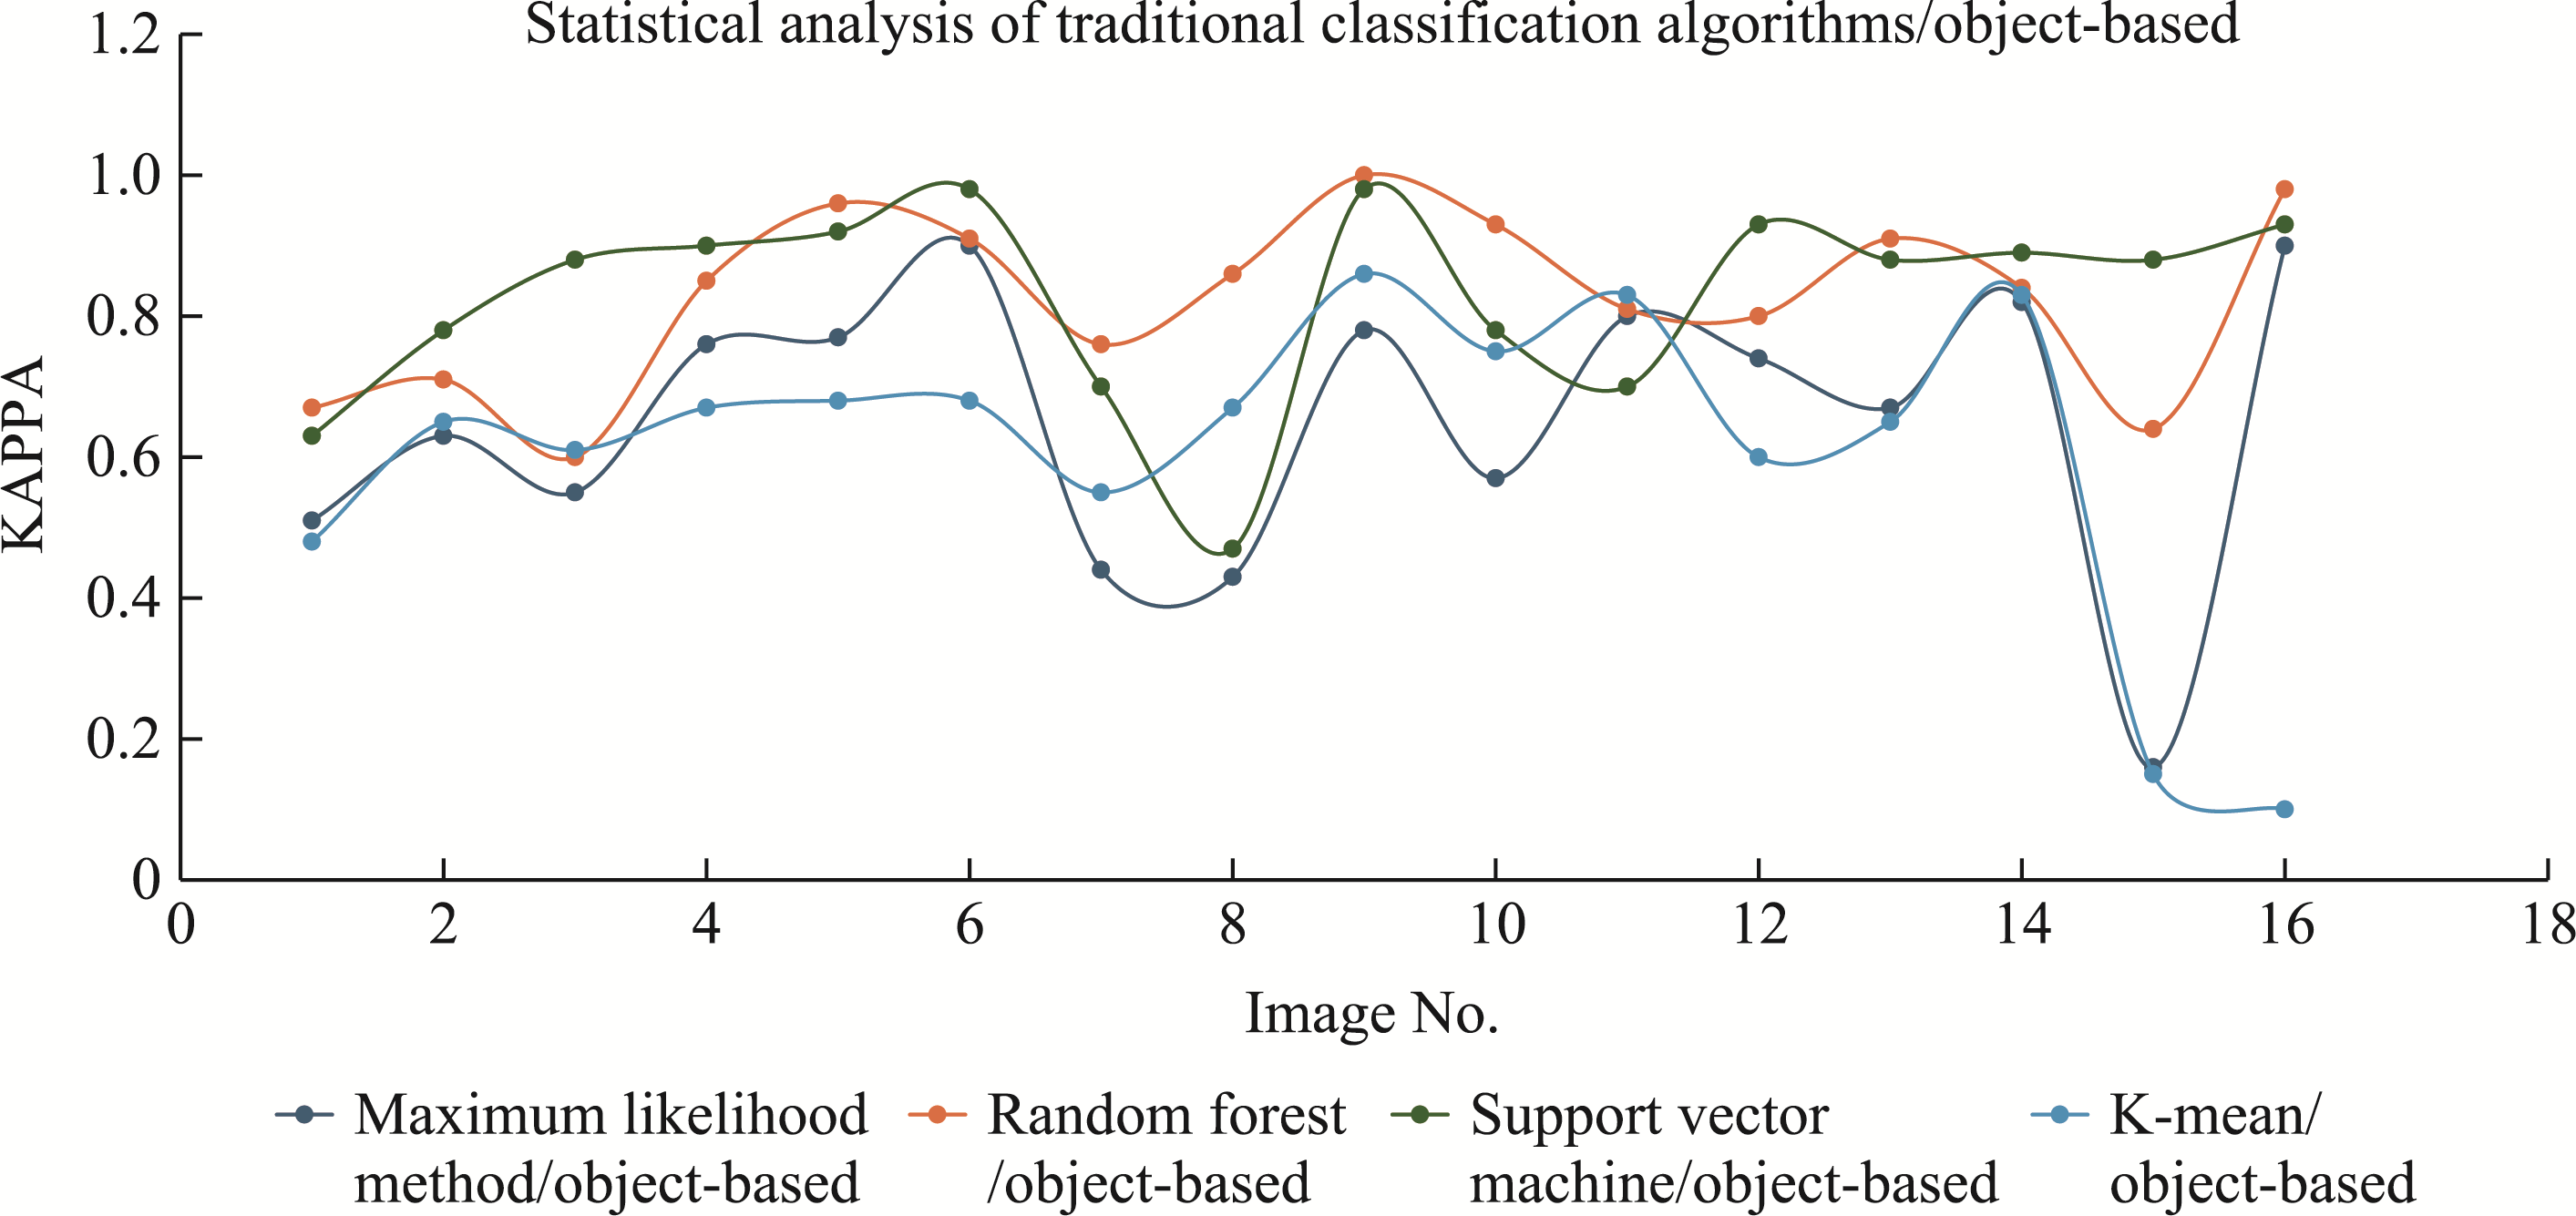
Figure 13
Object-based Kappa precision numerical graph for UF extraction based on four traditional algorithms
Figure 14
Partial classification misclassification region visualization results (object-based)
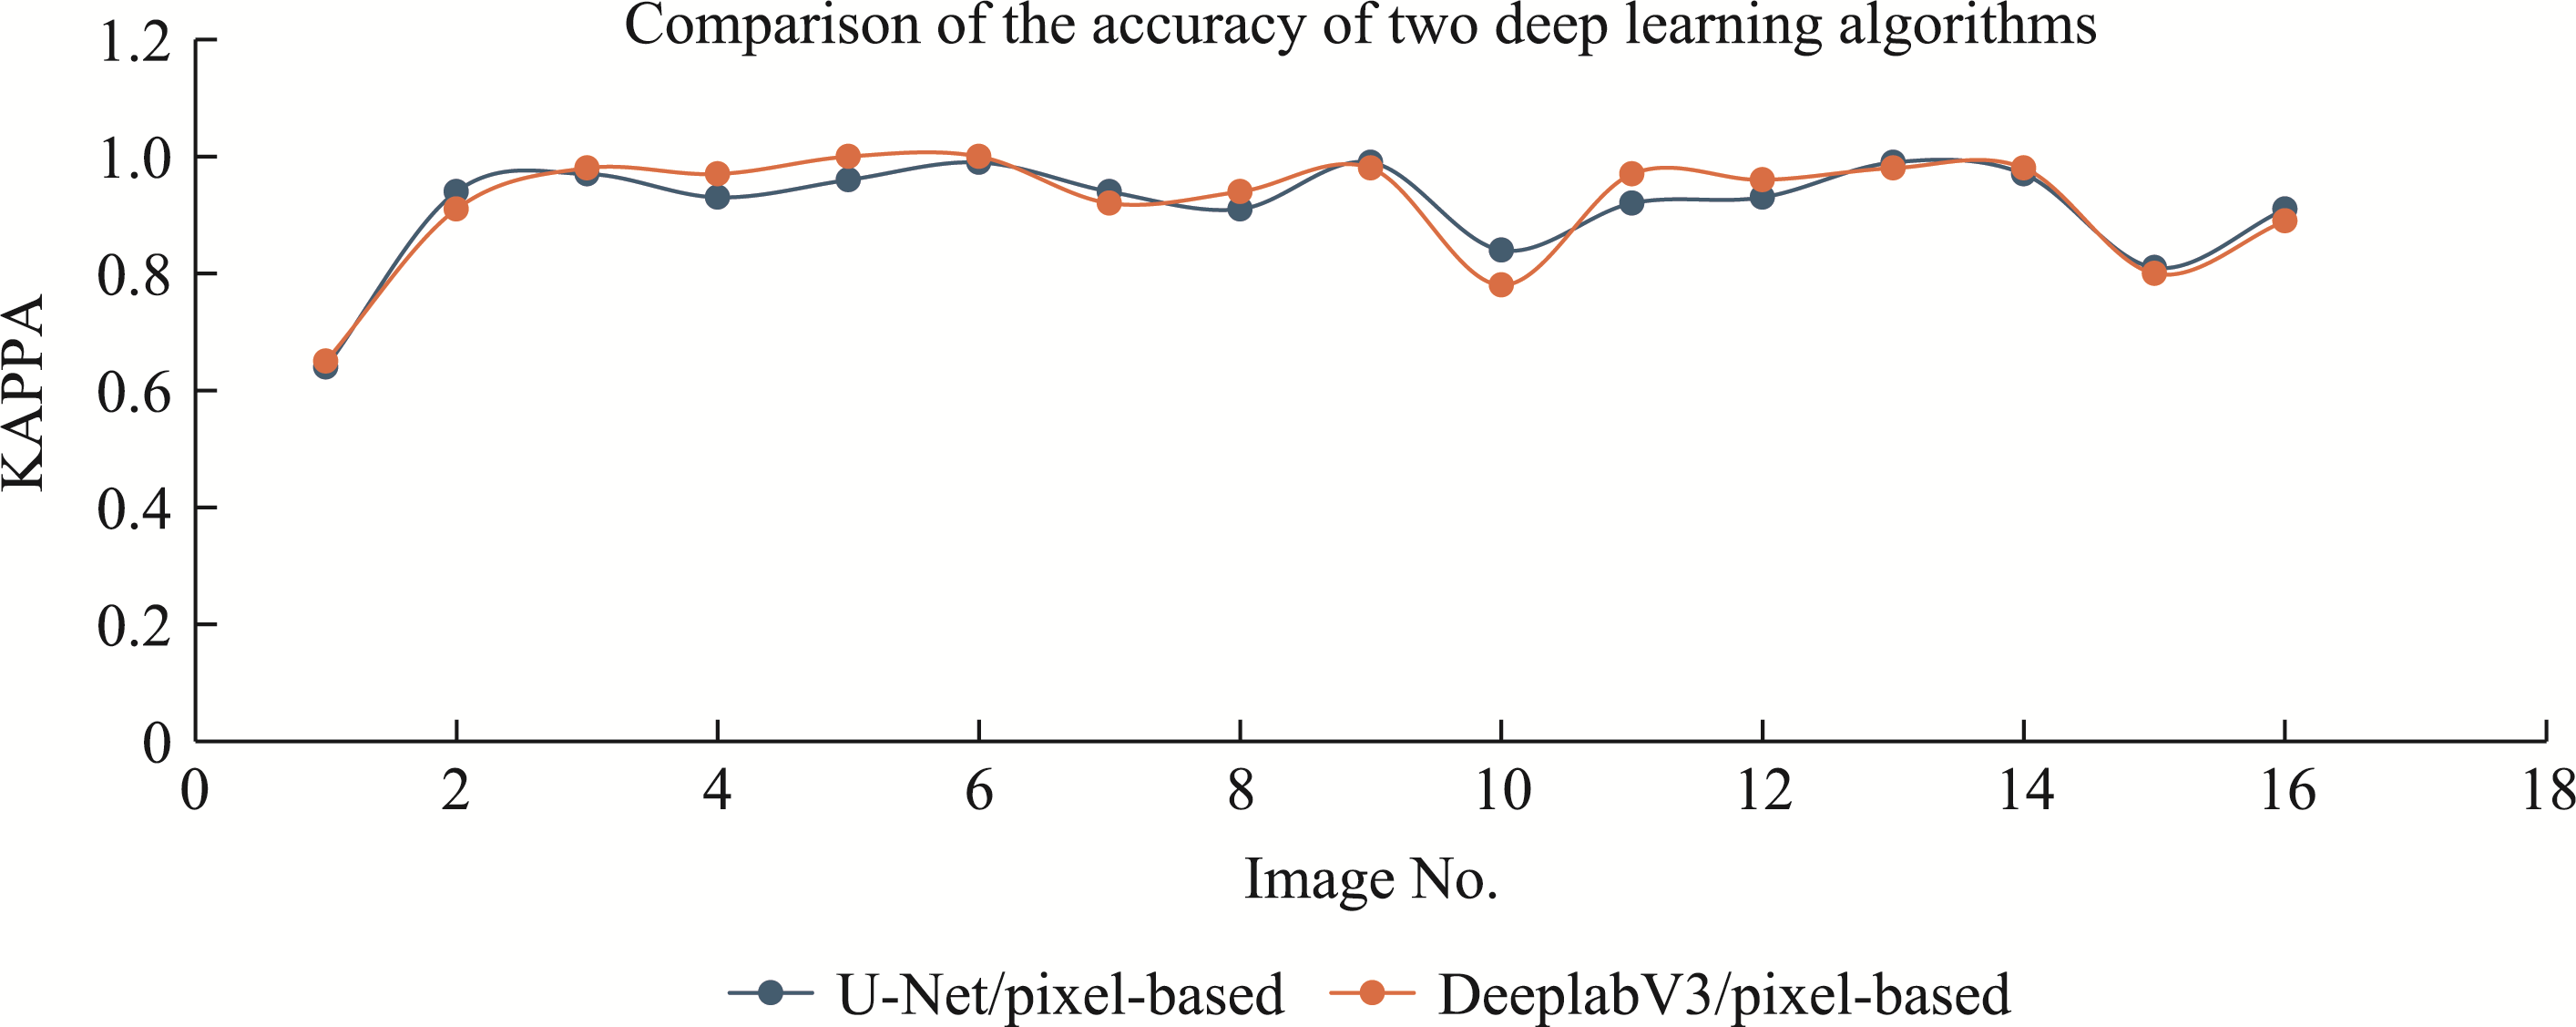
Figure 15
Kappa precision numerical curve of UF extraction based on deep learning
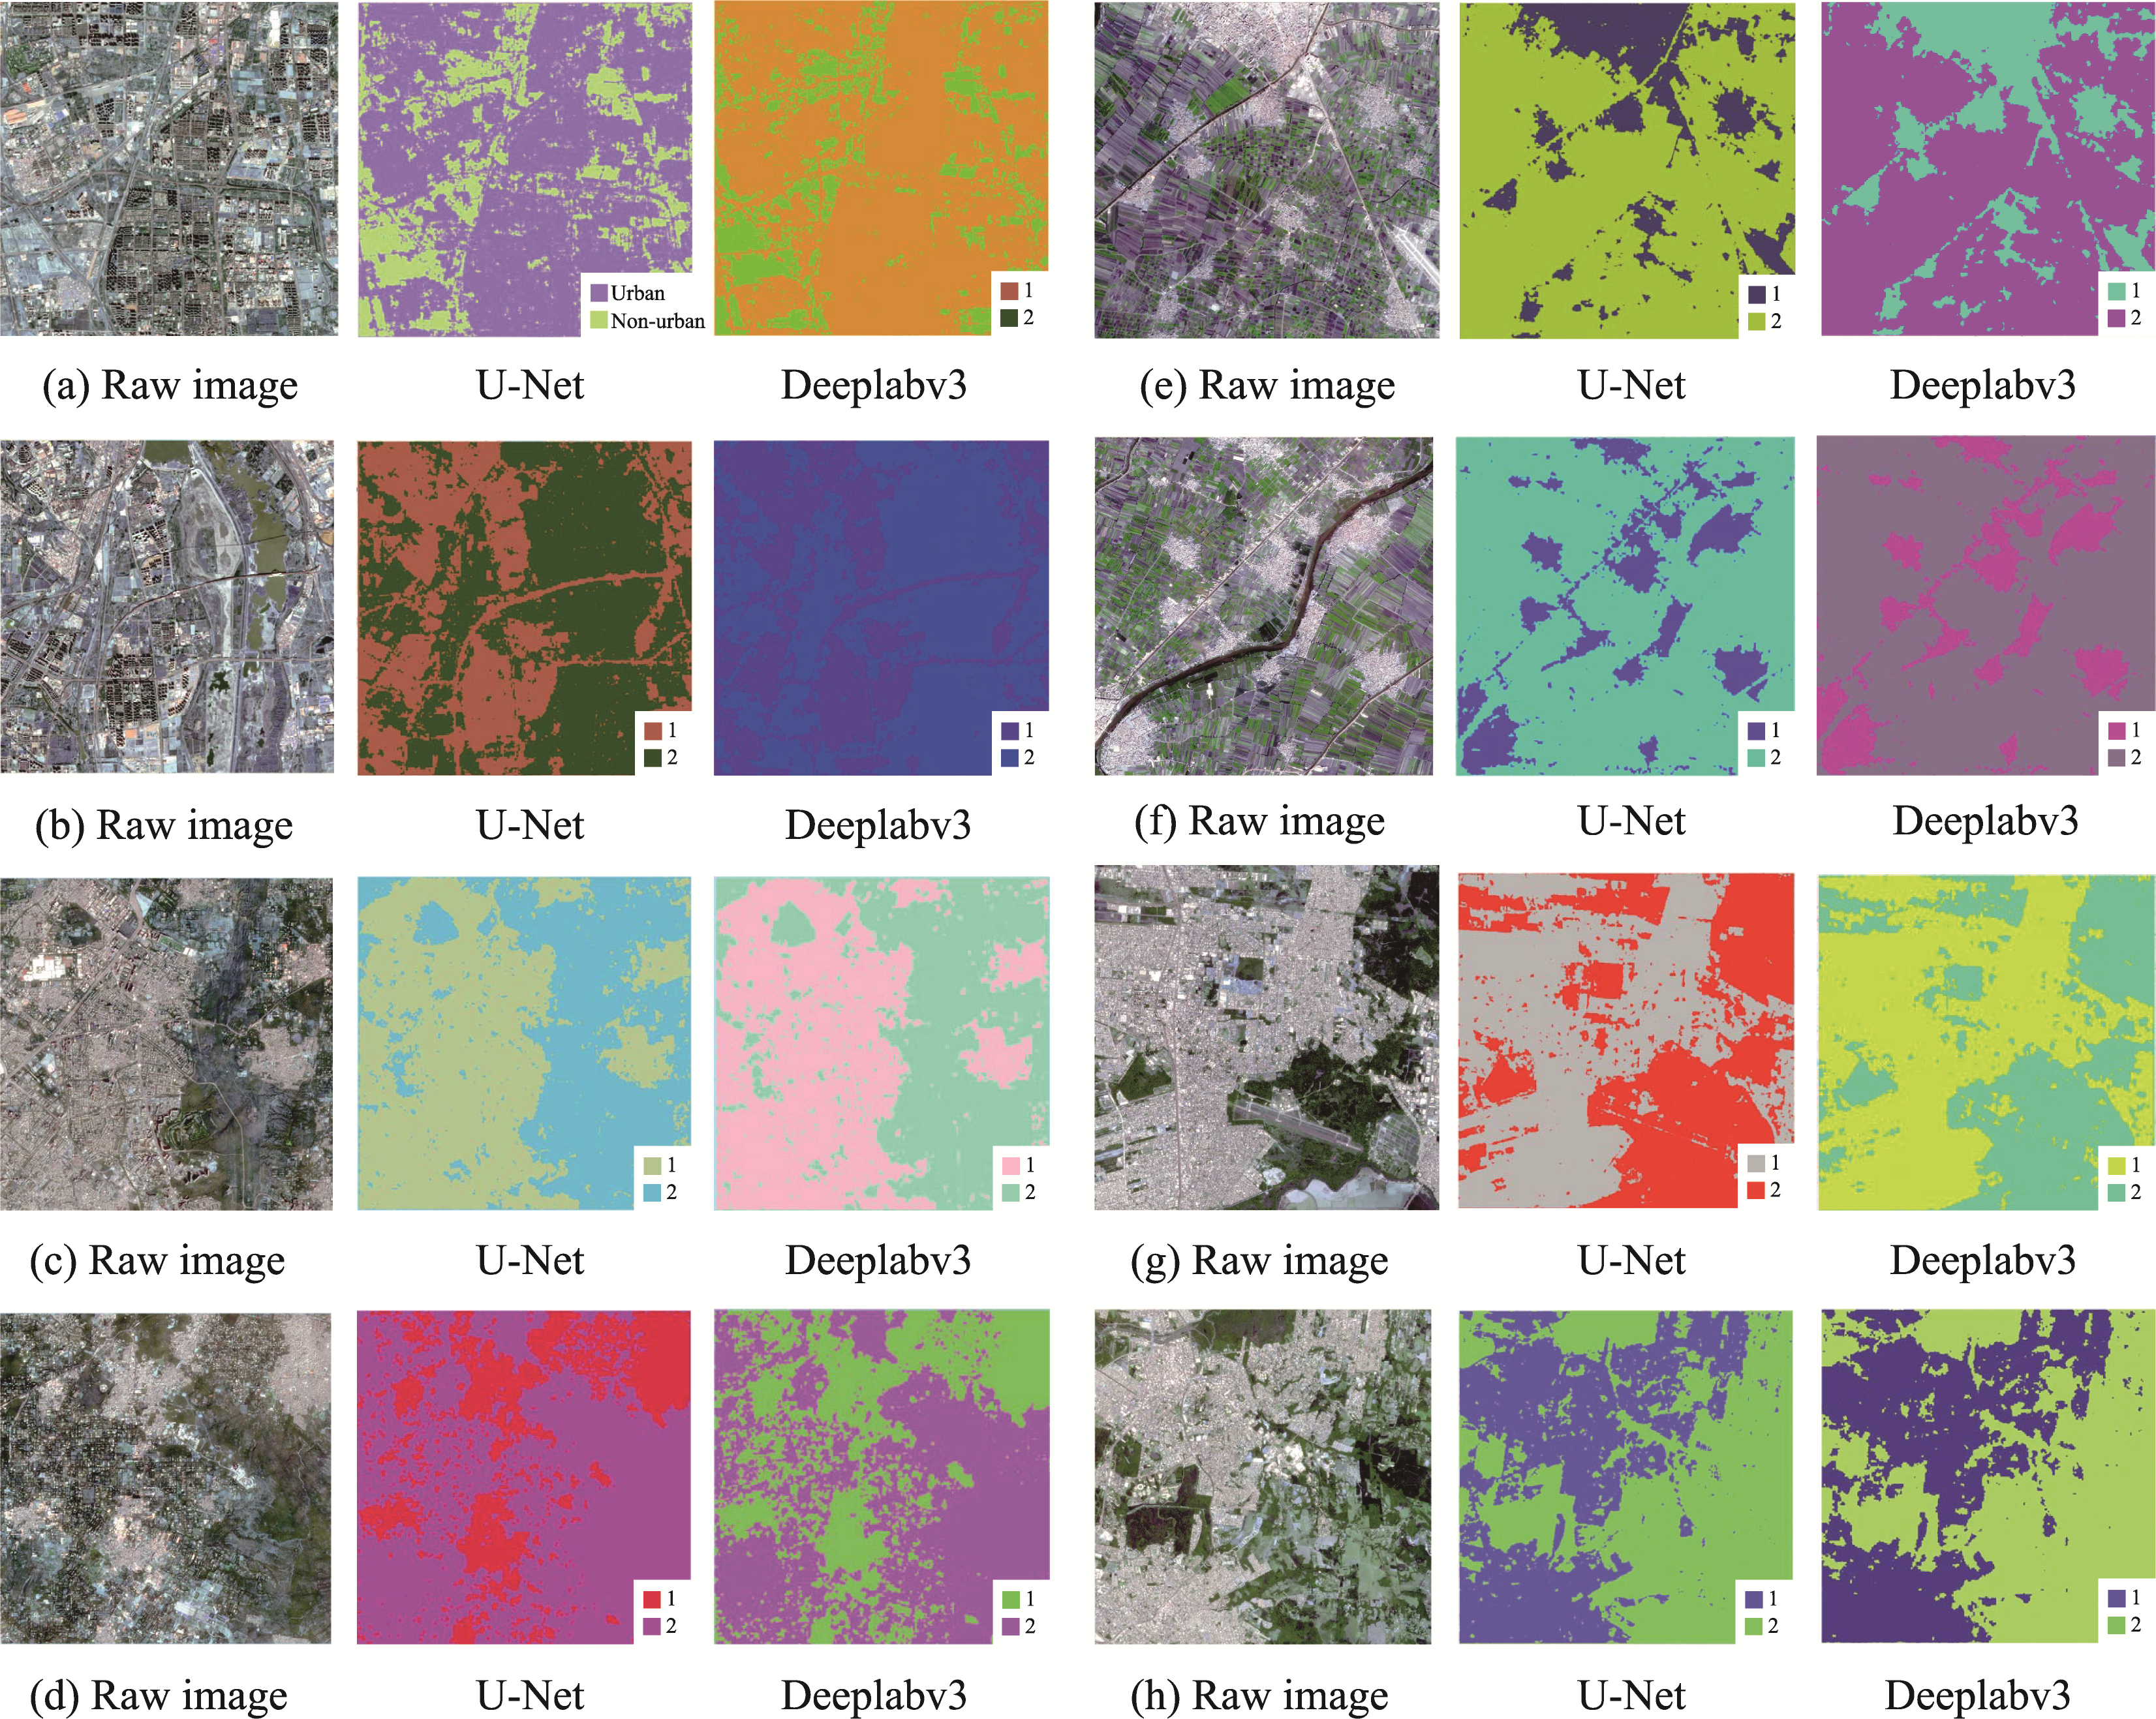
Figure 16
a to h images of UF extraction results based on two deep learning algorithms. Among them, Image a and b are from Beijing, China, c and d are from New Delhi, India, e and f are from Mansouria, Egypt, and g and h are from Porto Alegre, Brazil. In the legend, 1 represents urban areas and 2 represents non-urban areas.
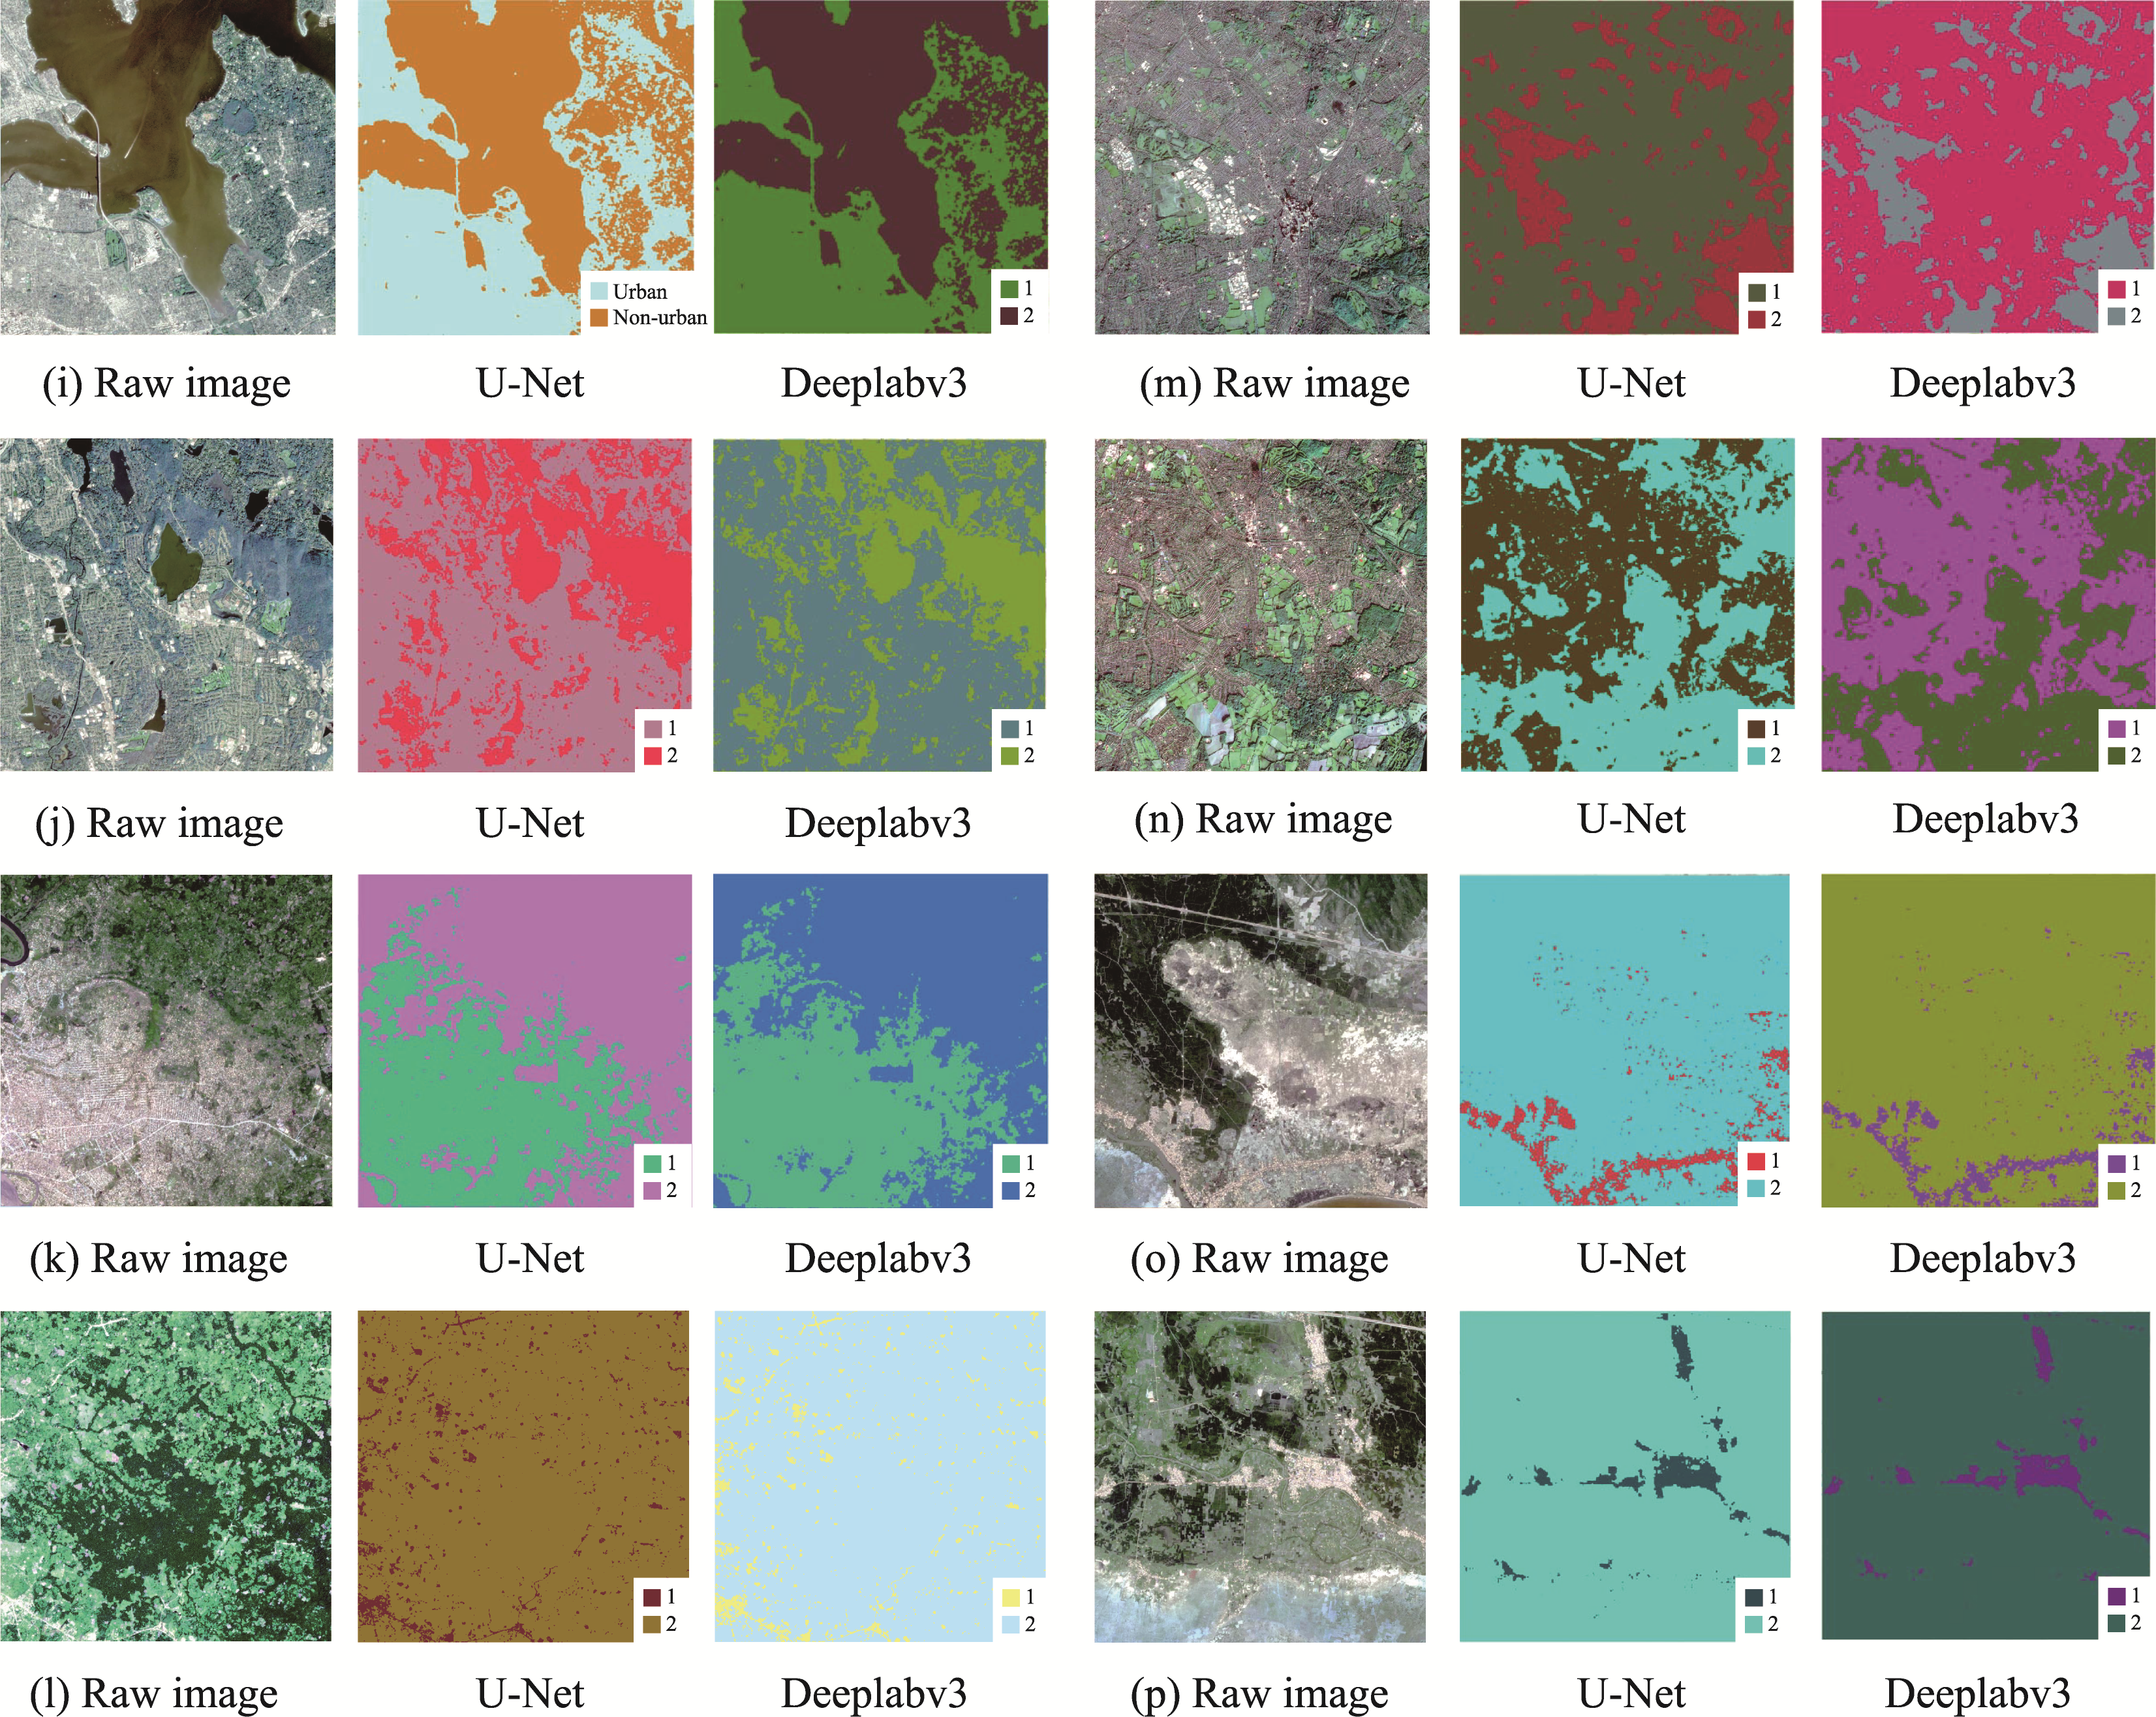
Figure 17
The results of UF extraction based on two deep learning algorithms, are presented for images i through p. Among them, Images i and j are from New York, USA, k and l from Kisangani, Sudan, m and n from London, UK, o and p from Phan Thiet, Vietnam. In the legend, 1 represents urban areas and 2 represents non-urban areas.
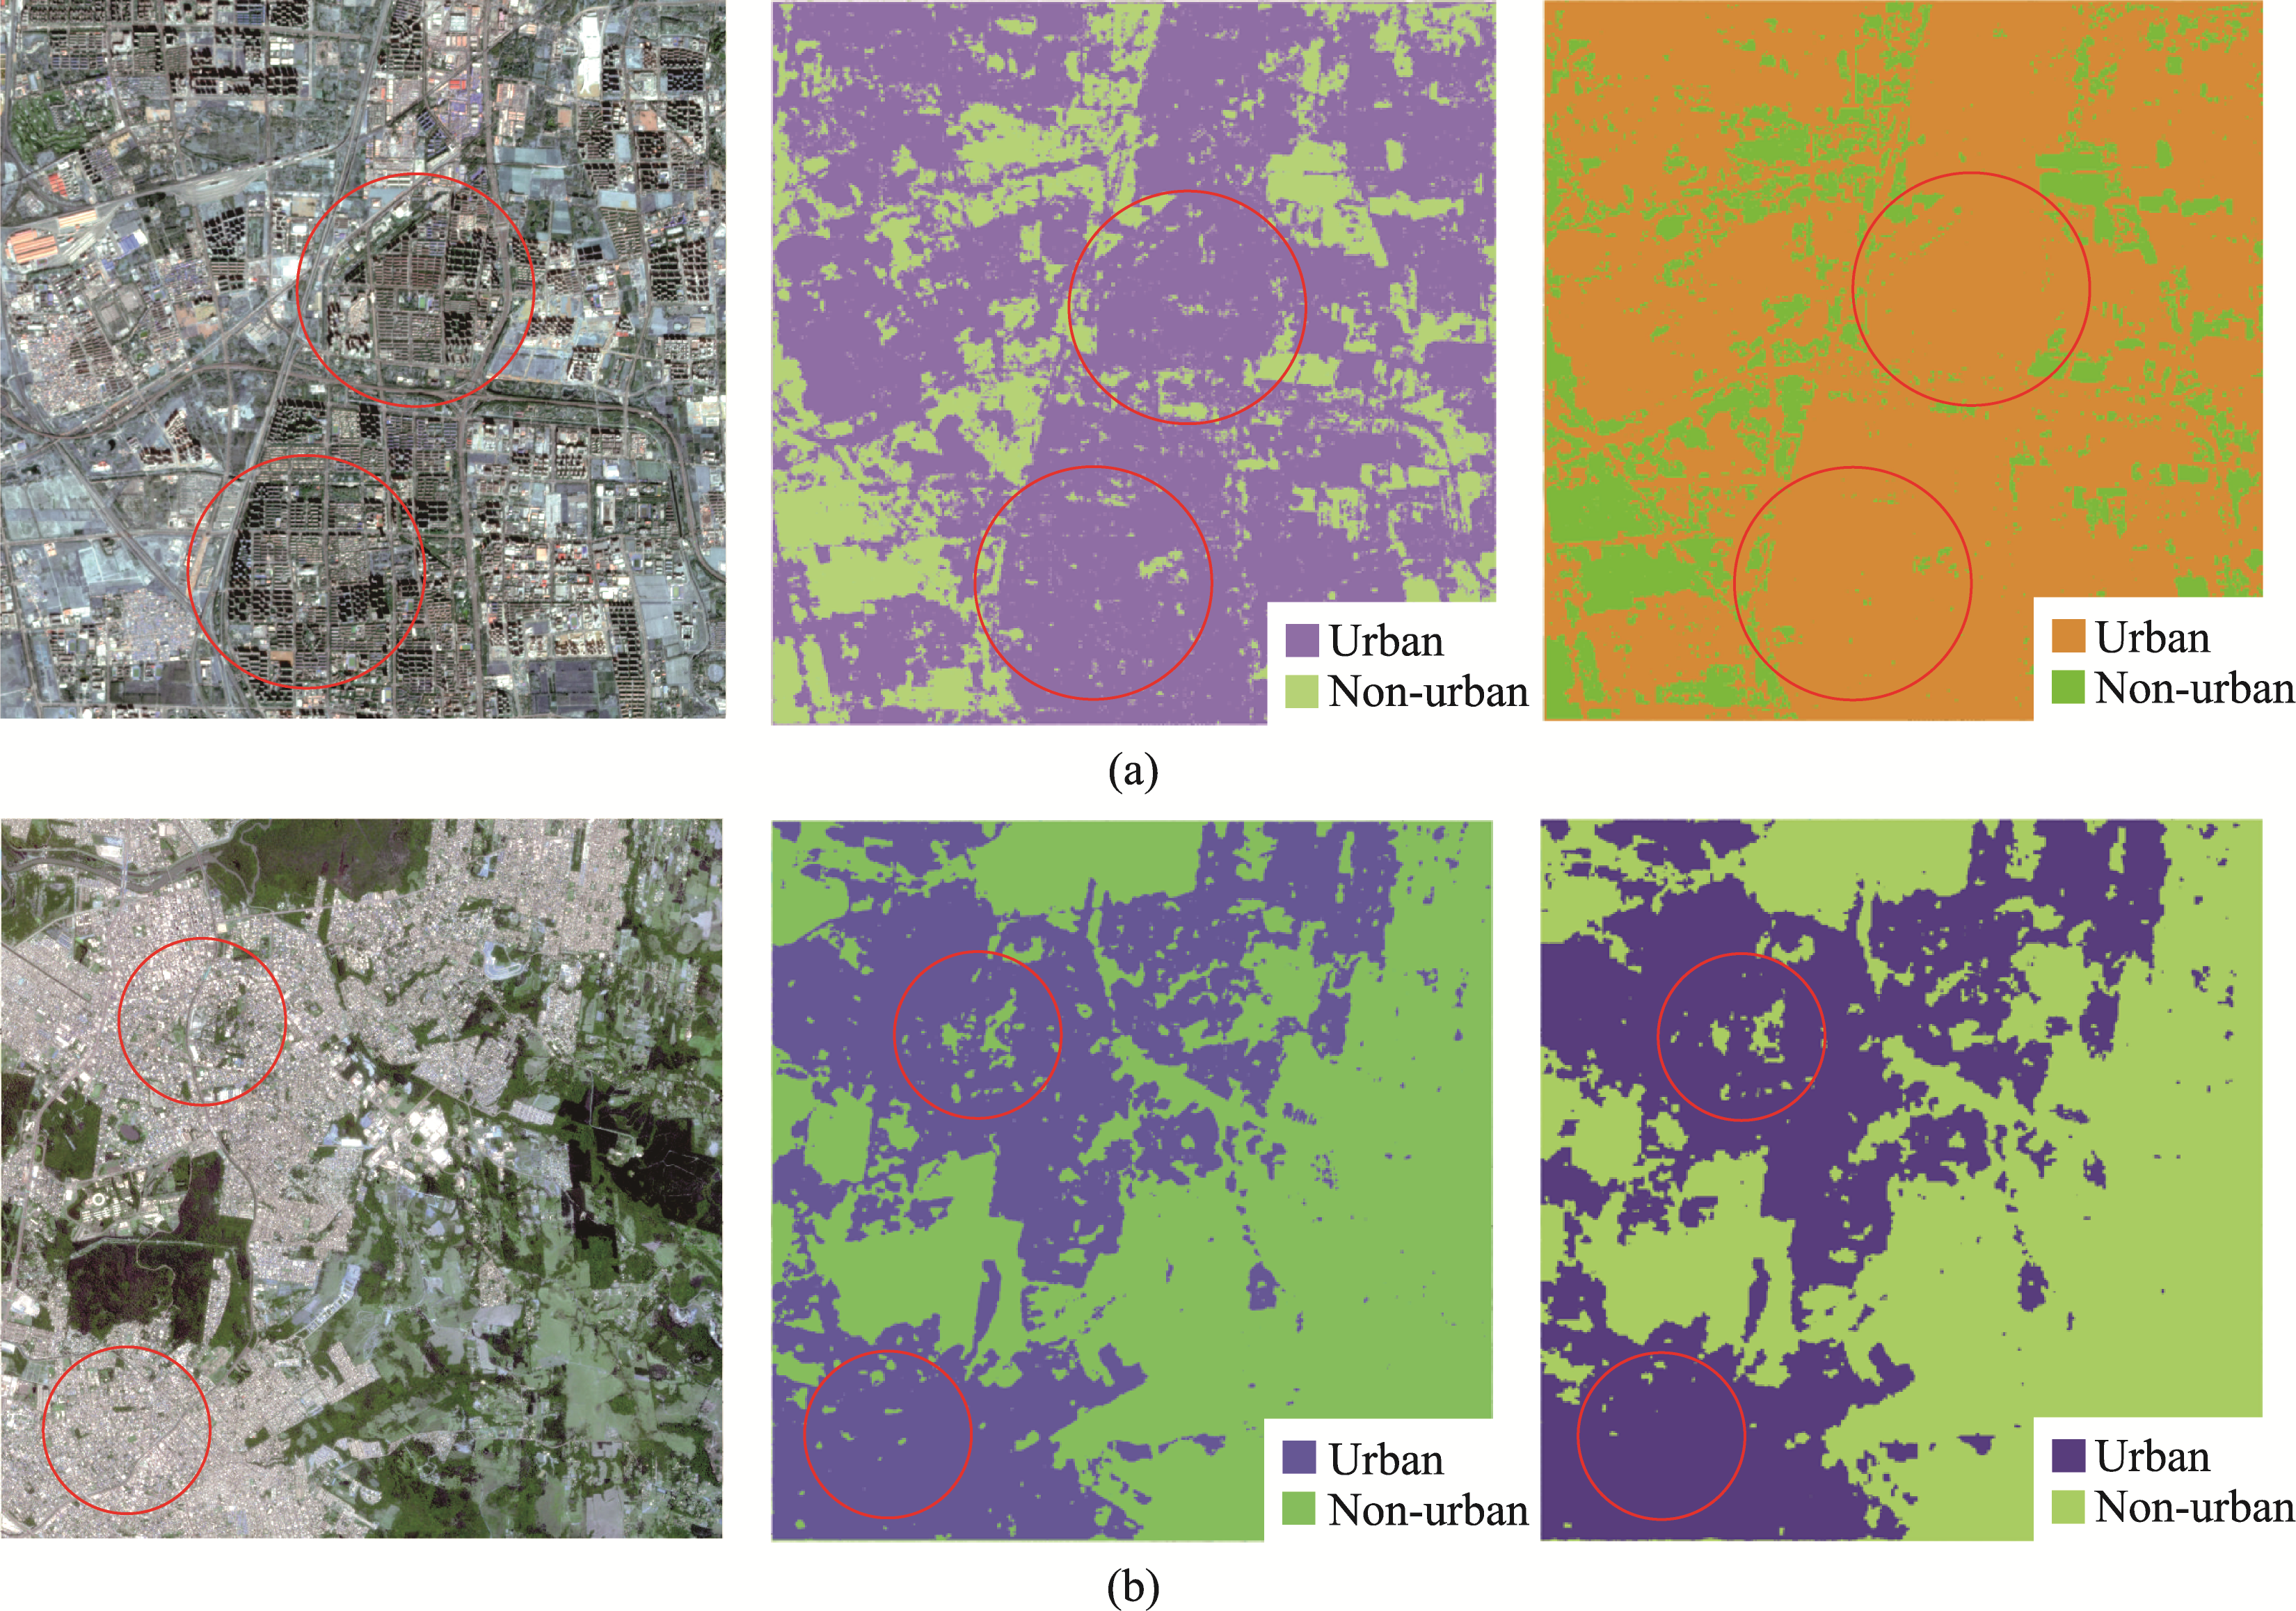
Figure 18
Comparison of UF extraction details between the two deep learning algorithms. Graph a shows that U-Net misclassifies some of the urban shadows, and graph b shows that DeeplabV3 misclassifies some of the smaller inner-city public green spaces. The circle represents the misjudged area.
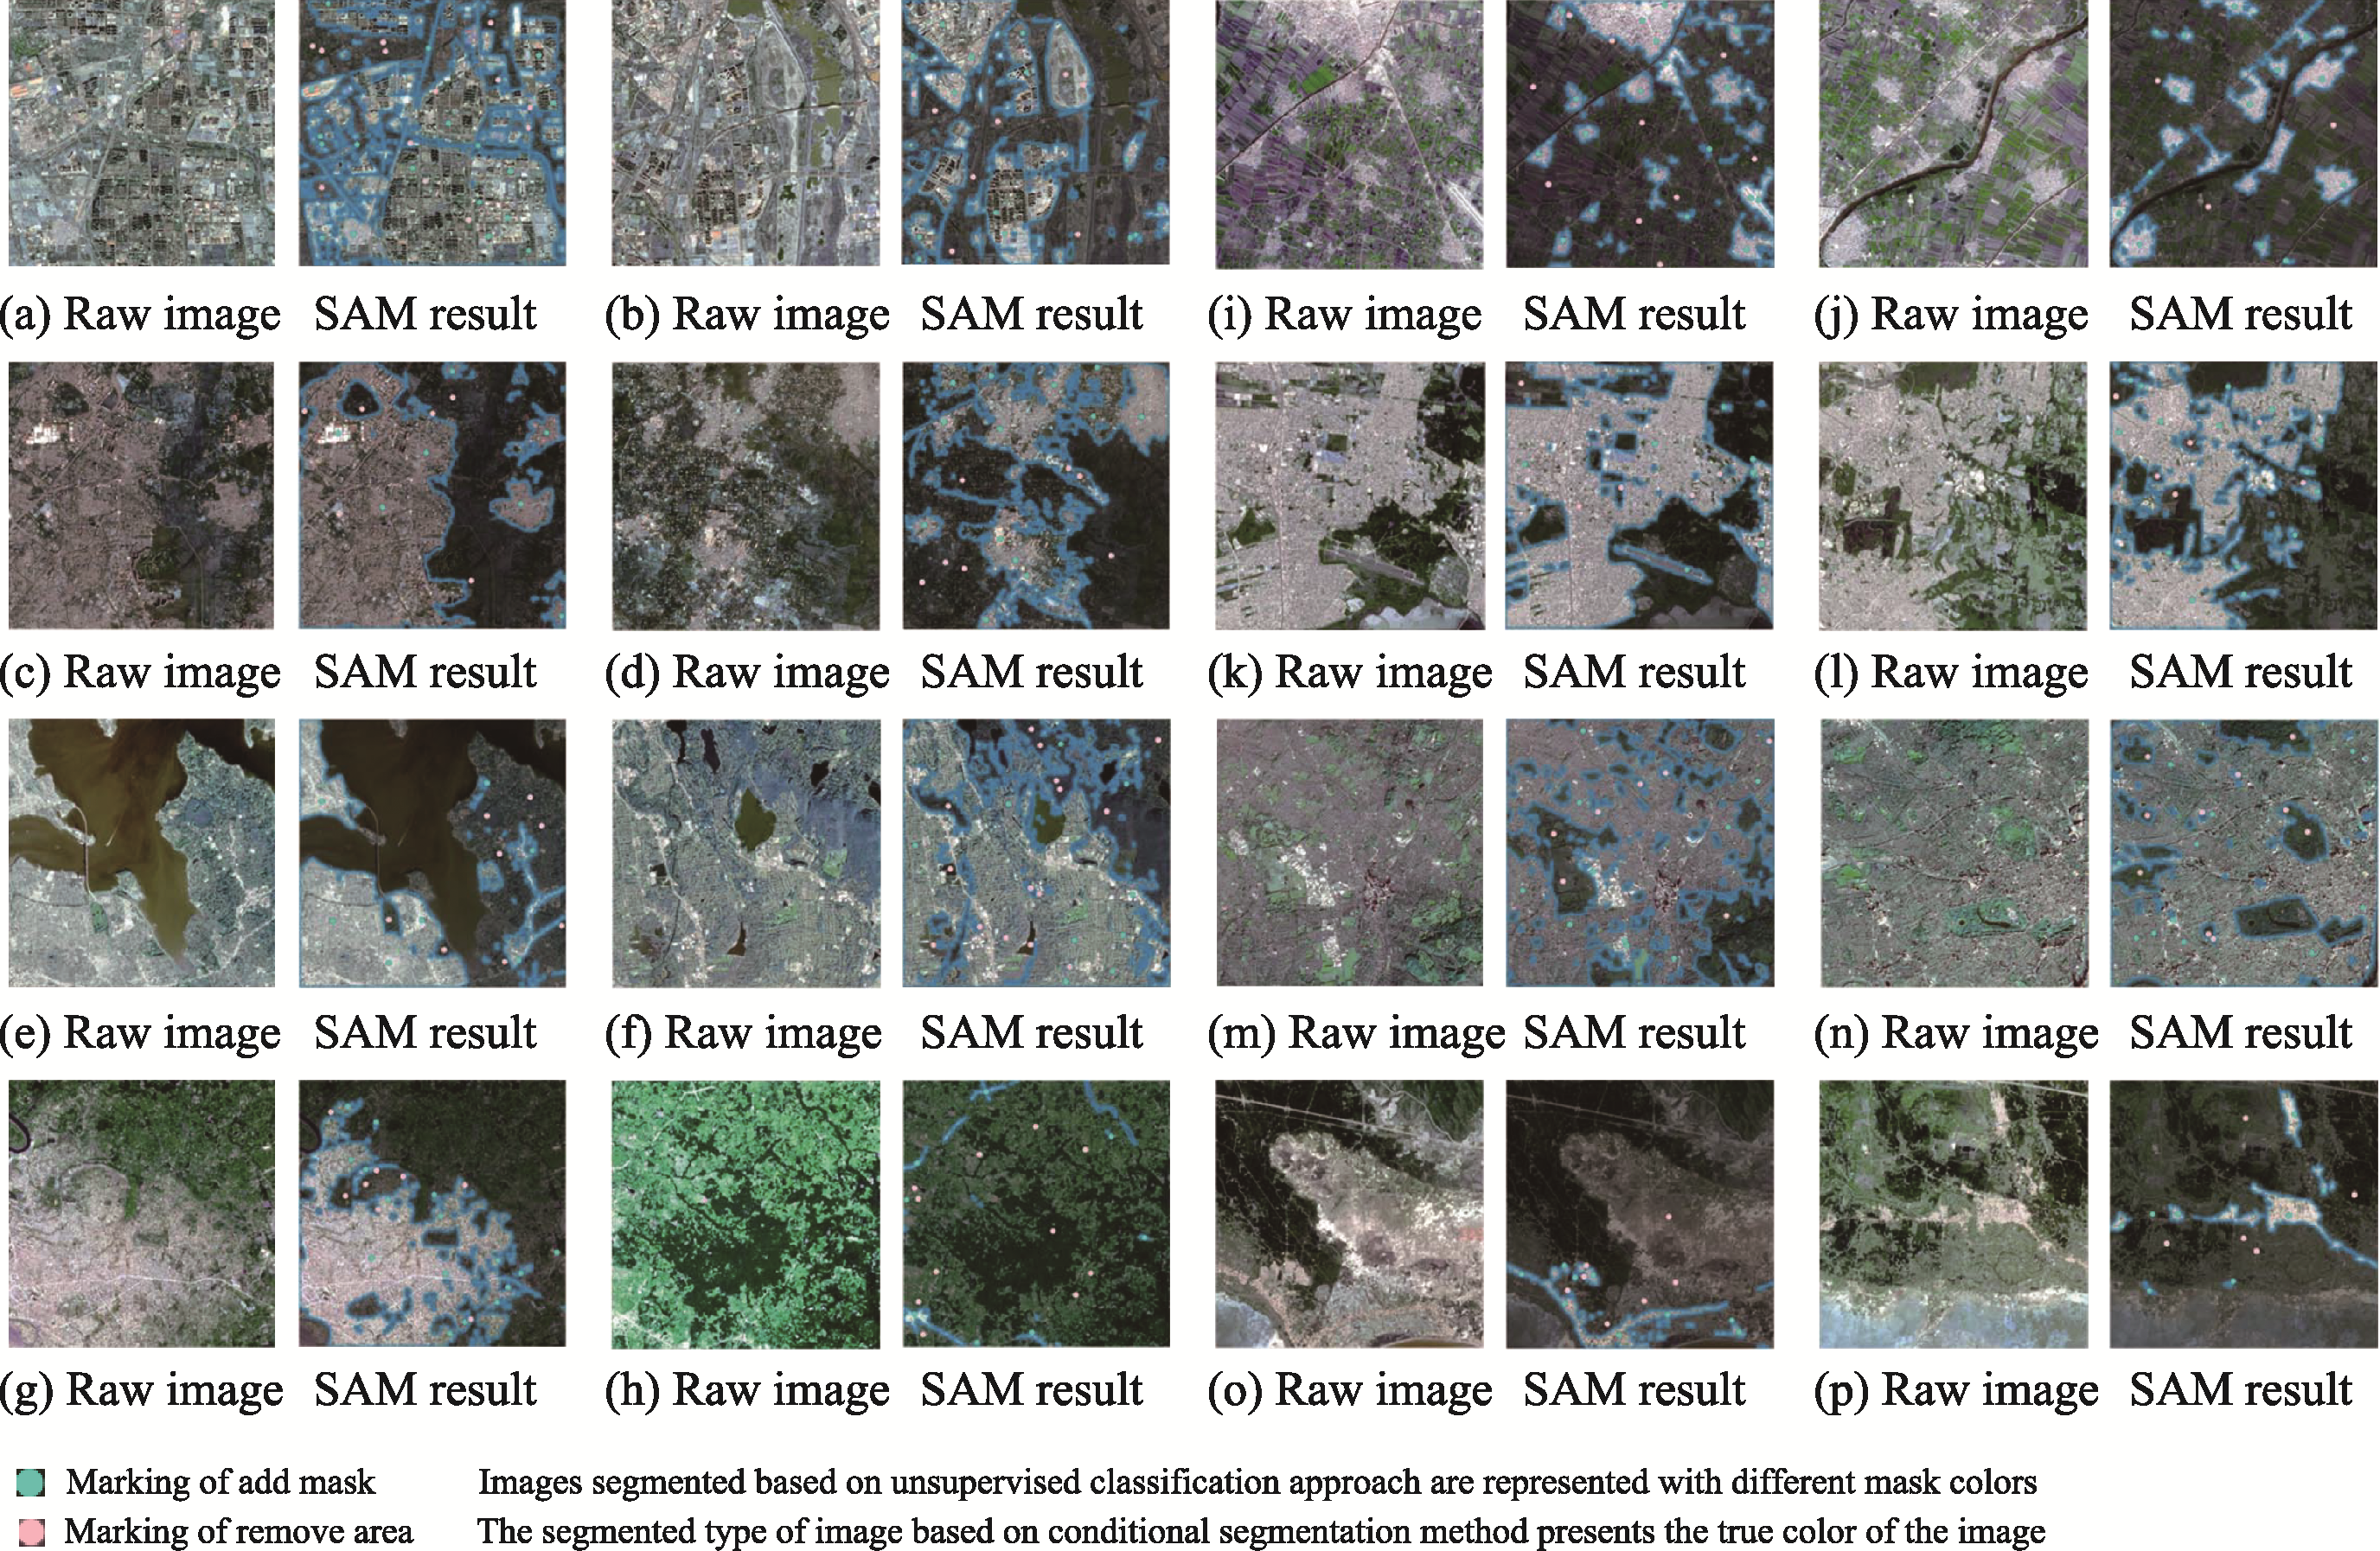
Figure 19
SAM-based UF extraction result diagrams, the extracted urban areas show the original colour that distinguishes them from non-urban areas, with a blue border distinguishing the two types of environments. Among them, Images a and b are from Beijing, China, c and d are from New Delhi, India, e and f are from Mansouria, Egypt, and g and h are from Porto Alegre, Brazil. In the legend, i and j from New York, USA, k and l from Kisangani, Sudan, m and n from London, UK, o and p from Phan Thiet, Vietnam.
Table 3
A detailed comparative analysis of the different segmentation methods