×
模态框(Modal)标题
在这里添加一些文本
关闭
关闭
提交更改
取消
确定并提交
×
模态框(Modal)标题
×
期刊
文章
图表
检索
EN
中文
首页
关于期刊
期刊介绍
数据库收录
期刊荣誉
编委会
投稿指南
在线期刊
当期目录
优先出版
过刊浏览
推荐文章
专题
按栏目浏览
阅读排行
下载排行
引用排行
E-mail Alert
RSS
期刊订阅
广告合作
联系我们
EN
中文
图/表 详细信息
Mapping cropping patterns in the North China Plain over the past 300 years and an analysis of the drivers of change
LI Shicheng, LIU Yating, LI Jianrui, ZHANG Xuezhen
地理学报(英文版), 2024, 34(
10
): 2074-2088. DOI:
10.1007/s11442-024-2283-2
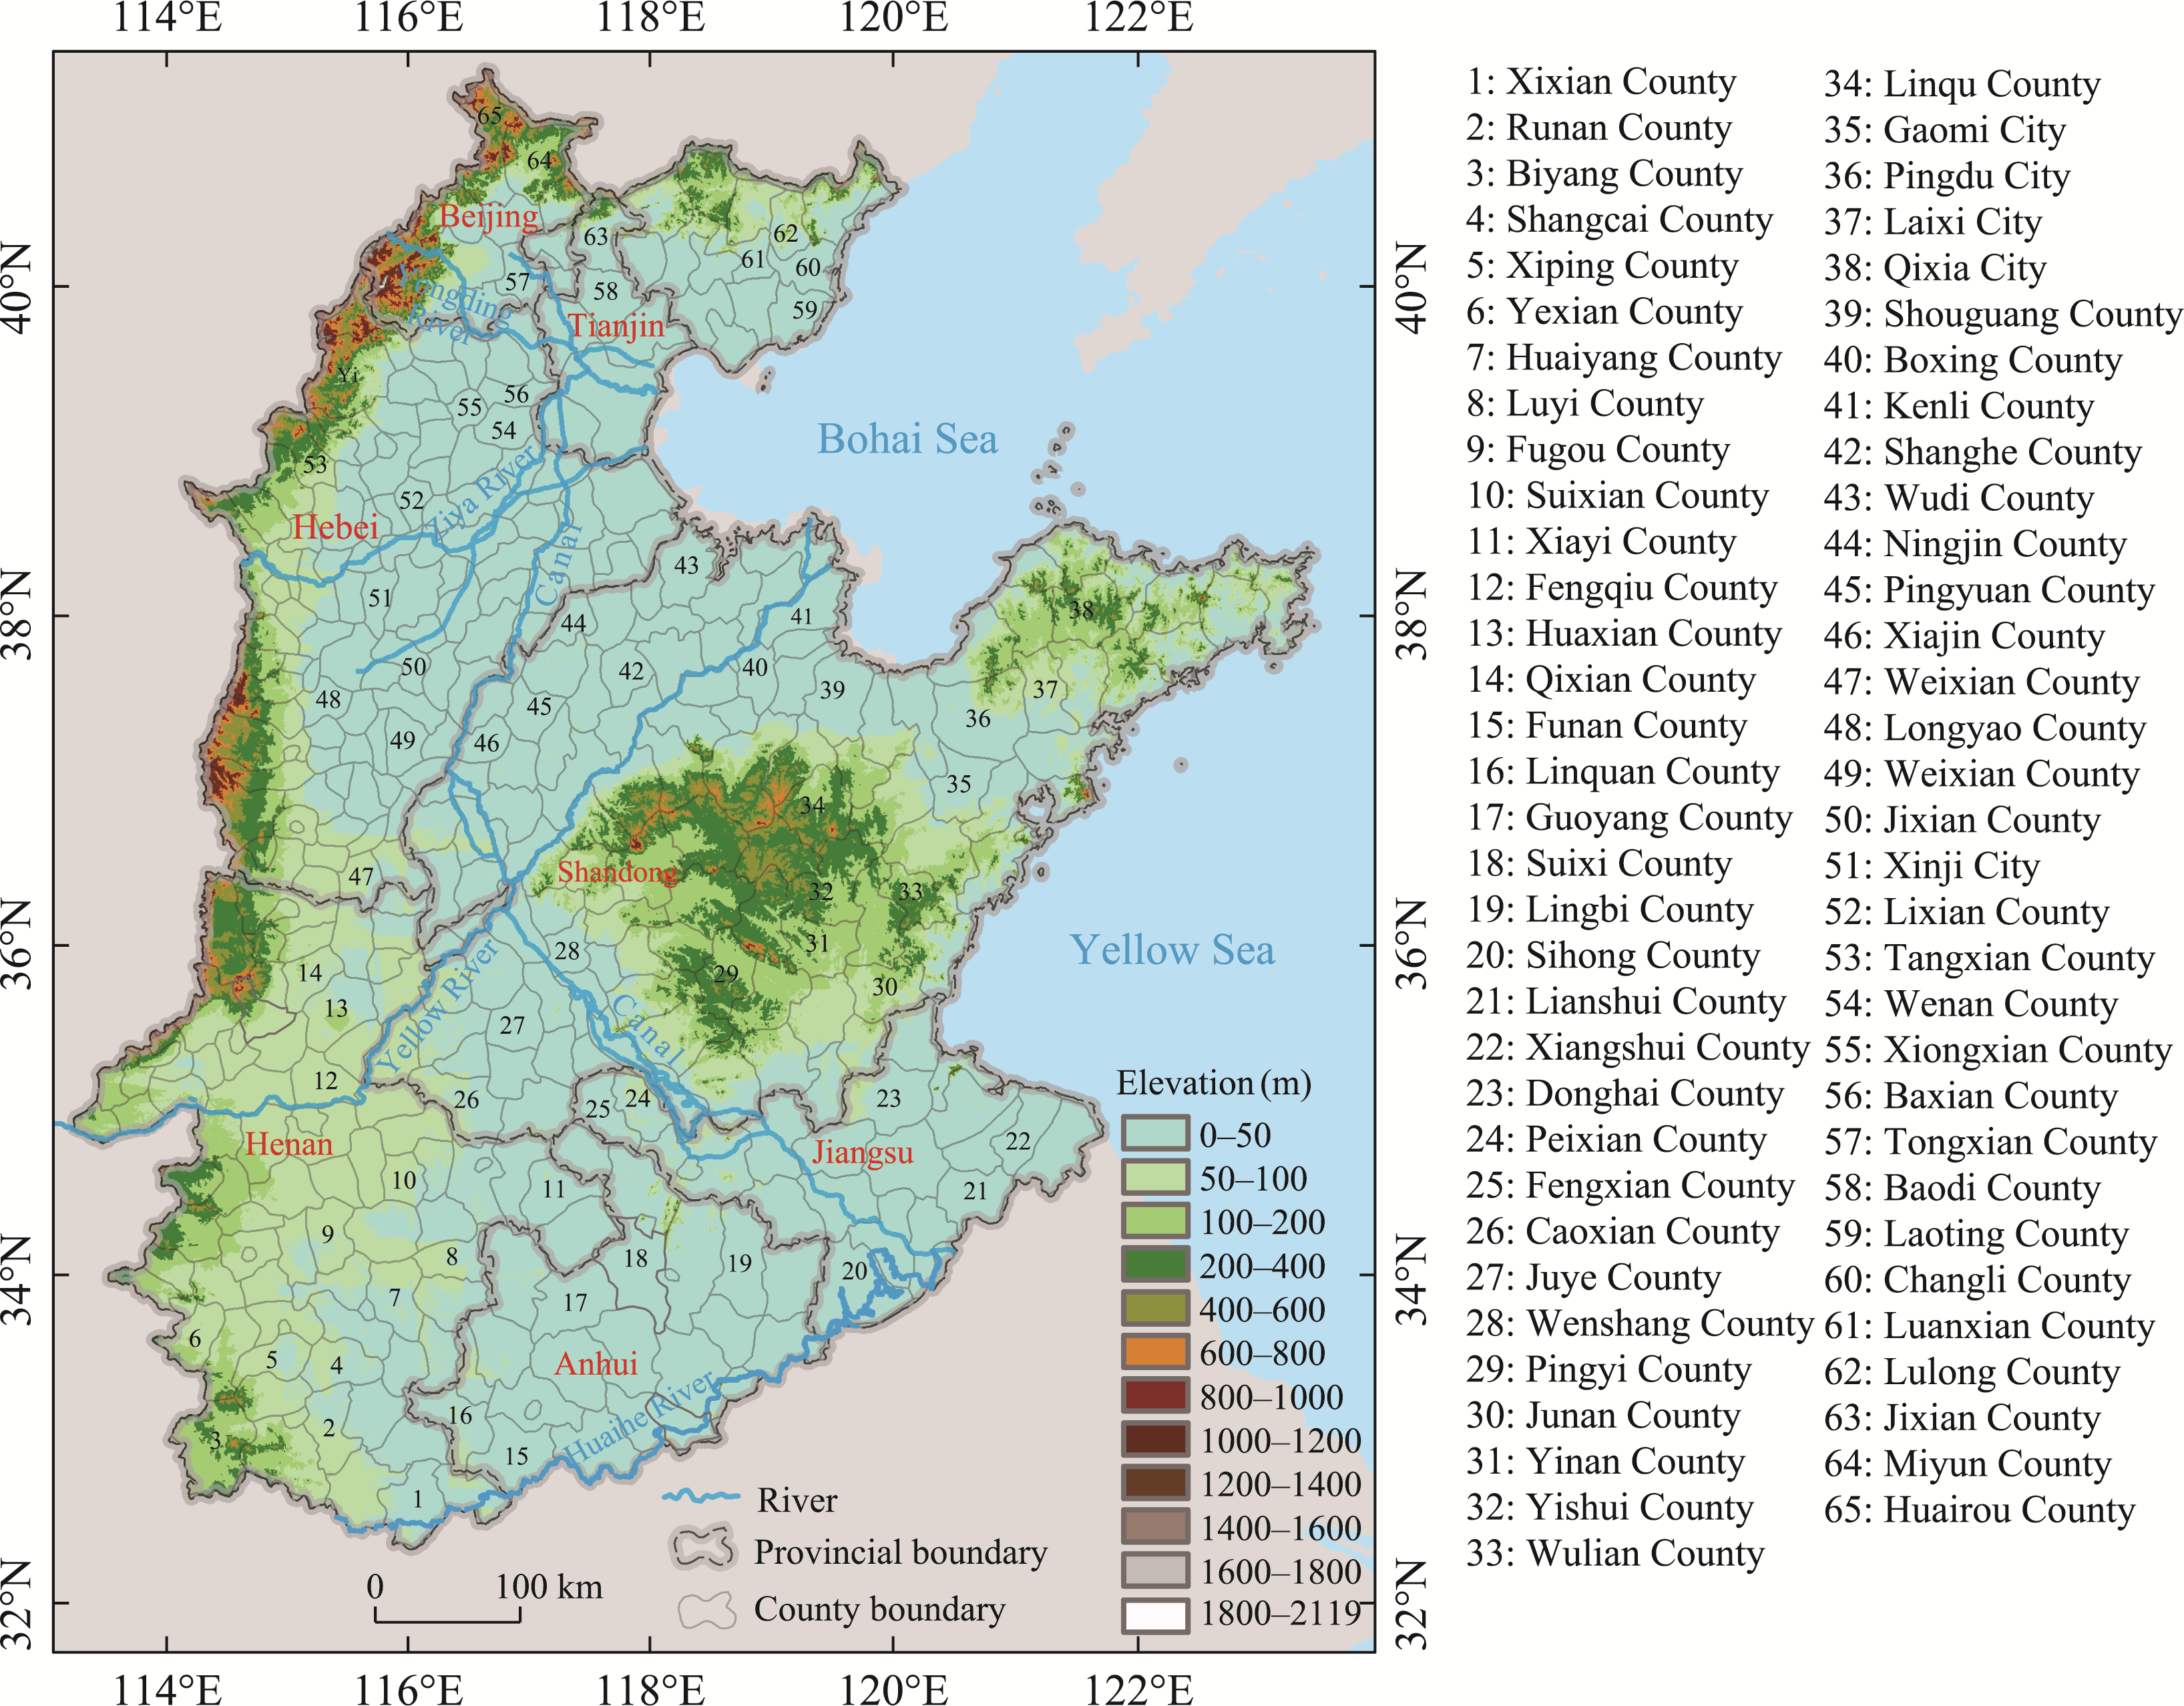
Figure 1
Location of the North China Plain, China
本文的其它图/表
Table 1
Data sources for the analysis of the drivers of the change in cropping patterns
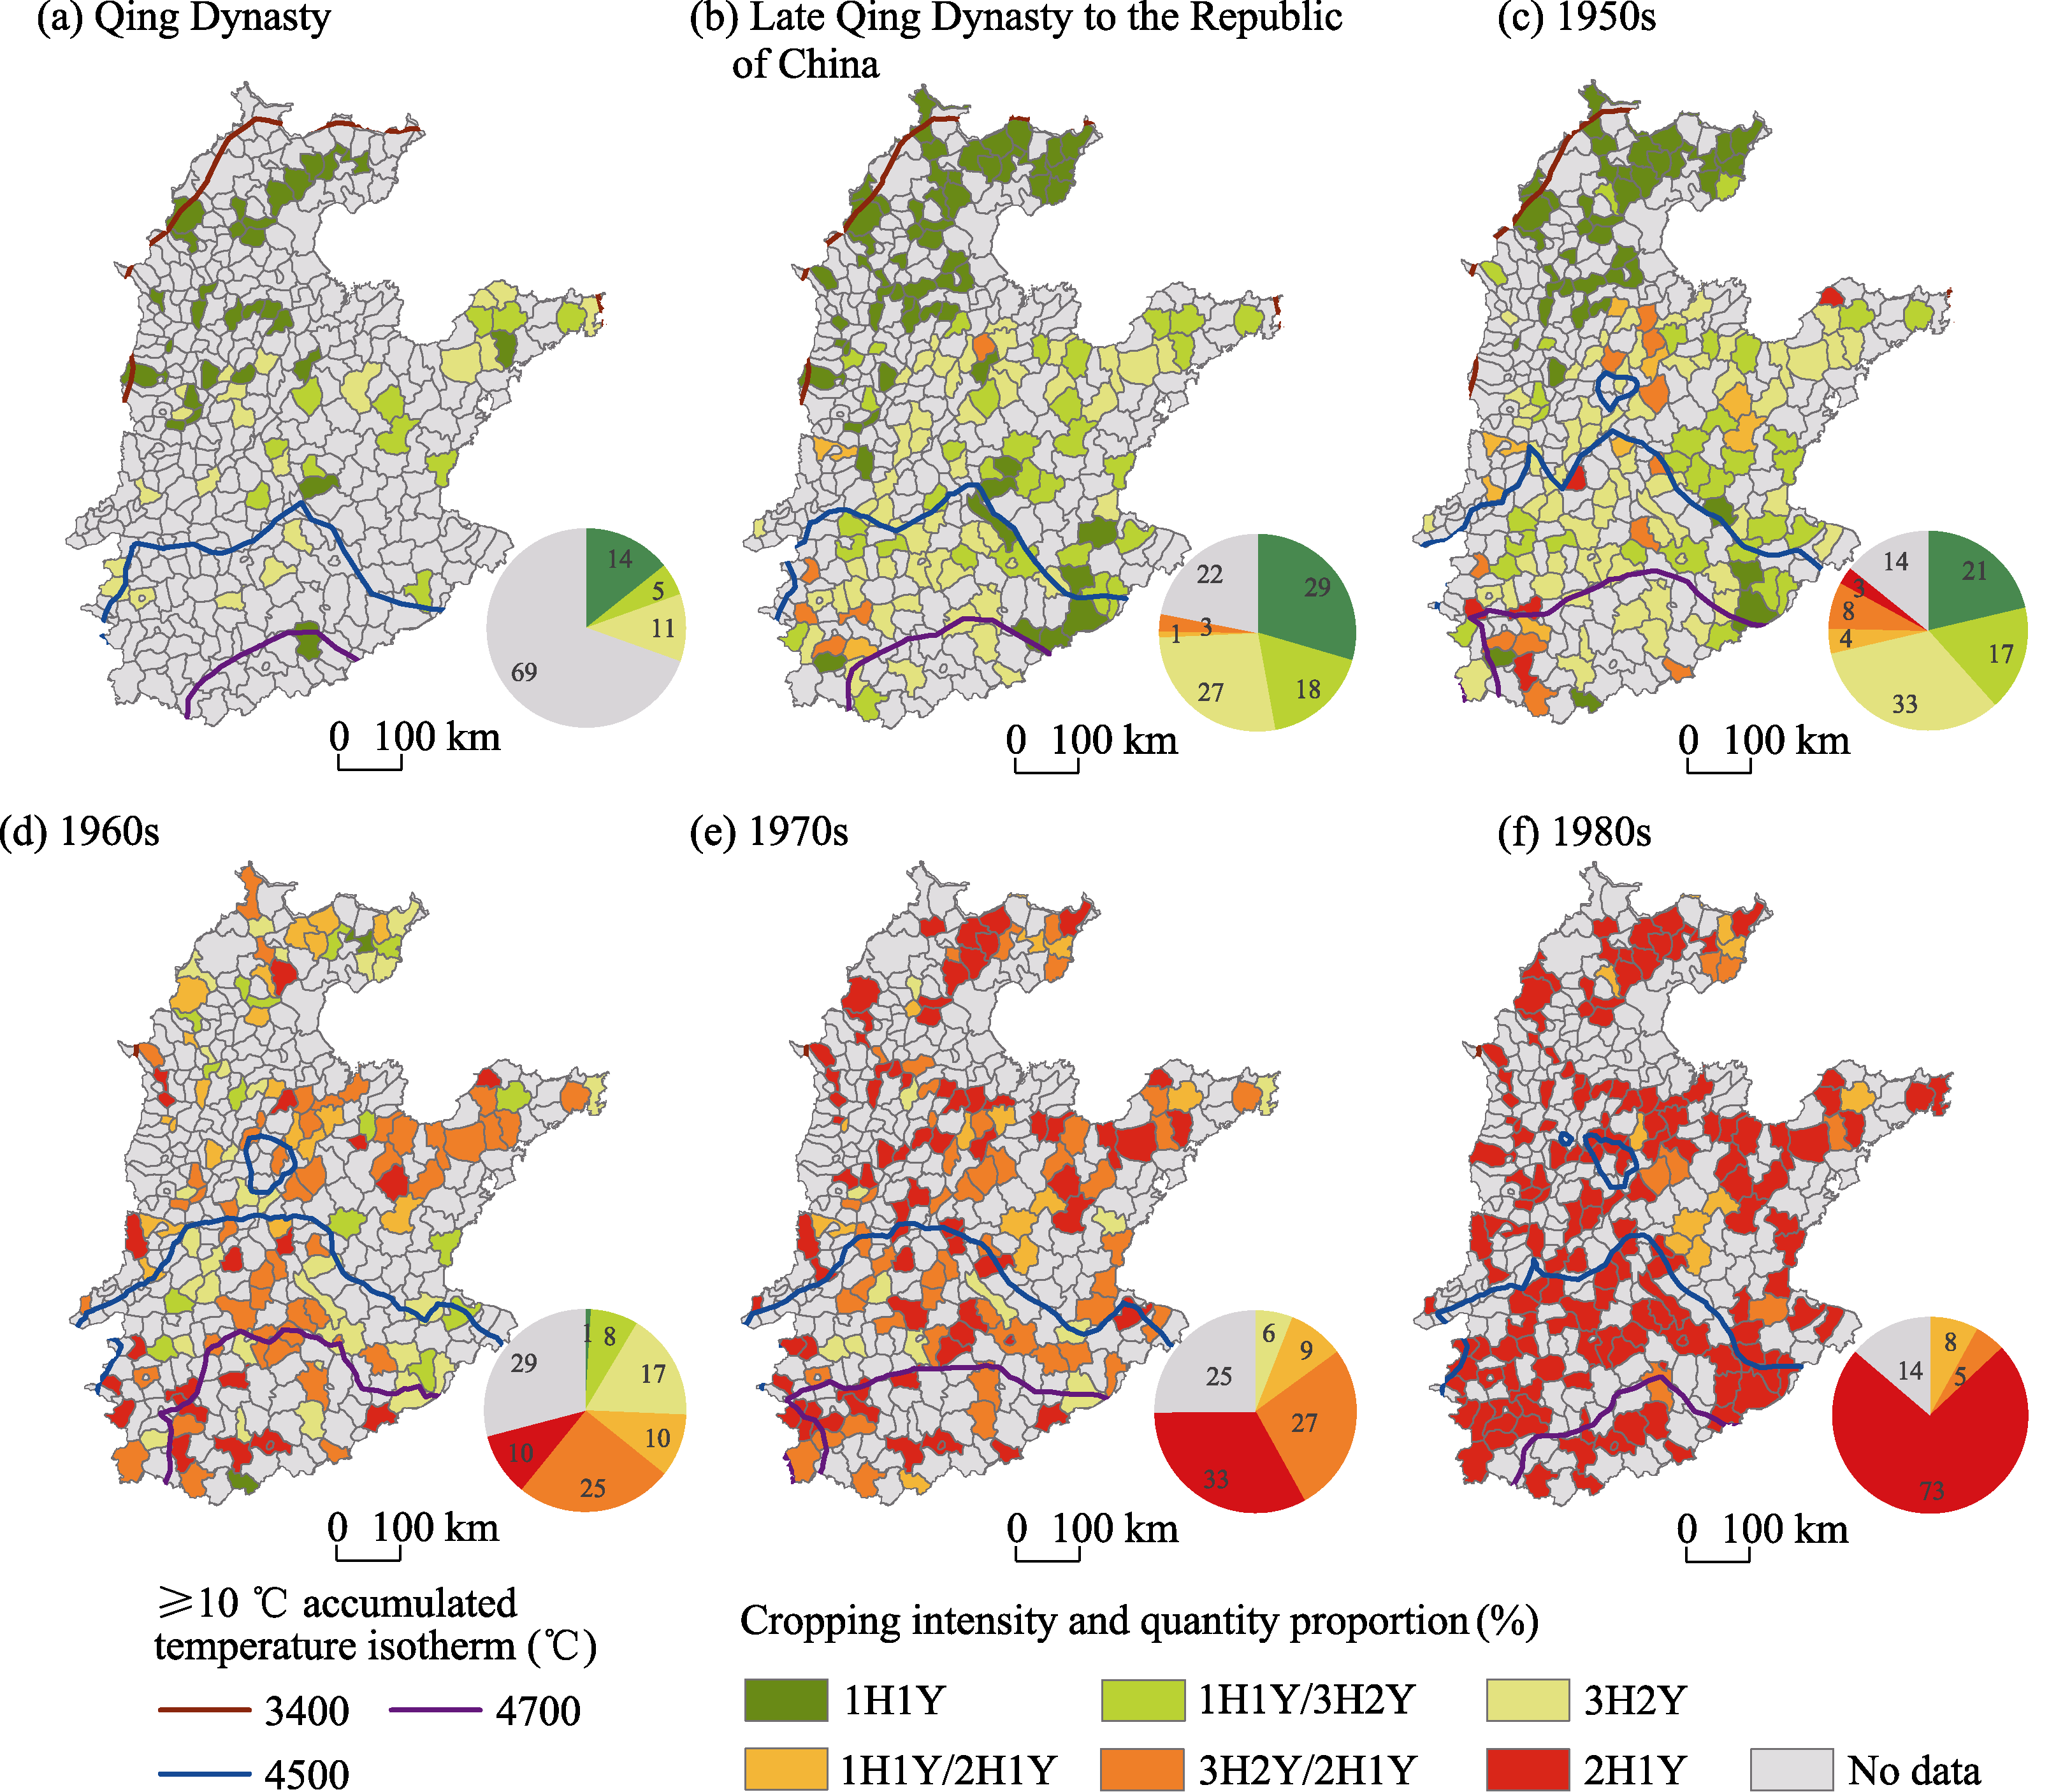
Figure 2
Spatial distribution and proportion of each cropping intensity in the North China Plain for six sub-periods (a−f) since the Qing Dynasty and the accumulated temperature. 1H1Y = one harvest per year, 3H2Y = three harvests in two years, 2H1Y = two harvests per year.
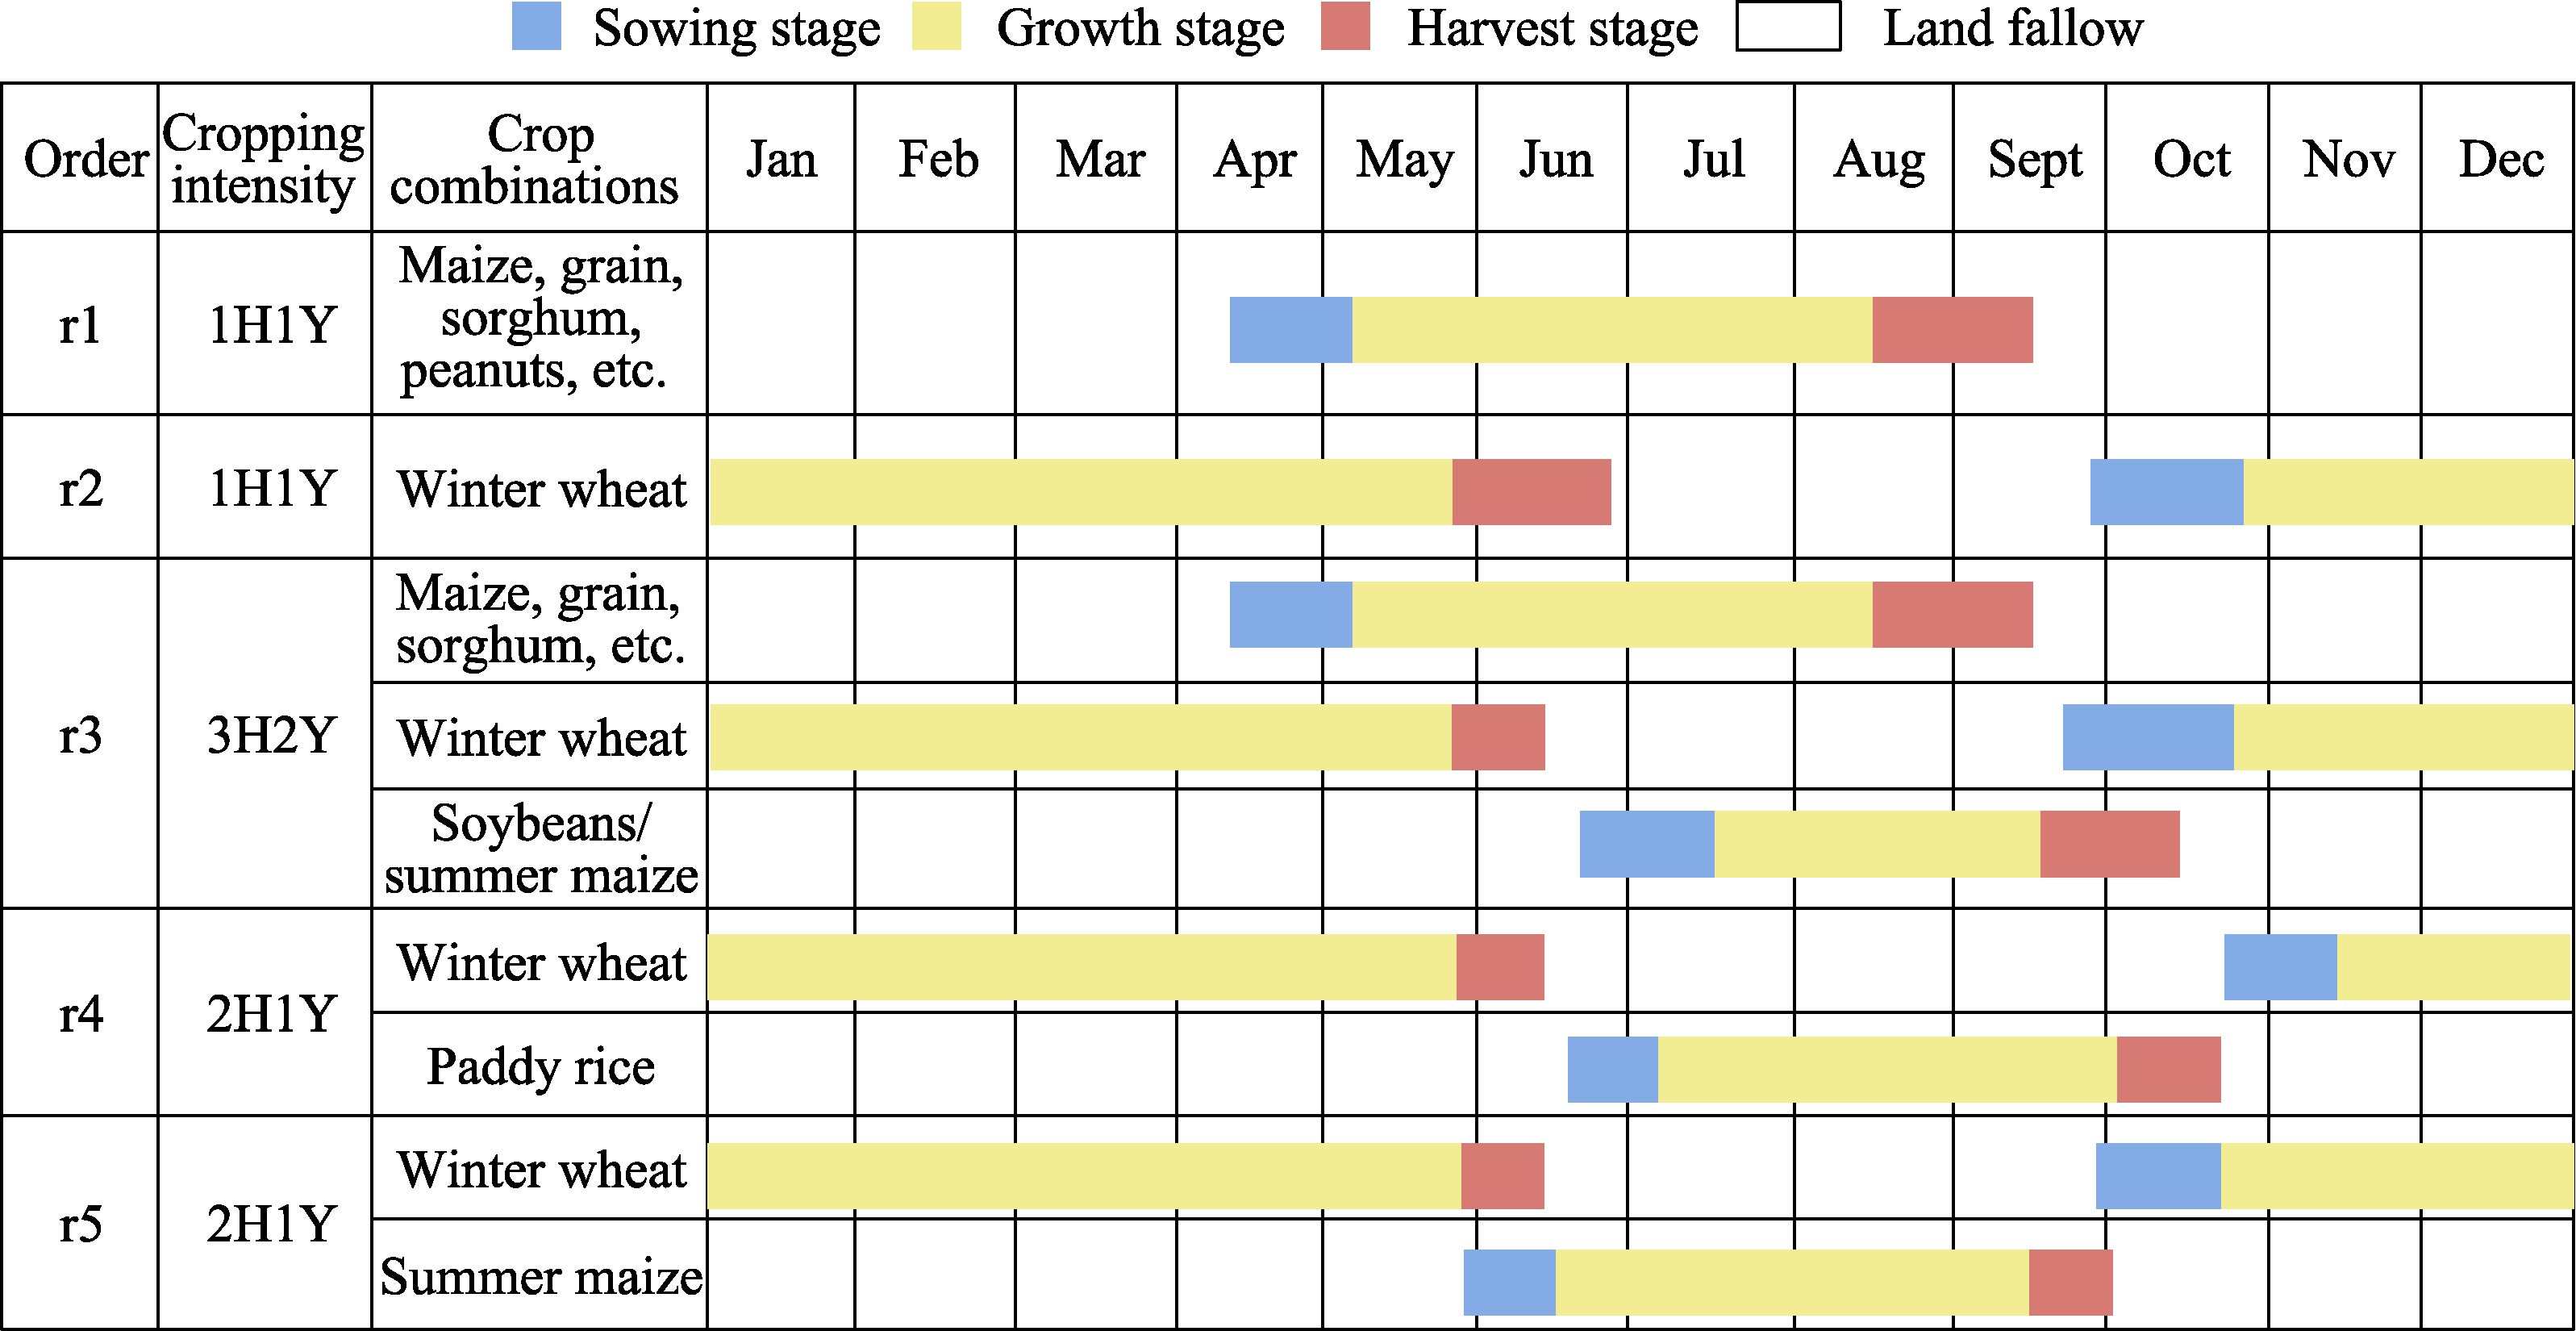
Figure 3
Crop combinations for each crop intensity in the North China Plain. The definitions of 1H1Y, 3H2Y, and 2H1Y are provided in the caption of
Figure 2
.
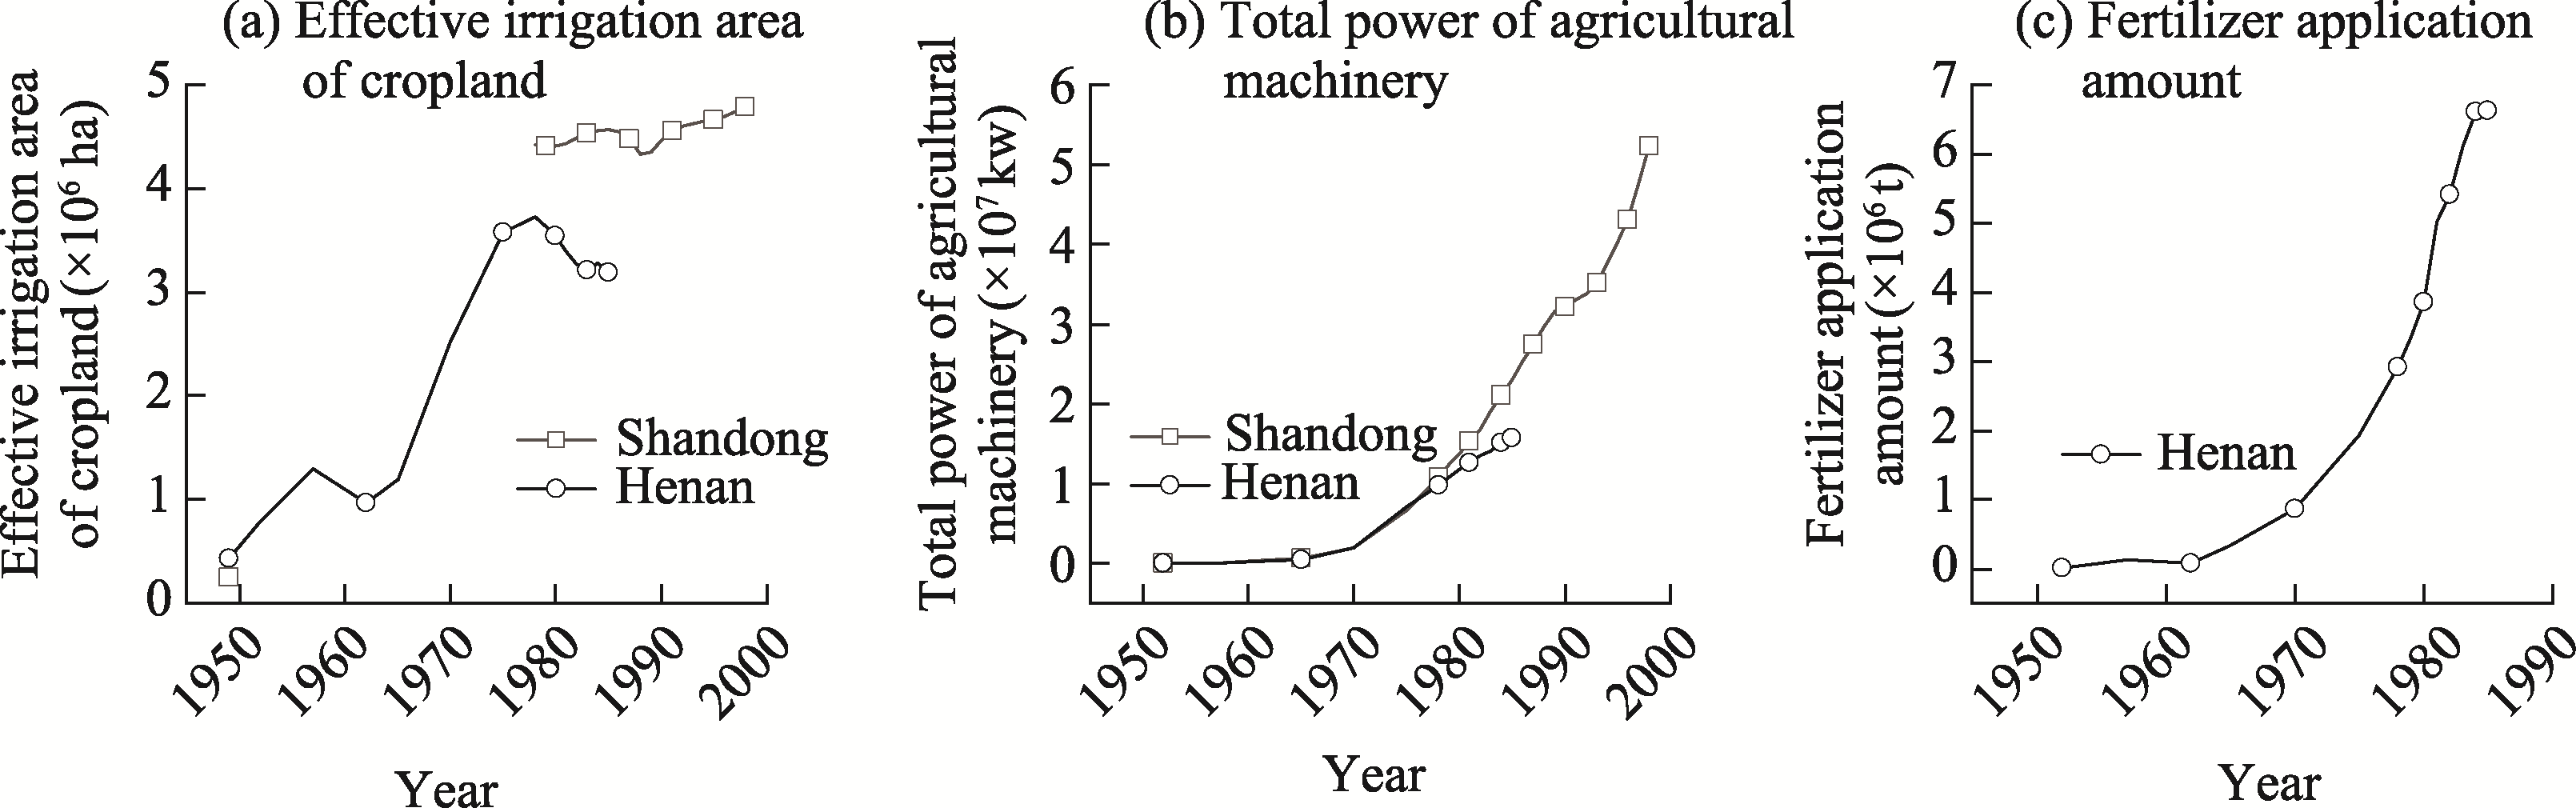
Figure 4
Changes in agricultural production conditions on the NCP since 1949