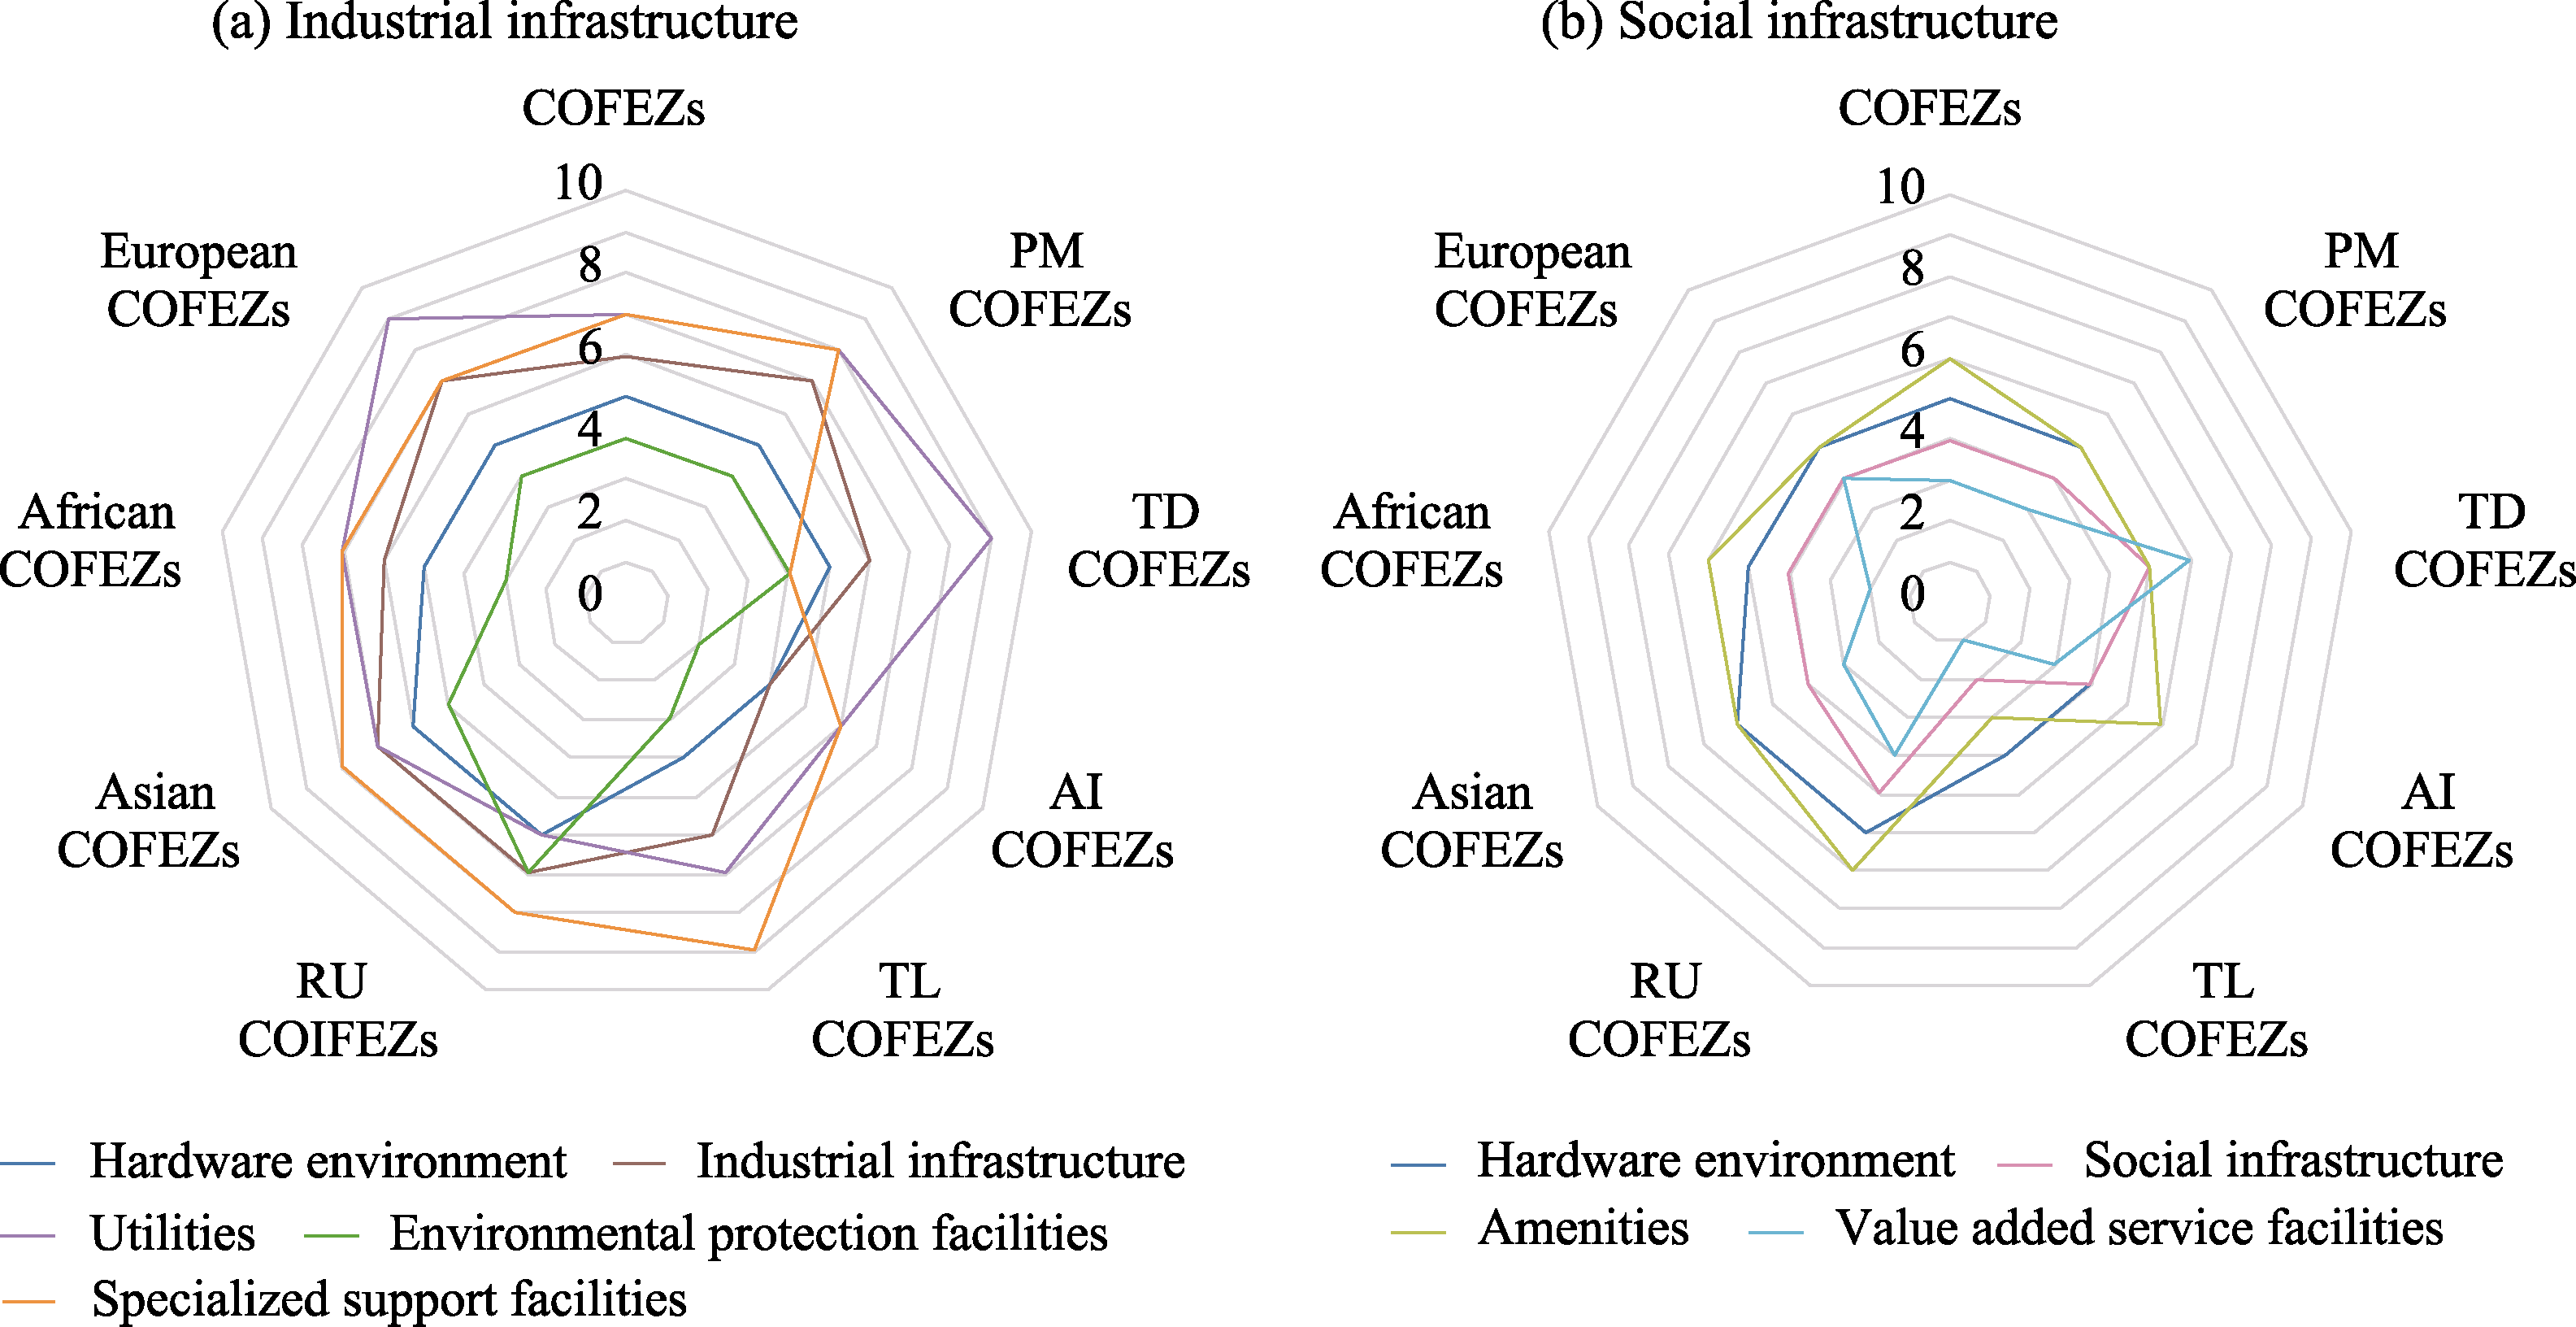
| Level of investment facilitation | Processing and manufacturing COFEZs | Technology development COFEZs | Agro-industrial COFEZs | Trade and logistics COFEZs | Resource utilization COFEZs | Asian COFEZs | African COFEZs | European COFEZs |
|---|---|---|---|---|---|---|---|---|
| Mean value | 0.488 | 0.468 | 0.322 | 0.308 | 0.419 | 0.445 | 0.426 | 0.479 |
| Standard deviation | 0.175 | 0.03 | 0.118 | 0.033 | 0.112 | 0.147 | 0.189 | 0.174 |