×
模态框(Modal)标题
在这里添加一些文本
关闭
关闭
提交更改
取消
确定并提交
×
模态框(Modal)标题
×
期刊
文章
图表
检索
EN
中文
首页
关于期刊
期刊介绍
数据库收录
期刊荣誉
编委会
投稿指南
在线期刊
当期目录
优先出版
过刊浏览
推荐文章
专题
按栏目浏览
阅读排行
下载排行
引用排行
E-mail Alert
RSS
期刊订阅
广告合作
联系我们
EN
中文
图/表 详细信息
Incorporation of intra-city human mobility into urban growth simulation: A case study in Beijing
WANG Siying, FEI Teng, LI Weifeng, ZHANG Anqi, GUO Huagui, DU Yunyan
地理学报(英文版), 2022, 32(
5
): 892-912. DOI:
10.1007/s11442-022-1977-6
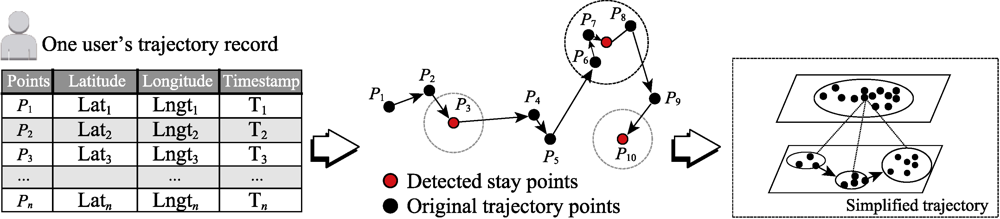
Figure 2
Illustration of the stay point detection process
本文的其它图/表
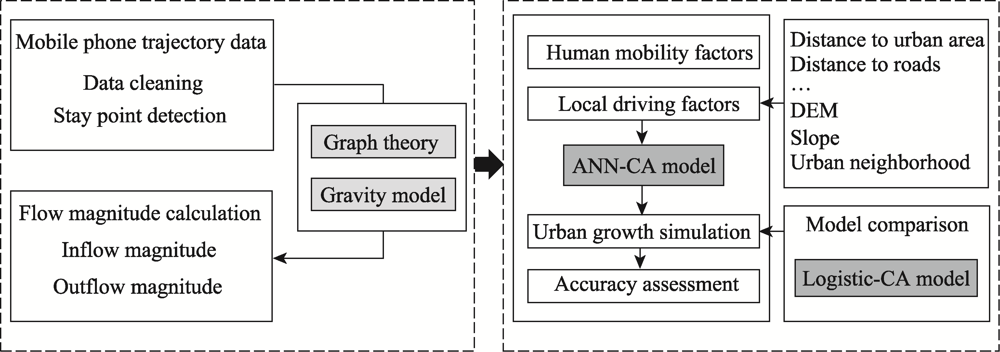
Figure 1
The framework of the ANN-CA model in the integration of human mobility factors
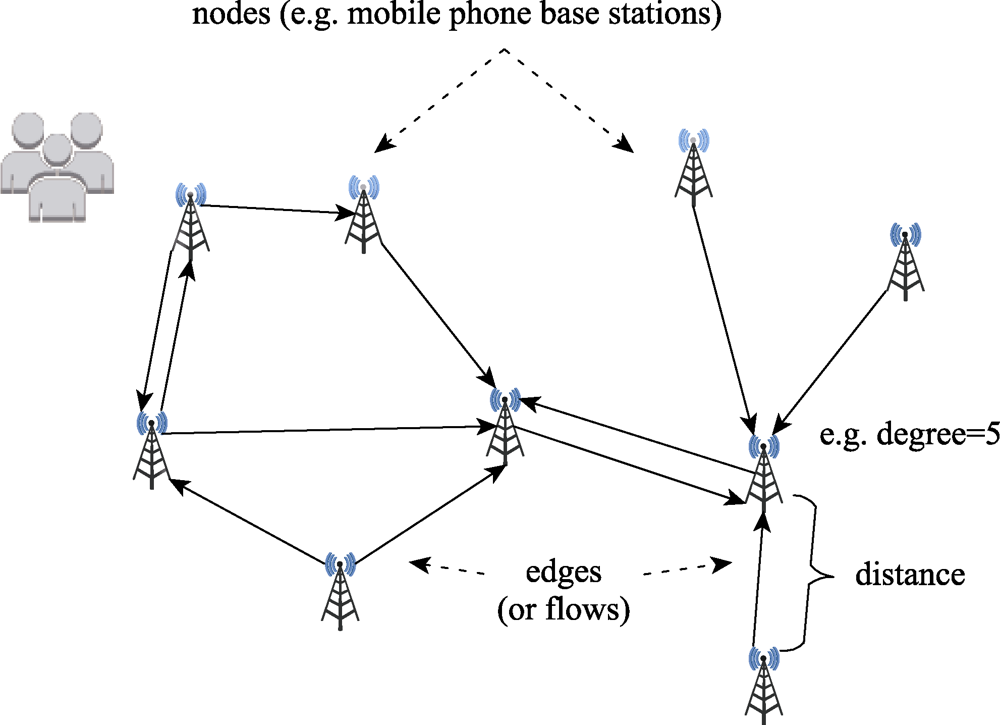
Figure 3
An example of a directed graph formed by human trajectories
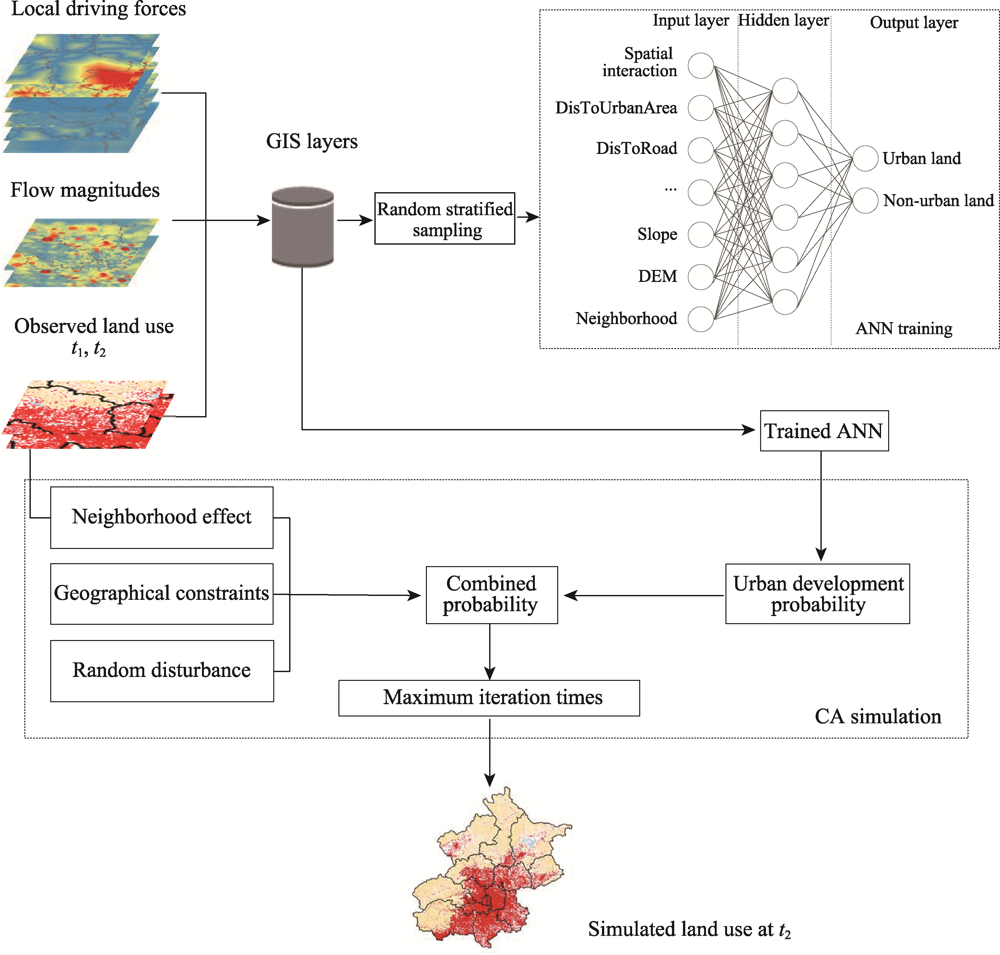
Figure 4
The architecture of the ANN-CA model
Figure 5
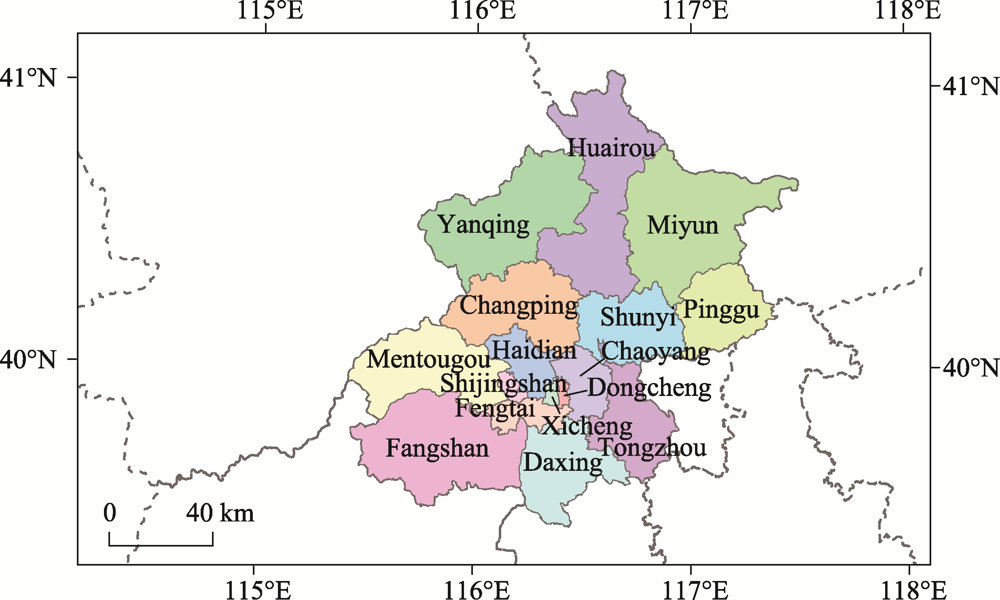
Administration divisions of Beijing
Table 1
Model inputs and their data source
Figure 6
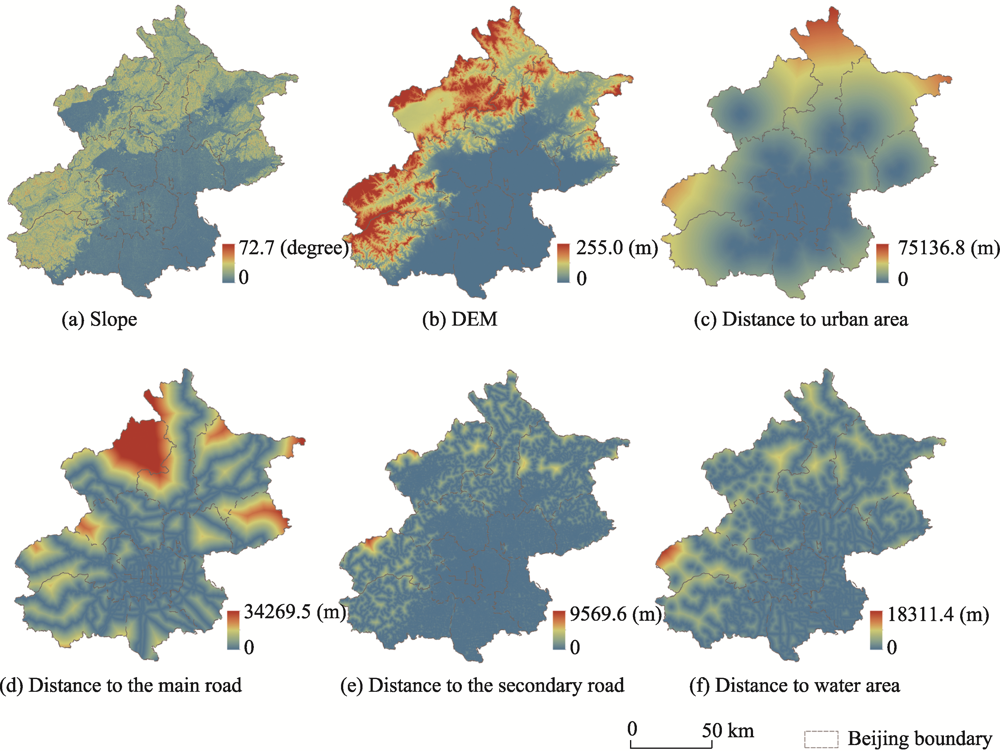
The spatial variables in Beijing (a) slope, (b) DEM, (c) distance to urban area, (d) distance to the main road, (e) distance to the secondary road, and (f) distance to water area
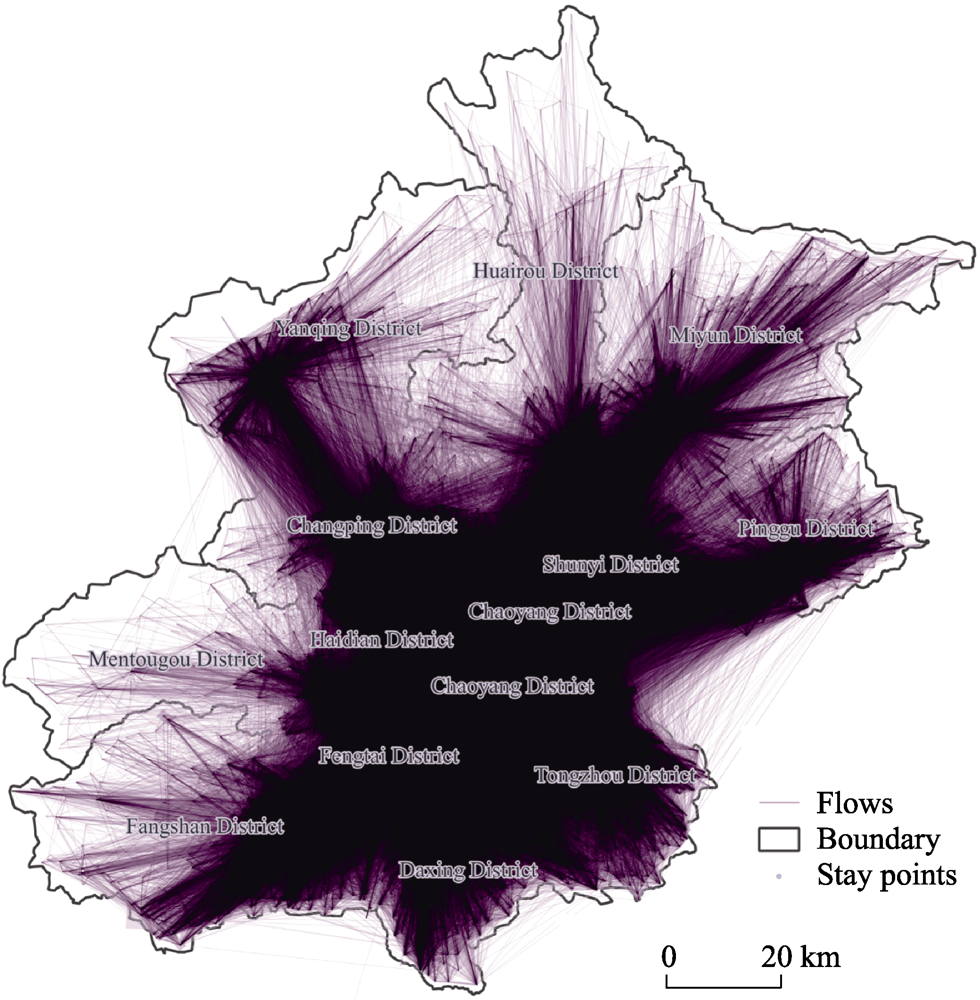
Figure 7
The flow map of trajectory data in Beijing
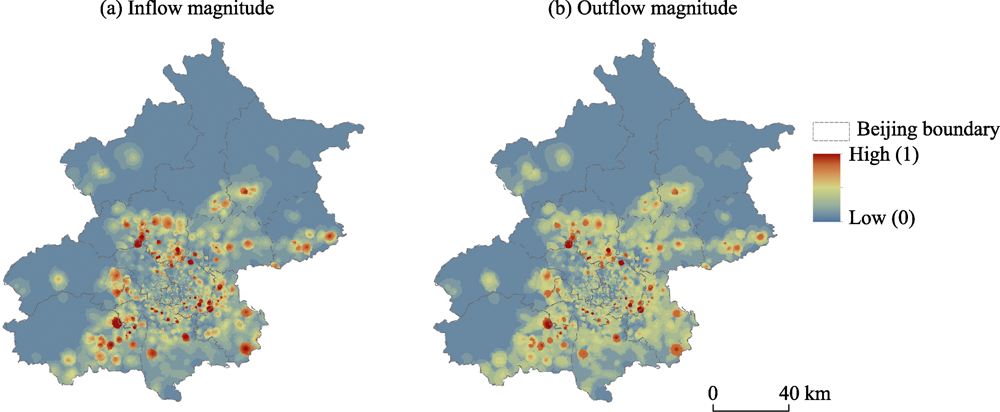
Figure 8
The inflow magnitude distribution (a) and the outflow magnitude distribution (b) of Beijing
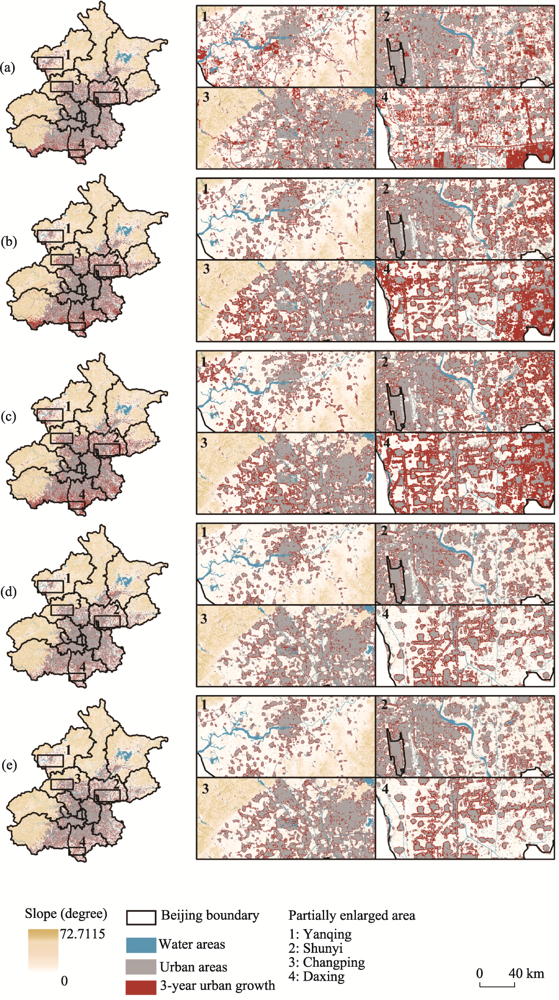
Figure 9
The observed urban growth from 2013 to 2016 in Beijing (a) and the simulated pattern in 2016 based on the four proposed models: (b) ANN-CA
withflow
, (c) ANN-CA
withoutflow
, (d) Logistic-CA
withflow
, and (e) Logistic-CA
withoutflow
Table 2
Assessment of the simulation results
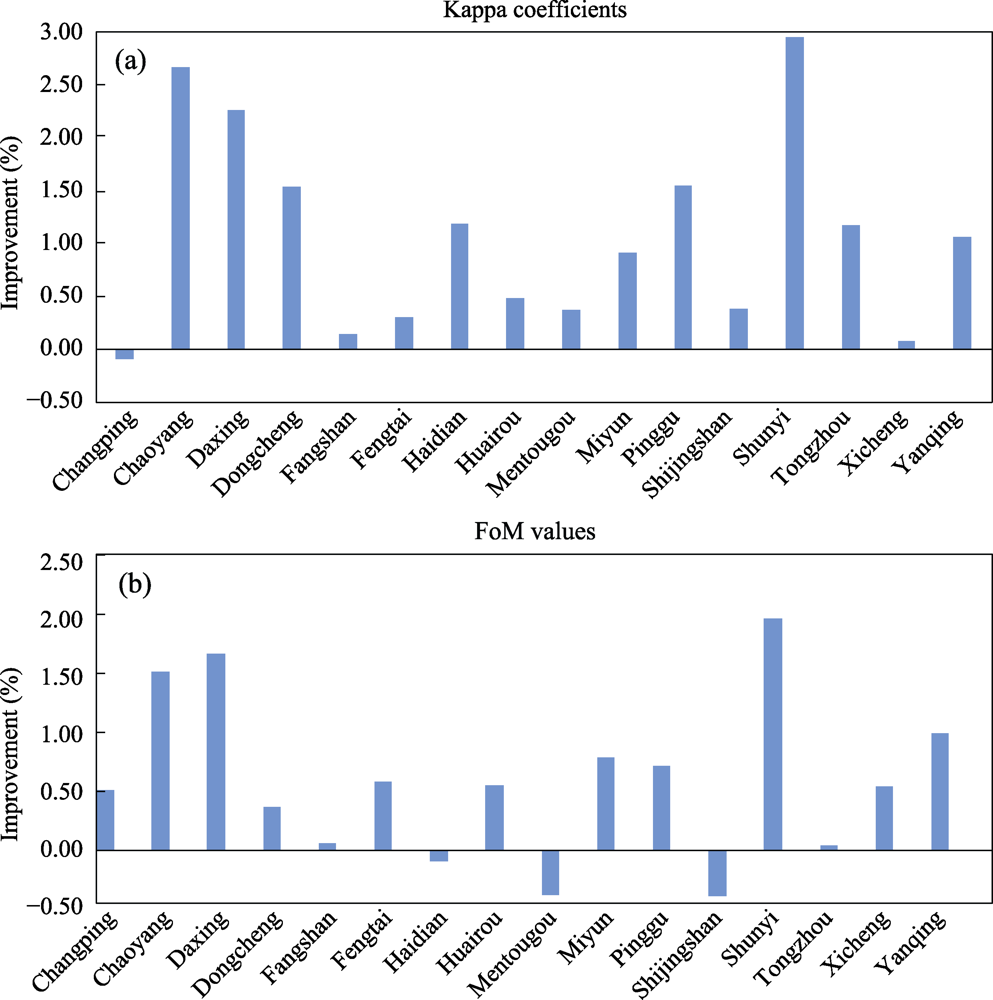
Figure 10
Resultant improvements of Kappa coefficients and FoM values of the simulation results for districts of Beijing based on ANN-CA
withflow
model
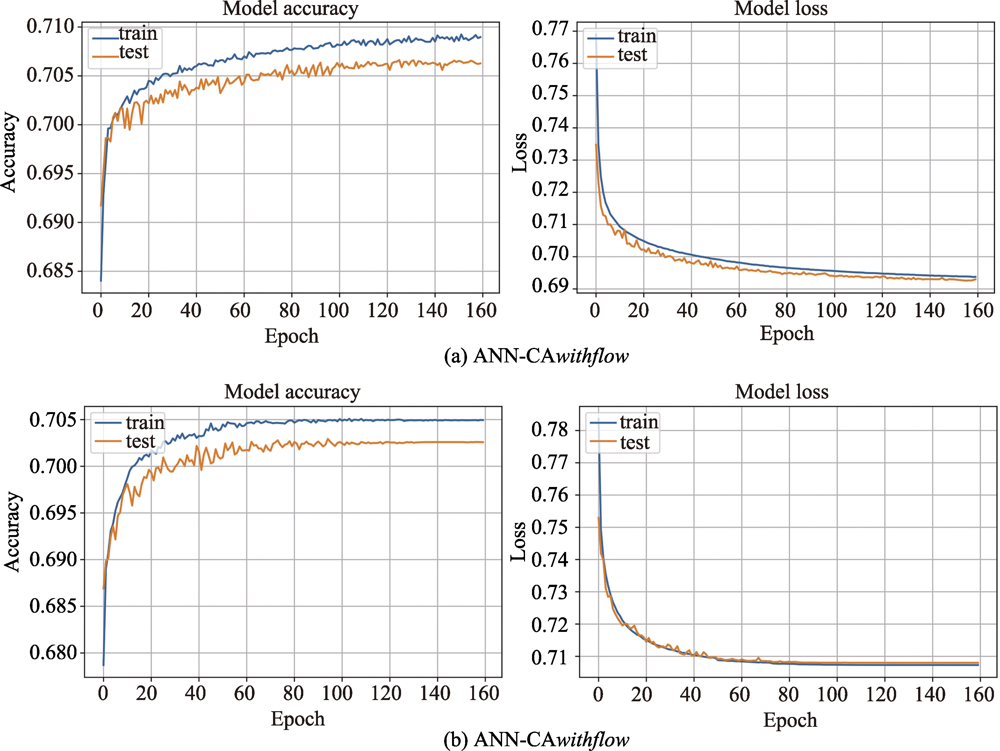
Figure 11
The plots of training accuracy and loss
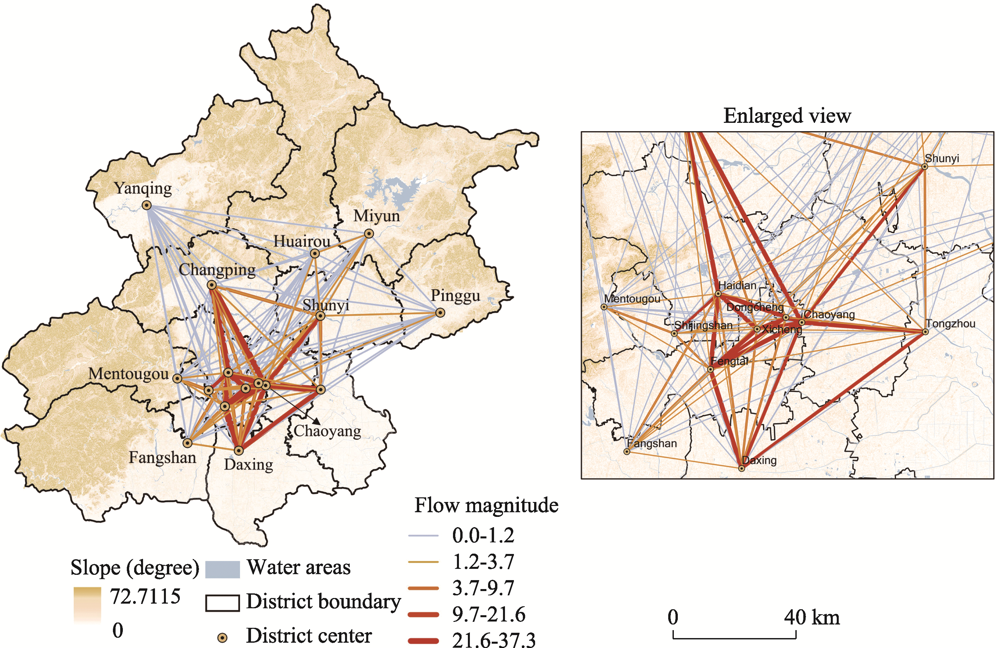
Figure 12
Flow map and an enlarged view of Beijing
Table 3
A comparison of the elevation of the four selected districts of Beijing