 PDF(5968 KB)

Understanding coordinated development through spatial structure and network robustness: A case study of the Beijing-Tianjin-Hebei region
WANG Hao, ZHANG Xiaoyuan, ZHANG Xiaoyu, LIU Ruowen, NING Xiaogang
地理学报(英文版) ›› 2024, Vol. 34 ›› Issue (5) : 1007-1036.
PDF(5968 KB)
PDF(5968 KB)
 ({{custom_author.role_cn}}), {{javascript:window.custom_author_cn_index++;}}
Understanding coordinated development through spatial structure and network robustness: A case study of the Beijing-Tianjin-Hebei region
({{custom_author.role_en}}), {{javascript:window.custom_author_en_index++;}}In the context of accelerated globalization, intercity factor flows are becoming increasingly dependent on a reasonable and orderly spatial structure. Therefore, an in-depth study of the optimization and adjustment of spatial structure is essential for coordinated development. This study quantitatively evaluated urban development levels and introduced network analysis methods to analyse the spatial structure and robustness of development. The results indicated the following: (1) The urban development level in the Beijing-Tianjin- Hebei (BTH) region increased in all dimensions, and the transmission efficiency significantly improved. (2) The spatial structure of the BTH region has been relatively stable, as illustrated by the main pattern of the spatial distribution of central cities, with a trend towards contiguous development. (3) The ranking of network robustness is environment>society>economy, and the core network and key nodes are primarily located within the radiation of the three central cities of Beijing, Tianjin, and Shijiazhuang. (4) The coordinated development of the BTH region is effective but still needs to be optimized and adjusted, and the strategic significance of edge cities has not been completely exploited. This study aims to provide an emerging analytical perspective for optimizing regional spatial structure and promoting regional coordinated development.
urban network / spatial structure / network robustness / coordinated development / Beijing-Tianjin- Hebei (BTH) region {{custom_keyword}} /
Table 1 Research data sources and description |
| Name | Data source | Resolution | Brief description |
|---|---|---|---|
| Land use data | Geographic Condition Monitoring Data | 2 m/yearly | Reflection of the actual development and construction of the urban area |
| Road network data | Geographic Condition Monitoring Data, OpenStreetMap dataset ( | 2 m/yearly | Quantification of the urban transportation development level |
| POI data | Geographic Condition Monitoring Data, POI data ( | 2 m/yearly | Indication of people’s living standards |
| Social and economic data | Beijing Regional Statistics Yearbook, Tianjin Statistical Yearbook, and Hebei Statistical Yearbook | Quantitative measurement of quality in all aspects of the city | |
| PM2.5 data | ChinaHighPM2.5 ( | 1 km/yearly | Characterization of the regional environmental conditions |
| Nighttime light data | EOG Group, Colorado School of Mines, USA ( | 500 m/yearly | Characterization of the regional economic development level |
| Remote sensing image | Landsat8 OLI ( | 30 m/yearly | Quantification of urban environmental quality |
| Administrative boundary | National Basic Geographic Information Database ( | / | Definition of the scope of the study area |
Table 2 The indicator system for evaluating the comprehensive development level of the ESE of cities |
| Guideline layer | Indicator layer & indicator type | Unit | Indicator meaning | Weight |
|---|---|---|---|---|
| Economy (ECO) | GDP (+) | 109 Yuan | Regional economic power | 0.2186 |
| The percentage of added value of the tertiary industry of GDP (+) | % | Industrial and economic structure | 0.0341 | |
| per capita GDP (+) | 104 yuan | Residents’ living standards | 0.0873 | |
| The averages NTL data (+) | / | Economic development level | 0.2282 | |
| General public budget revenues (+) | 104 yuan | Regional financial strength | 0.2354 | |
| General public budget expenditure (+) | 104 yuan | Regional financial strength | 0.1679 | |
| Disposable income per urban resident (+) | yuan | Residents’ living standards | 0.0285 | |
| Society (SCO) | Road network density (+) | km/km² | Infrastructure level | 0.1325 |
| Urbanization rate (+) | % | Urban development potential | 0.0202 | |
| Population density (+) | people/km2 | Population growth potential | 0.2097 | |
| Length of road per capita (+) | m/people | Convenience of transportation | 0.1583 | |
| Percentage of built-up area (+) | % | Land development intensity | 0.0548 | |
| Number of health facilities per 10,000 people (+) | Institute/104 people | Health services level | 0.0344 | |
| Number of schools per 10,000 people (+) | Institute/104 people | Education level | 0.0455 | |
| Open space area per capita (+) | people/km² | Population’s standard of living | 0.3446 | |
| Environment (ENT) | PM2.5 concentration in the air (-) | μg/m3 | Air quality levels | 0.1837 |
| Percentage of Ecological space area (+) | % | Environmental quality levels | 0.5204 | |
| NDVI (+) | / | Urban greenness | 0.1050 | |
| LST (-) | / | Urban heat | 0.0312 | |
| WET (+) | / | Urban humidity | 0.1597 |
Table 3 Overall and individual network indicators |
| Indicator name | Description | Equation | ||
|---|---|---|---|---|
| Network density (D) | Refers to the degree of correlation between network nodes, i.e., the probability of connection between nodes. | |||
| Average path length (L) | Measures the level of network reachability and the average distance between nodes. | |||
| Average clustering coefficient (C) | Indicates the degree of node aggregation in the network and enables the calculation of the probability that two neighbours of a node may be connected to each other. | |||
| Reciprocity (R) | The ratio of bidirectionally connected edges to all edges in a directed weighted network (Garlaschelli and Loffredo, 2004) and is able to measure the closeness of the interaction between two nodes. | |||
| Degree centrality (DC) | Measures a node’s connectivity and influence, differentiating between its ability to receive and exert influence in directed networks. | |||
| Closeness centrality (CC) | Characterizes the correlation between a city’s development and that of other cities, demonstrates superior efficiency of external interactions in regional development networks. | |||
| Betweenness centrality (BC) | Reflects the ability of cities to play a communicative and coordinating role in regional development, and to control or influence the flow of resources and information. | |||
| Eigenvector centrality (EC) | Reflects the degree to which the urban entity itself is connected to key nodes in the vicinity (Li et al., 2016), demonstrating the centrality of the nodes | |||
Table 4 Network robustness evaluation indicator system |
| Indicator name | Description | Equation |
|---|---|---|
| Network efficiency | Reflects the ease of network operation, the more efficient the network, the better the network connectivity | |
| Isolated node ratio | Reflects the proportion of nodes that have no edges connected to them when the network is under attack | |
| Relative size of maximum connected subgraphs | Reflects the size of the largest subgraph during network fragmentation in the event of an attack, providing a visual representation of the extent of network disruption |
Table 5 Overall network structure characteristics |
| Name | 2015ENT | 2019ENT | 2015ECO | 2019ECO | 2015SCO | 2019SCO | 2015SUM | 2019SUM |
|---|---|---|---|---|---|---|---|---|
| D | 0.503 | 0.609 | 0.416 | 0.562 | 0.483 | 0.719 | 0.514 | 0.642 |
| L | 1.558 | 1.416 | 1.686 | 1.467 | 1.582 | 1.283 | 1.548 | 1.373 |
| C | 0.765 | 0.801 | 0.719 | 0.778 | 0.754 | 0.844 | 0.777 | 0.826 |
| R | 0.830 | 0.861 | 0.598 | 0.693 | 0.692 | 0.804 | 0.839 | 0.902 |
| [1] |
{{custom_citation.content}}
{{custom_citation.annotation}}
|
| [2] |
{{custom_citation.content}}
{{custom_citation.annotation}}
|
| [3] |
{{custom_citation.content}}
{{custom_citation.annotation}}
|
| [4] |
{{custom_citation.content}}
{{custom_citation.annotation}}
|
| [5] |
{{custom_citation.content}}
{{custom_citation.annotation}}
|
| [6] |
{{custom_citation.content}}
{{custom_citation.annotation}}
|
| [7] |
{{custom_citation.content}}
{{custom_citation.annotation}}
|
| [8] |
{{custom_citation.content}}
{{custom_citation.annotation}}
|
| [9] |
{{custom_citation.content}}
{{custom_citation.annotation}}
|
| [10] |
{{custom_citation.content}}
{{custom_citation.annotation}}
|
| [11] |
{{custom_citation.content}}
{{custom_citation.annotation}}
|
| [12] |
{{custom_citation.content}}
{{custom_citation.annotation}}
|
| [13] |
{{custom_citation.content}}
{{custom_citation.annotation}}
|
| [14] |
{{custom_citation.content}}
{{custom_citation.annotation}}
|
| [15] |
{{custom_citation.content}}
{{custom_citation.annotation}}
|
| [16] |
{{custom_citation.content}}
{{custom_citation.annotation}}
|
| [17] |
{{custom_citation.content}}
{{custom_citation.annotation}}
|
| [18] |
{{custom_citation.content}}
{{custom_citation.annotation}}
|
| [19] |
{{custom_citation.content}}
{{custom_citation.annotation}}
|
| [20] |
{{custom_citation.content}}
{{custom_citation.annotation}}
|
| [21] |
Promoting coordinated development of the Beijing-Tianjin-Hebei Urban Agglomeration is not only a major national strategy, but also a long-term complex process. It is necessary to apply scientific theories and respect the laws of nature to realize the strategic target of common prosperity, share a clean environment, share the burden of risk of development, and build a world-class metropolis for the Beijing-Tianjin-Hebei Urban Agglomeration. This article examines the scientific foundation and patterns of coordinated development of the Beijing-Tianjin-Hebei Urban Agglomeration. Synergy theory, game theory, dissipative structure theory, and catastrophe theory are the theoretical basis of coordinated development of the Beijing-Tianjin-Hebei Urban Agglomeration. Synergy theory is the core theory for the coordinated development of the Beijing-Tianjin-Hebei Urban Agglomeration. The coordinated development process of the Beijing-Tianjin-Hebei Urban Agglomeration is a non-linear spiral progress of game, coordination, mutation, game, resynchronization, and mutation. Each game-coordination-mutation process promotes the coordinated development of the urban agglomeration to a higher level of coordination, and the progress fluctuates. This process includes eight stages: assistance phase, cooperation phase, harmonization phase, synergy phase, coordination phase, resonance phase, integration phase, and cohesion phase. Further analysis shows that the real connotation of coordinated development of the Beijing-Tianjin-Hebei Urban Agglomeration is to realize the coordination of planning, transportation, industrial development, urban and rural development, market, science and technology, finance, information, ecology, and the environment, as well as the construction of a collaborative development community. The Beijing-Tianjin-Hebei Urban Agglomeration will achieve advanced collaboration from low-level collaborative phase through regional coordination on planning, construction of traffic network, industrial development, joint development of urban and rural areas, market consolidation, science and technology cooperation, equal development of financial services, information sharing, ecological restoration, and pollution control. This study may provide a scientific foundation and theoretical basis for the coordinated development of the Beijing-Tianjin-Hebei Urban Agglomeration. {{custom_citation.content}}
{{custom_citation.annotation}}
|
| [22] |
{{custom_citation.content}}
{{custom_citation.annotation}}
|
| [23] |
{{custom_citation.content}}
{{custom_citation.annotation}}
|
| [24] |
{{custom_citation.content}}
{{custom_citation.annotation}}
|
| [25] |
{{custom_citation.content}}
{{custom_citation.annotation}}
|
| [26] |
{{custom_citation.content}}
{{custom_citation.annotation}}
|
| [27] |
{{custom_citation.content}}
{{custom_citation.annotation}}
|
| [28] |
{{custom_citation.content}}
{{custom_citation.annotation}}
|
| [29] |
{{custom_citation.content}}
{{custom_citation.annotation}}
|
| [30] |
{{custom_citation.content}}
{{custom_citation.annotation}}
|
| [31] |
{{custom_citation.content}}
{{custom_citation.annotation}}
|
| [32] |
{{custom_citation.content}}
{{custom_citation.annotation}}
|
| [33] |
{{custom_citation.content}}
{{custom_citation.annotation}}
|
| [34] |
{{custom_citation.content}}
{{custom_citation.annotation}}
|
| [35] |
{{custom_citation.content}}
{{custom_citation.annotation}}
|
| [36] |
{{custom_citation.content}}
{{custom_citation.annotation}}
|
| [37] |
{{custom_citation.content}}
{{custom_citation.annotation}}
|
| [38] |
{{custom_citation.content}}
{{custom_citation.annotation}}
|
| [39] |
{{custom_citation.content}}
{{custom_citation.annotation}}
|
| [40] |
{{custom_citation.content}}
{{custom_citation.annotation}}
|
| [41] |
{{custom_citation.content}}
{{custom_citation.annotation}}
|
| [42] |
{{custom_citation.content}}
{{custom_citation.annotation}}
|
| [43] |
{{custom_citation.content}}
{{custom_citation.annotation}}
|
| [44] |
A largely unexplored application of “Big Data” in urban contexts is using human mobility data to study temporal heterogeneity in intercity travel networks. Hence, this paper explores China’s intercity travel patterns and their dynamics, with a comparison between weekdays and holidays, to contribute to our understanding of these phenomena. Using passenger travel data inferred from Tencent Location Big Data during weekdays (April 11-15, 2016) and National Golden Week (October 1-7, 2016), we compare the spatial patterns of Chinese intercity travel on weekdays and during Golden Week. The results show that the average daily intercity travel during Golden Week is significantly higher than that during weekdays, but the travel distance and degree of network clustering are significantly lower. This indicates temporal heterogeneity in mapping the intercity travel network. On weekdays, the three major cities of Beijing, Shanghai, and Guangzhou take prominent core positions, while cities that are tourism destinations or transportation hubs are more attractive during Golden Week. The reasons behind these findings can be explained by geographical proximity, administrative division (proximity of cultural and policy systems), travel distance, and travel purposes. {{custom_citation.content}}
{{custom_citation.annotation}}
|
| [45] |
{{custom_citation.content}}
{{custom_citation.annotation}}
|
| [46] |
{{custom_citation.content}}
{{custom_citation.annotation}}
|
| [47] |
{{custom_citation.content}}
{{custom_citation.annotation}}
|
| [48] |
{{custom_citation.content}}
{{custom_citation.annotation}}
|
| [49] |
The rapid and imbalanced economic development in the Beijing-Tianjin-Hebei region has widened the gap between Beijing-Tianjin and surrounding areas since the 1990s, therefore, it is an important social consensus to achieve coordinated development. In this paper, we analyzed the imbalanced economic development in the Beijing-Tianjin-Hebei region by proposing a GDP Index using the DMSP/OLS nighttime light data to represent the regional economic development. Then the Getis-Ord General G, Global Moran's I and Optimized Hot Spot Analysis were applied to qualify the spatial pattern of the GDP Index. Third, Space Time Pattern Mining, Spatial Lag Model (SLM) and Spatial Error Model (SEM) were employed to identify the dynamics of the spatial pattern and evaluate the effects of four factors, which were natural environment (elevation and gradient), infrastructure (road network), policy (land use cover) and administrative division (urban or rural area), to the imbalance in the economy, respectively. Results show that: (1) the study area can be divided into three groups based on the level of economic development: urban Beijing-Tianjin, rural Beijing-Tianjin and urban Hebei, and rural Hebei. And there are two economic development gaps caused by Siphon Effect between urban and rural Beijing-Tianjin, and Beijing-Tianjin and Hebei, which is different from the previous view that only one economic development gap between Beijing-Tianjin and Hebei. (2) The dynamics of spatial pattern of economic development are mainly constant hot spot, fluctuant hot spot and fluctuant cold spot. The degree of hot spot, which is mostly in Beijing-Tianjin, decreases from urban center to rural area as concentric circles. In contrast, the majority of cold spots, which have no obvious ring structure, are located in rural Hebei. (3) The economic development in the Beijing-Tianjin-Hebei region has non-linear relationship with natural environment, infrastructure, policy and administrative division. In the hot spot region where the economy is more developed, all four factors, especially infrastructure, policy and administrative division, are positively correlated with economic development. However, high gradient, insufficient infrastructure and improper policy limit the economic development in the place with less developed economy, i.e. the cold spot region. This research may be helpful to understand the process and current conditions of economic development in the Beijing-Tianjin-Hebei region, and useful to realize coordinated development in this region. {{custom_citation.content}}
{{custom_citation.annotation}}
|
| [50] |
{{custom_citation.content}}
{{custom_citation.annotation}}
|
| [51] |
{{custom_citation.content}}
{{custom_citation.annotation}}
|
| [52] |
{{custom_citation.content}}
{{custom_citation.annotation}}
|
| [53] |
{{custom_citation.content}}
{{custom_citation.annotation}}
|
| [54] |
{{custom_citation.content}}
{{custom_citation.annotation}}
|
| [55] |
Studies investigating innovation networks shaped by large innovative enterprises (LI-ENTs), which play a very important role in intercity diffusion of technology and knowledge, are rather thin on the ground. Using location information of LI-ENTs in China, we performed a headquarter-branch analysis to generate intercity innovation linkages and analyzed the patterns and dynamics of the generated network of knowledge diffusion. Although the network covers 353 cities across China, its spatial distribution is extremely uneven, with a few cities and city-dyads dominating the structure of the network. Furthermore, intercity linkages of innovation within and of urban agglomerations, as well as their central cities, stand out. With regard to network dynamics, the economic development level, innovation ability, and administrative level of cities, as well as the geographical, institutional, and technological proximity between cities are all found to have a positive impact on intercity linkages of innovations, whilst the impact of FDI on the national distribution of Chinese innovative enterprises is negative. Most importantly, the status of cities within the urban agglomeration exerts a significant positive effect in relation to the innovative enterprises’ expansions, which reflects that the top-down forces of government and the bottom-up forces of market function together. {{custom_citation.content}}
{{custom_citation.annotation}}
|
| [56] |
{{custom_citation.content}}
{{custom_citation.annotation}}
|
| [57] |
{{custom_citation.content}}
{{custom_citation.annotation}}
|
| [58] |
{{custom_citation.content}}
{{custom_citation.annotation}}
|
| [59] |
{{custom_citation.content}}
{{custom_citation.annotation}}
|
| [60] |
{{custom_citation.content}}
{{custom_citation.annotation}}
|
| [61] |
{{custom_citation.content}}
{{custom_citation.annotation}}
|
| [62] |
{{custom_citation.content}}
{{custom_citation.annotation}}
|
| [63] |
{{custom_citation.content}}
{{custom_citation.annotation}}
|
| [64] |
The continuous growth of urban agglomerations in China has increased their complexity as well as vulnerability. In this context, urban resilience is critical for the healthy and sustainable development of urban agglomerations. Focusing on the Beijing-Tianjin-Hebei (BTH) urban agglomeration, this study constructs an urban resilience evaluation system based on four subsystems: economy, society, infrastructure, and ecology. It uses the entropy method to measure the urban resilience of the BTH urban agglomeration from 2000 to 2018. Theil index, standard deviation ellipse, and gray prediction model GM (1,1) methods are used to examine the spatio-temporal evolution and dynamic simulation of urban resilience in this urban agglomeration. Our results show that the comprehensive evaluation index for urban resilience in the BTH urban agglomeration followed a steady upward trend from 2000 to 2018, with an average annual growth rate of 6.72%. There are significant differences in each subsystem’s contribution to urban resilience; overall, economic resilience is the main factor affecting urban resilience, with an average annual growth rate of 8.06%. Spatial differences in urban resilience in the BTH urban agglomeration have decreased from 2000 to 2018, showing the typical characteristic of being greater in the central core area and lower in the surrounding non-core areas. The level of urban resilience in the BTH urban agglomeration is forecast to continue increasing over the next ten years. However, there are still considerable differences between the cities. Policy factors will play a positive role in promoting the resilience level. Based on the evaluation results, corresponding policy recommendations are put forward to provide scientific data support and a theoretical basis for the resilience construction of the BTH urban agglomeration. {{custom_citation.content}}
{{custom_citation.annotation}}
|
| [65] |
{{custom_citation.content}}
{{custom_citation.annotation}}
|
| [66] |
{{custom_citation.content}}
{{custom_citation.annotation}}
|
| [67] |
{{custom_citation.content}}
{{custom_citation.annotation}}
|
| [68] |
{{custom_citation.content}}
{{custom_citation.annotation}}
|
| [69] |
{{custom_citation.content}}
{{custom_citation.annotation}}
|
| [70] |
{{custom_citation.content}}
{{custom_citation.annotation}}
|
| [71] |
{{custom_citation.content}}
{{custom_citation.annotation}}
|
| [72] |
{{custom_citation.content}}
{{custom_citation.annotation}}
|
| [73] |
{{custom_citation.content}}
{{custom_citation.annotation}}
|
| [74] |
{{custom_citation.content}}
{{custom_citation.annotation}}
|
| [75] |
{{custom_citation.content}}
{{custom_citation.annotation}}
|
| [76] |
{{custom_citation.content}}
{{custom_citation.annotation}}
|
| [77] |
{{custom_citation.content}}
{{custom_citation.annotation}}
|
| [78] |
{{custom_citation.content}}
{{custom_citation.annotation}}
|
| [79] |
Since the launch of China’s reform and opening up policy, the process of urbanization in China has accelerated significantly. With the development of cities, inter-city interactions have become increasingly close, forming urban agglomerations that tend to be integrated. Urban agglomerations are regional spaces with network relationships and hierarchies, and have always been the main units for China to promote urbanization and regional coordinated development. In this paper, we comprehensively consider the network and hierarchical characteristics of an urban agglomeration, while using urban flow to describe the interactions of the inter-city networks and the hierarchical generalized linear model (HGLM) to reveal the hierarchical driving mechanism of the urban agglomeration. By coupling the HGLM with a cellular automata (CA) model, we introduced the HGLM-CA model for the simulation of the spatial expansion of an urban agglomeration, and compared the simulation results with those of the logistic-CA model and the biogeography-based optimization CA (BBO-CA) model. According to the results, we further analyzed the advantages and disadvantages of the proposed HGLM-CA model. We selected the middle reaches of the Yangtze River in China as the research area to conduct this empirical research, and simulated the spatial expansion of the urban agglomeration in 2017 on the basis of urban land-use data from 2007 and 2012. The results indicate that the spatial expansion of the urban agglomeration can be attributed to various driving factors. As a driving factor at the urban level, urban flow promotes the evolution of land use in the urban agglomeration, and also plays an important role in regulating cell-level factors, making the cell-level factors of different cities show different driving effects. The HGLM-CA model is able to obtain a higher simulation accuracy than the logistic-CA model, which indicates that the simulation results for urban agglomeration expansion considering urban flow and hierarchical characteristics are more accurate. When compared with the intelligent algorithm model, i.e., BBO-CA, the HGLM-CA model obtains a lower simulation accuracy, but it can analyze the interaction of the various driving factors from a hierarchical perspective. It also has a strong explanatory effect for the spatial expansion mechanism of urban agglomerations. {{custom_citation.content}}
{{custom_citation.annotation}}
|
| [80] |
{{custom_citation.content}}
{{custom_citation.annotation}}
|
| [81] |
{{custom_citation.content}}
{{custom_citation.annotation}}
|
| [82] |
{{custom_citation.content}}
{{custom_citation.annotation}}
|
| [83] |
Numerous environmental problems have been seen due to the "high energy consumption, high pollution, high emissions" economic model in the Beijing-Tianjin-Hebei urban agglomeration (BTHUA). The coupling coordination degree model is applied to provide a coordination of urbanization and ecological environment composite system (CUECS) value while a geographic detector is applied to explore the dominant factors controlling it. This study reached the following conclusions. (1)The CUECS types are mainly low coordination, but which generally exhibit positive evolutionary trend. The change trends can be characterized as urbanization lags followed by system equilibrium followed by ecological environmental lags. (2)The CUECS conforms to a core-edge distributional pattern that comprises plain high mountain low, inland high coastal low. Industrialization played a key role in the development of BTHUA, the landform type was the important factor controlling CUECS. (3) Social consumer goods, gross domestic product, the disposable income of urban residents (all per capita) are the core factors controlling CUECS within different spatial units. Urbanization rate, per capita social consumer goods, the proportion of tertiary industrial population are the core factors controlling CUECS during different urbanization development stages. (4)The relative impacts of urbanization and ecological environmental subsystems on CUECS are (in decreasing order of importance) population urbanization, economic urbanization, social urbanization, ecological environment subsystem. Therefore, green urbanization remains the primary path for sustainable development within the urban agglomeration. It is unsuitable for rapid urbanization development model in the mountainous areas that encapsulate ecological and environmental security as their main functions, so the government urgently needs to amend its 'one size fits all' policy system.Copyright © 2019 Elsevier Ltd. All rights reserved.
{{custom_citation.content}}
{{custom_citation.annotation}}
|
| [84] |
{{custom_citation.content}}
{{custom_citation.annotation}}
|
| [85] |
{{custom_citation.content}}
{{custom_citation.annotation}}
|
| [86] |
{{custom_citation.content}}
{{custom_citation.annotation}}
|
| [87] |
{{custom_citation.content}}
{{custom_citation.annotation}}
|
| [88] |
{{custom_citation.content}}
{{custom_citation.annotation}}
|
| [89] |
As a kind of large-scale connectivity infrastructure, submarine cables play a vital role in international telecommunication, socio-economic development and national defense security. However, the current understanding about the spatial pattern of global submarine cable network is relatively limited. In this article, we analyze the spatial distribution and connectivity pattern of global submarine cables, and identify their strategic pivots and strategic channels. The main conclusions are as follows: (1) The spatial distribution of global submarine cables is significantly unbalanced, which is characterized by the facts that the distribution of submarine cable lines is similar to that of sea lanes, and the agglomerations of landing stations are distributed unevenly along the coastline. (2) The connectivity pattern of global submarine cable network has a significant scale effect. At the micro, meso and macro scales, the connectivity structure presents chain model, cluster model and hub-and-spoke model, respectively. (3) The distribution of strategic pivots and strategic channels shows a pyramidal hierarchical feature. Singapore ranks highest among all the strategic pivots, while the Gulf of Aden and the Strait of Malacca rank highest among the strategic channels. Based on the identification of strategic pivots and channels, six strategic regions have been divided, which face various network security risks and need special attention and vigilance. {{custom_citation.content}}
{{custom_citation.annotation}}
|
| [90] |
{{custom_citation.content}}
{{custom_citation.annotation}}
|
| [91] |
Globalization and informatization promote the evolution of urban spatial organization from a hierarchical structure mode to a network structure mode, forming a complex network system. This study considers the coupling of “space of flows” and “spaces of places” as the core and “embeddedness” as the link and a relevant theoretical basis; then we construct a conceptual model of urban networks and explore the internal logic of enterprise networks and city networks. Using the interlocking-affiliate network model and data from China’s top 500 listed companies, this study constructs a directed multi-valued relational matrix between cities in western China from 2005 to 2015. Using social network analysis and the multiple regression of quadratic assignment program model (MRQAP), this study adopts a “top-down” research perspective to analyze the spatio-temporal evolution and growth mechanism of the city network in western China from three nested spatial scales: large regions, intercity agglomerations, and intracity agglomerations. The results show the following: (1) Under the large regional scale, the city network has good symmetry, obvious characteristics of hierarchical diffusion, neighborhood diffusion, and cross-administrative regional connection, presenting the “core-periphery” structural pattern. (2) The network of intercity agglomerations has the characteristics of centralization, stratification, and geographical proximity. (3) The internal network of each urban agglomeration presents a variety of network structure modes, such as dual-core, single-core, and multicore modes. (4) Administrative subordination and economic system proximity have a significant positive impact on the city network in western China. The differences in internet convenience, investment in science and technology, average time distance, and economic development have negative effects on the growth and development of city networks. (5) The preferential attachment is the internal driving force of the city network development. {{custom_citation.content}}
{{custom_citation.annotation}}
|
| [92] |
{{custom_citation.content}}
{{custom_citation.annotation}}
|
| [93] |
{{custom_citation.content}}
{{custom_citation.annotation}}
|
| [94] |
{{custom_citation.content}}
{{custom_citation.annotation}}
|
| [95] |
{{custom_citation.content}}
{{custom_citation.annotation}}
|
| [96] |
{{custom_citation.content}}
{{custom_citation.annotation}}
|
| [97] |
{{custom_citation.content}}
{{custom_citation.annotation}}
|
| [98] |
{{custom_citation.content}}
{{custom_citation.annotation}}
|
| [99] |
Analyzing patterns of urban development should consider the network structure among cities as well as the formation of the function and role of each city in the network. The flow analysis of various factors between cities is based on urban network and space of flow theories. This study used Hebei Province of China as the case. The comprehensive status of each city in the regional urban network was measured by simulating the economic, information, traffic, and financial flow among cities. Results indicate that the development pattern can be divided into three levels with a multi-core and multi-node network structure. In addition, the flow analysis method can predict 67% of urban developmental level. Furthermore, some policy recommendations are put forward to facilitate regional integrated development in Hebei province.
{{custom_citation.content}}
{{custom_citation.annotation}}
|
| [100] |
{{custom_citation.content}}
{{custom_citation.annotation}}
|
| [101] |
{{custom_citation.content}}
{{custom_citation.annotation}}
|
| [102] |
{{custom_citation.content}}
{{custom_citation.annotation}}
|
| {{custom_ref.label}} |
{{custom_citation.content}}
{{custom_citation.annotation}}
|


 PDF(5968 KB)
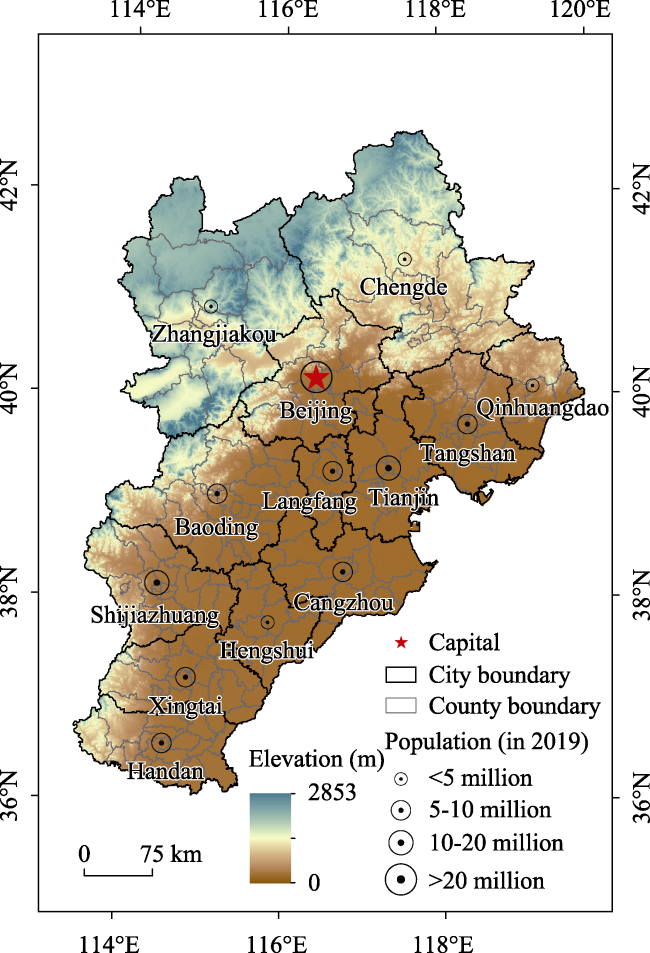
 Figure 1 Location of the study area (Beijing-Tianjin-Hebei region)
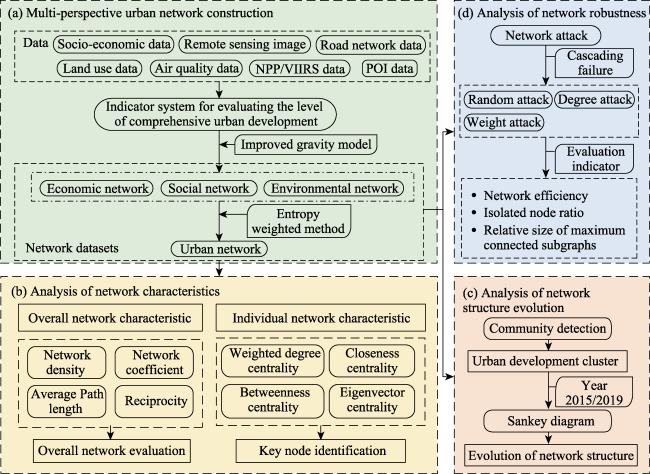
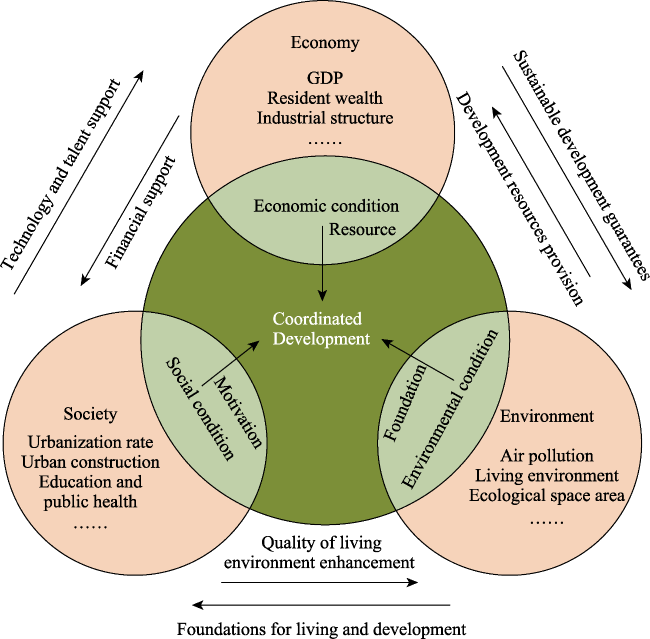
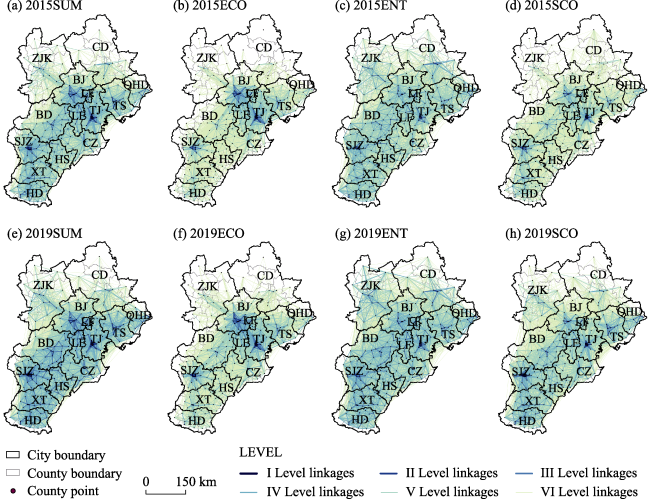
 Table 1 Research data sources and descriptionFigure 2 Research frameworkFigure 3 Interaction of the social, economic and environmental subsystemsTable 2 The indicator system for evaluating the comprehensive development level of the ESE of citiesTable 3 Overall and individual network indicatorsTable 4 Network robustness evaluation indicator systemFigure 4 Evolution of various networks in the Beijing-Tianjin-Hebei region from 2015-2019Table 5 Overall network structure characteristicsFigure 5 Network centrality differences among different subsystems in the Beijing-Tianjin-Hebei region from 2015 to 2019Figure 6 Evolution of various networks in the Beijing-Tianjin-Hebei region from 2015-2019 (Note: Different colours represent different clusters, and the width size represents the number of city transfers.)Figure 7 Results of city clustering in different dimensions in the Beijing-Tianjin-Hebei region from 2015-2019 (Note: Different classes represent different urban clusters.)Figure 8 Variations in network robustness characteristic value under different node attack methodsFigure 9 Multidimensional core network in the Beijing-Tianjin-Hebei region (Note: Different levels represent the contact strength, where the first level is the highest; the grading criteria are the same as those in Figure 4.)Figure 10 Core nodes of the multidimensional network in the Beijing-Tianjin-Hebei region at county level
/
| 〈 |
|
〉 |


 AI Summary

