×
模态框(Modal)标题
在这里添加一些文本
Close
Close
Submit
Cancel
Confirm
×
模态框(Modal)标题
×
Journal
Article
Figure
Search
EN
中文
Home
About Journal
About Journal
Indexed in
Awards
Editorial Board
Guide for Authors
Browse
Current Issue
Online First
Archive
Highlights
Topic
Archive by Subject
Most Viewed
Most Download
Most Cited
E-mail Alert
RSS
Subscribe
Advertisement
Contact us
EN
中文
Figure/Table detail
Quantitative inversion of soil salinization in salt lake regions:Spatiotemporal variation and driving mechanisms
HAN Jinjun, WANG Zitao, WANG Jianping, ZHAO Chuntao, YU Dongmei, LIU Zhaofeng
Journal of Geographical Sciences
, 2026, 36(
3
): 732-762. DOI:
10.1007/s11442-026-2468-y
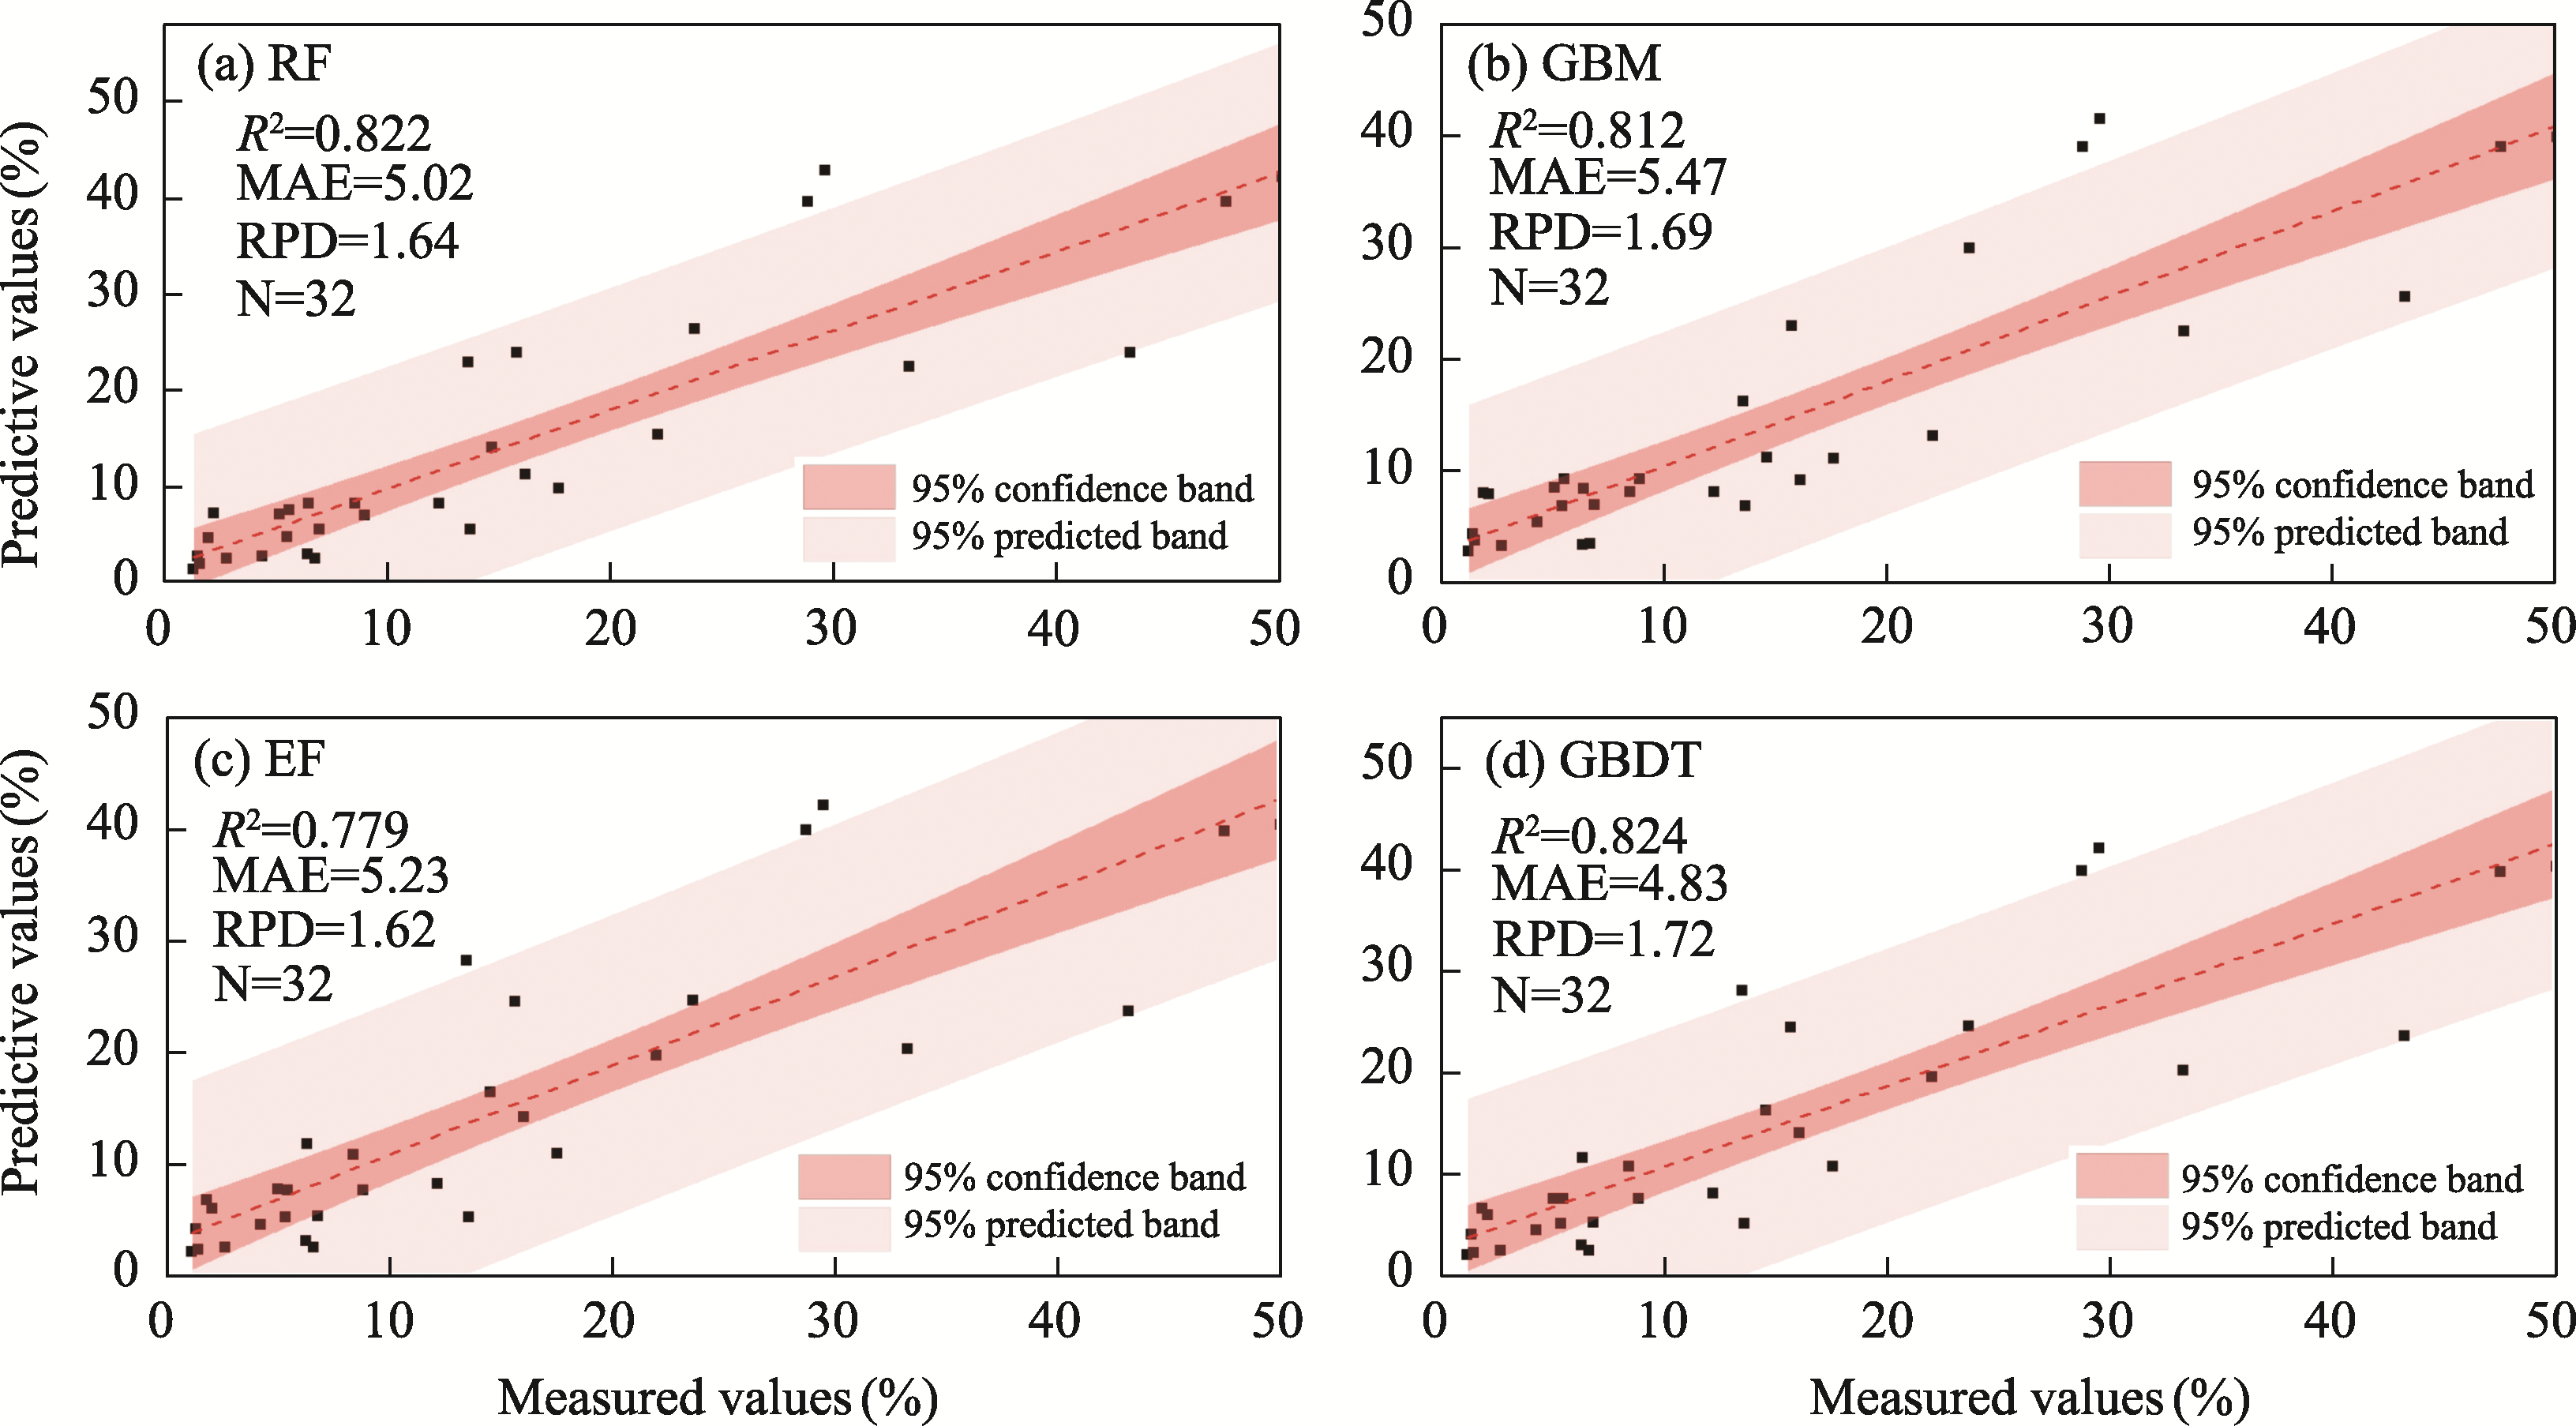
Figure 7
Evaluating the accuracy among four inversion models (RF, GBM, EF and GBDT)
Other figure/table from this article
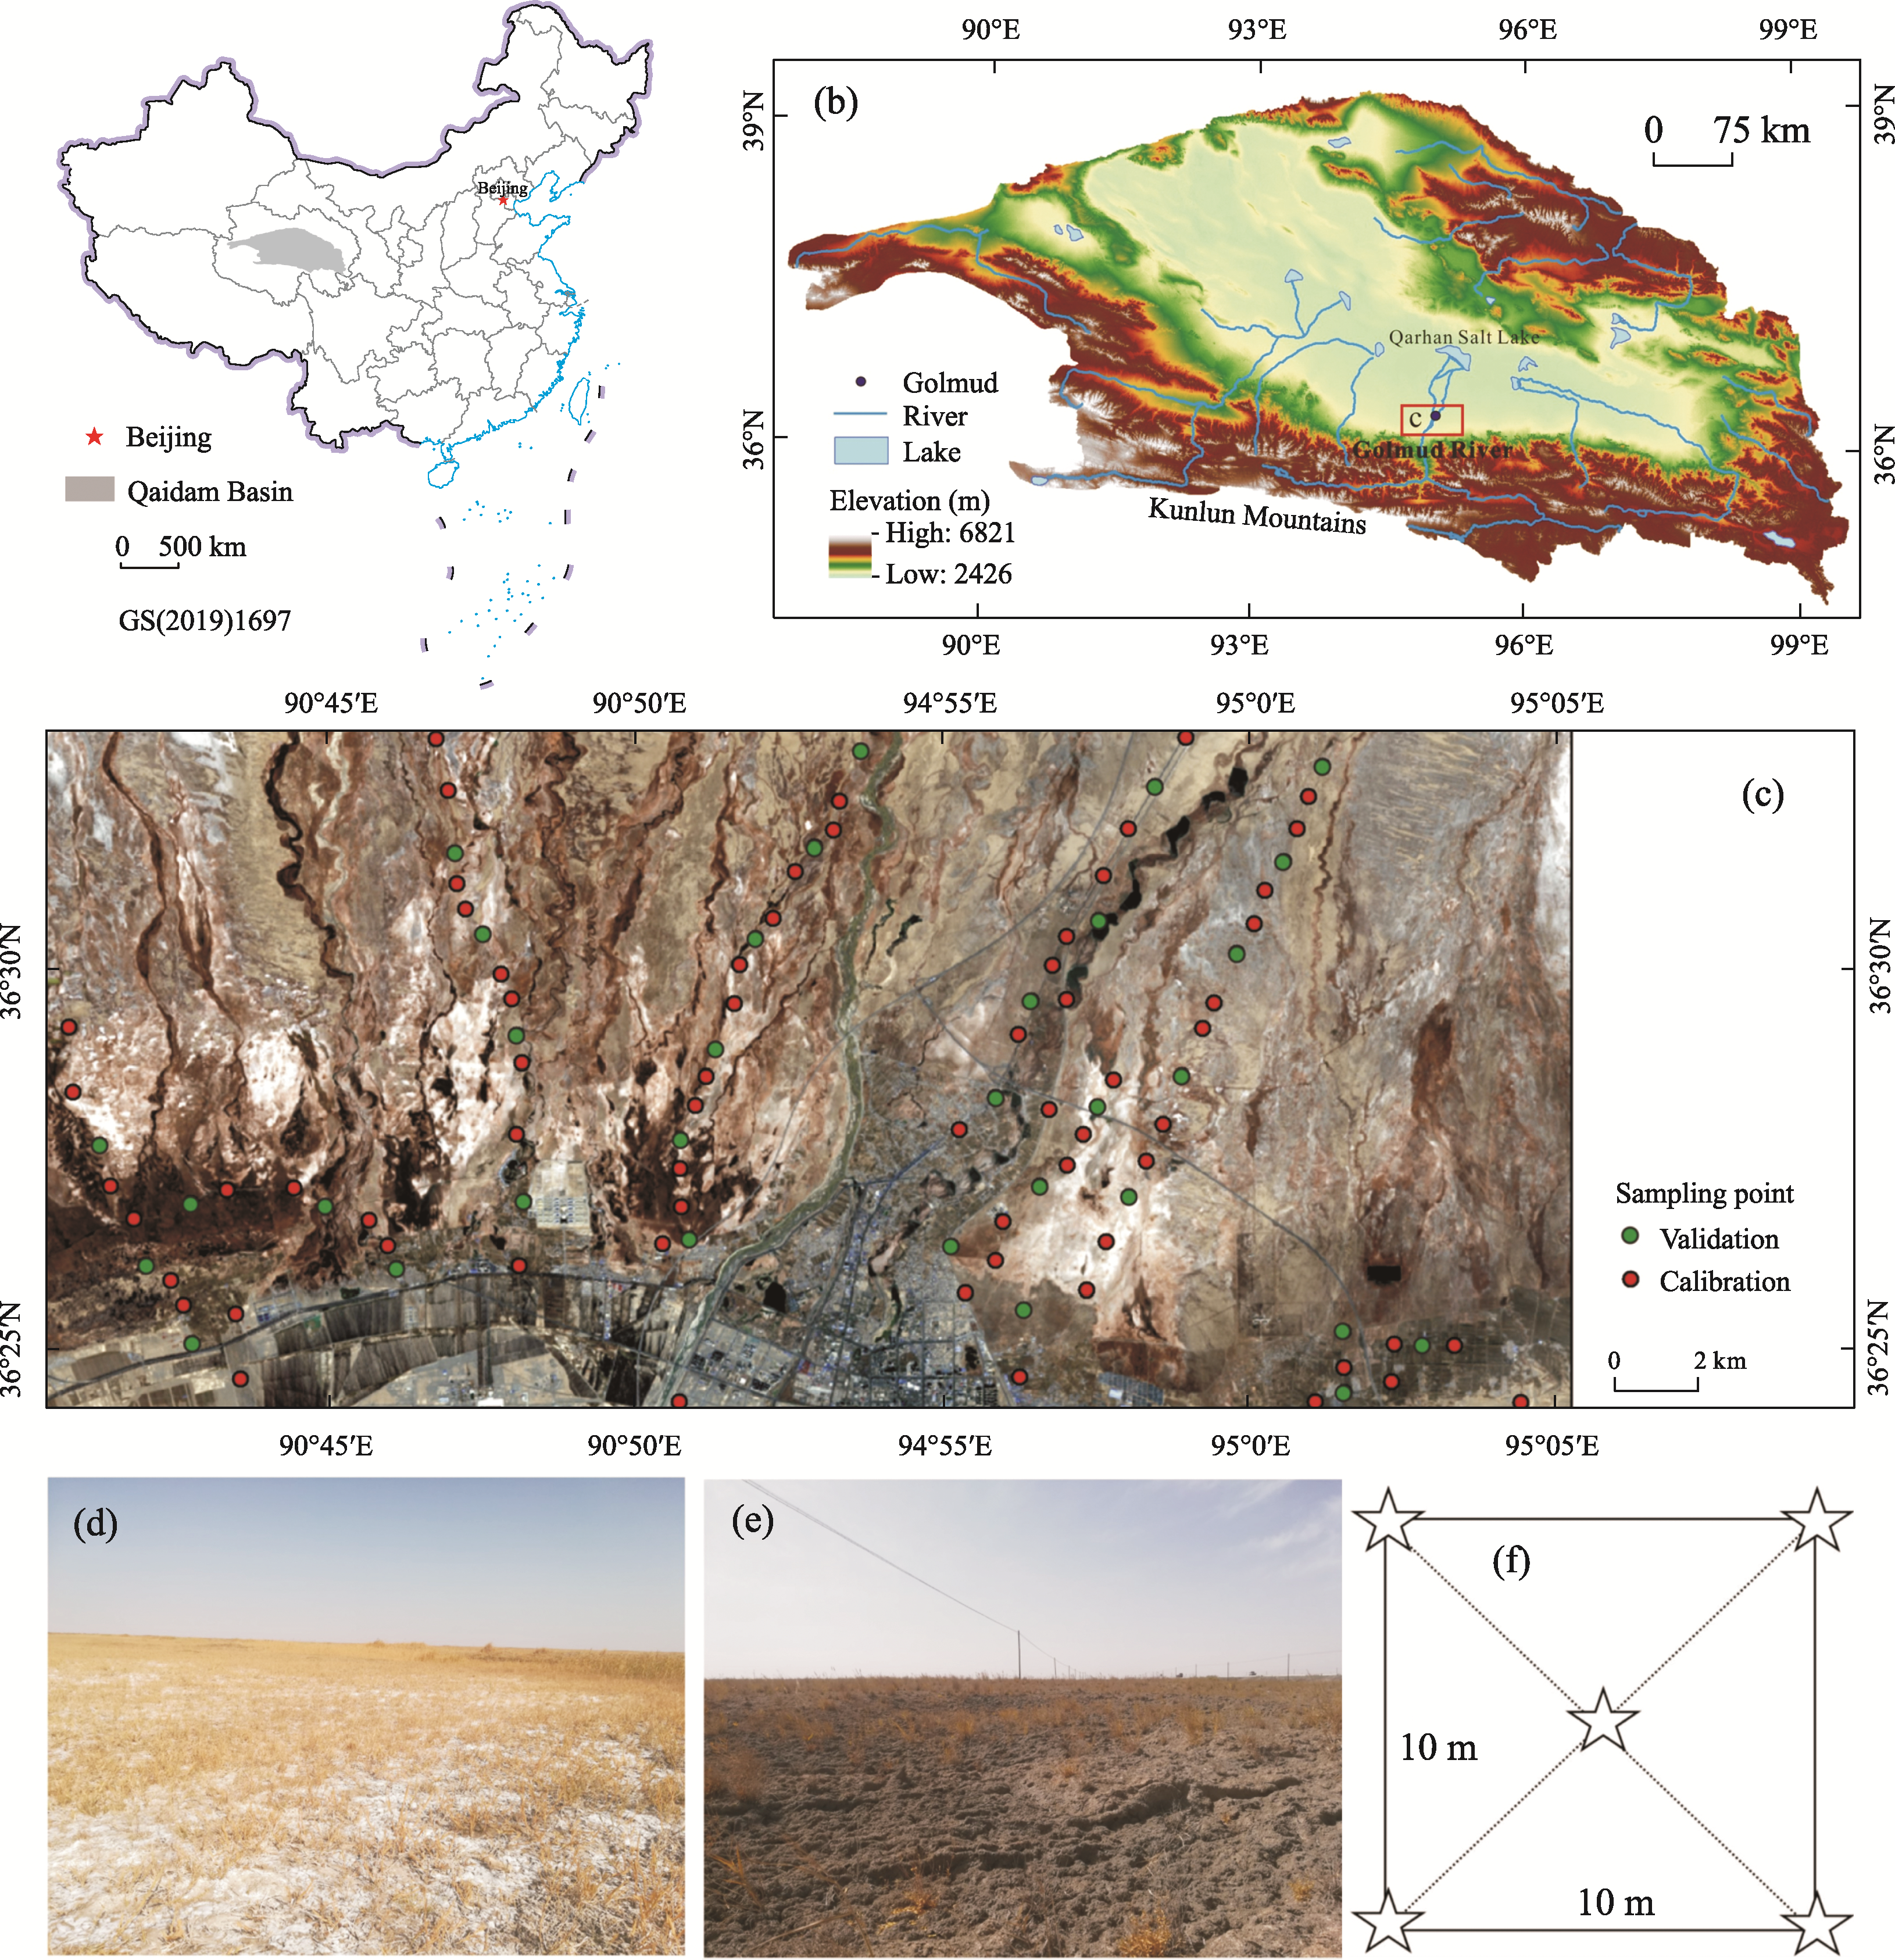
Figure 1
Location (a) and geographical overview (b) of the Qaidam Basin, and the location of the study area (c), the situation of soil salinization (d and e), and the sampling grid (f)
Table 1
Comparison of image band parameters between Landsat 5 TM and Landsat 8 OLI
Table 2
The surface parameters employed in this study for soil salinity prediction (primarily consist of terrain attributes, remote sensing data, salinity spectral index, and vegetation spectral index) and their abbreviations, calculation formulas, and their corresponding references.
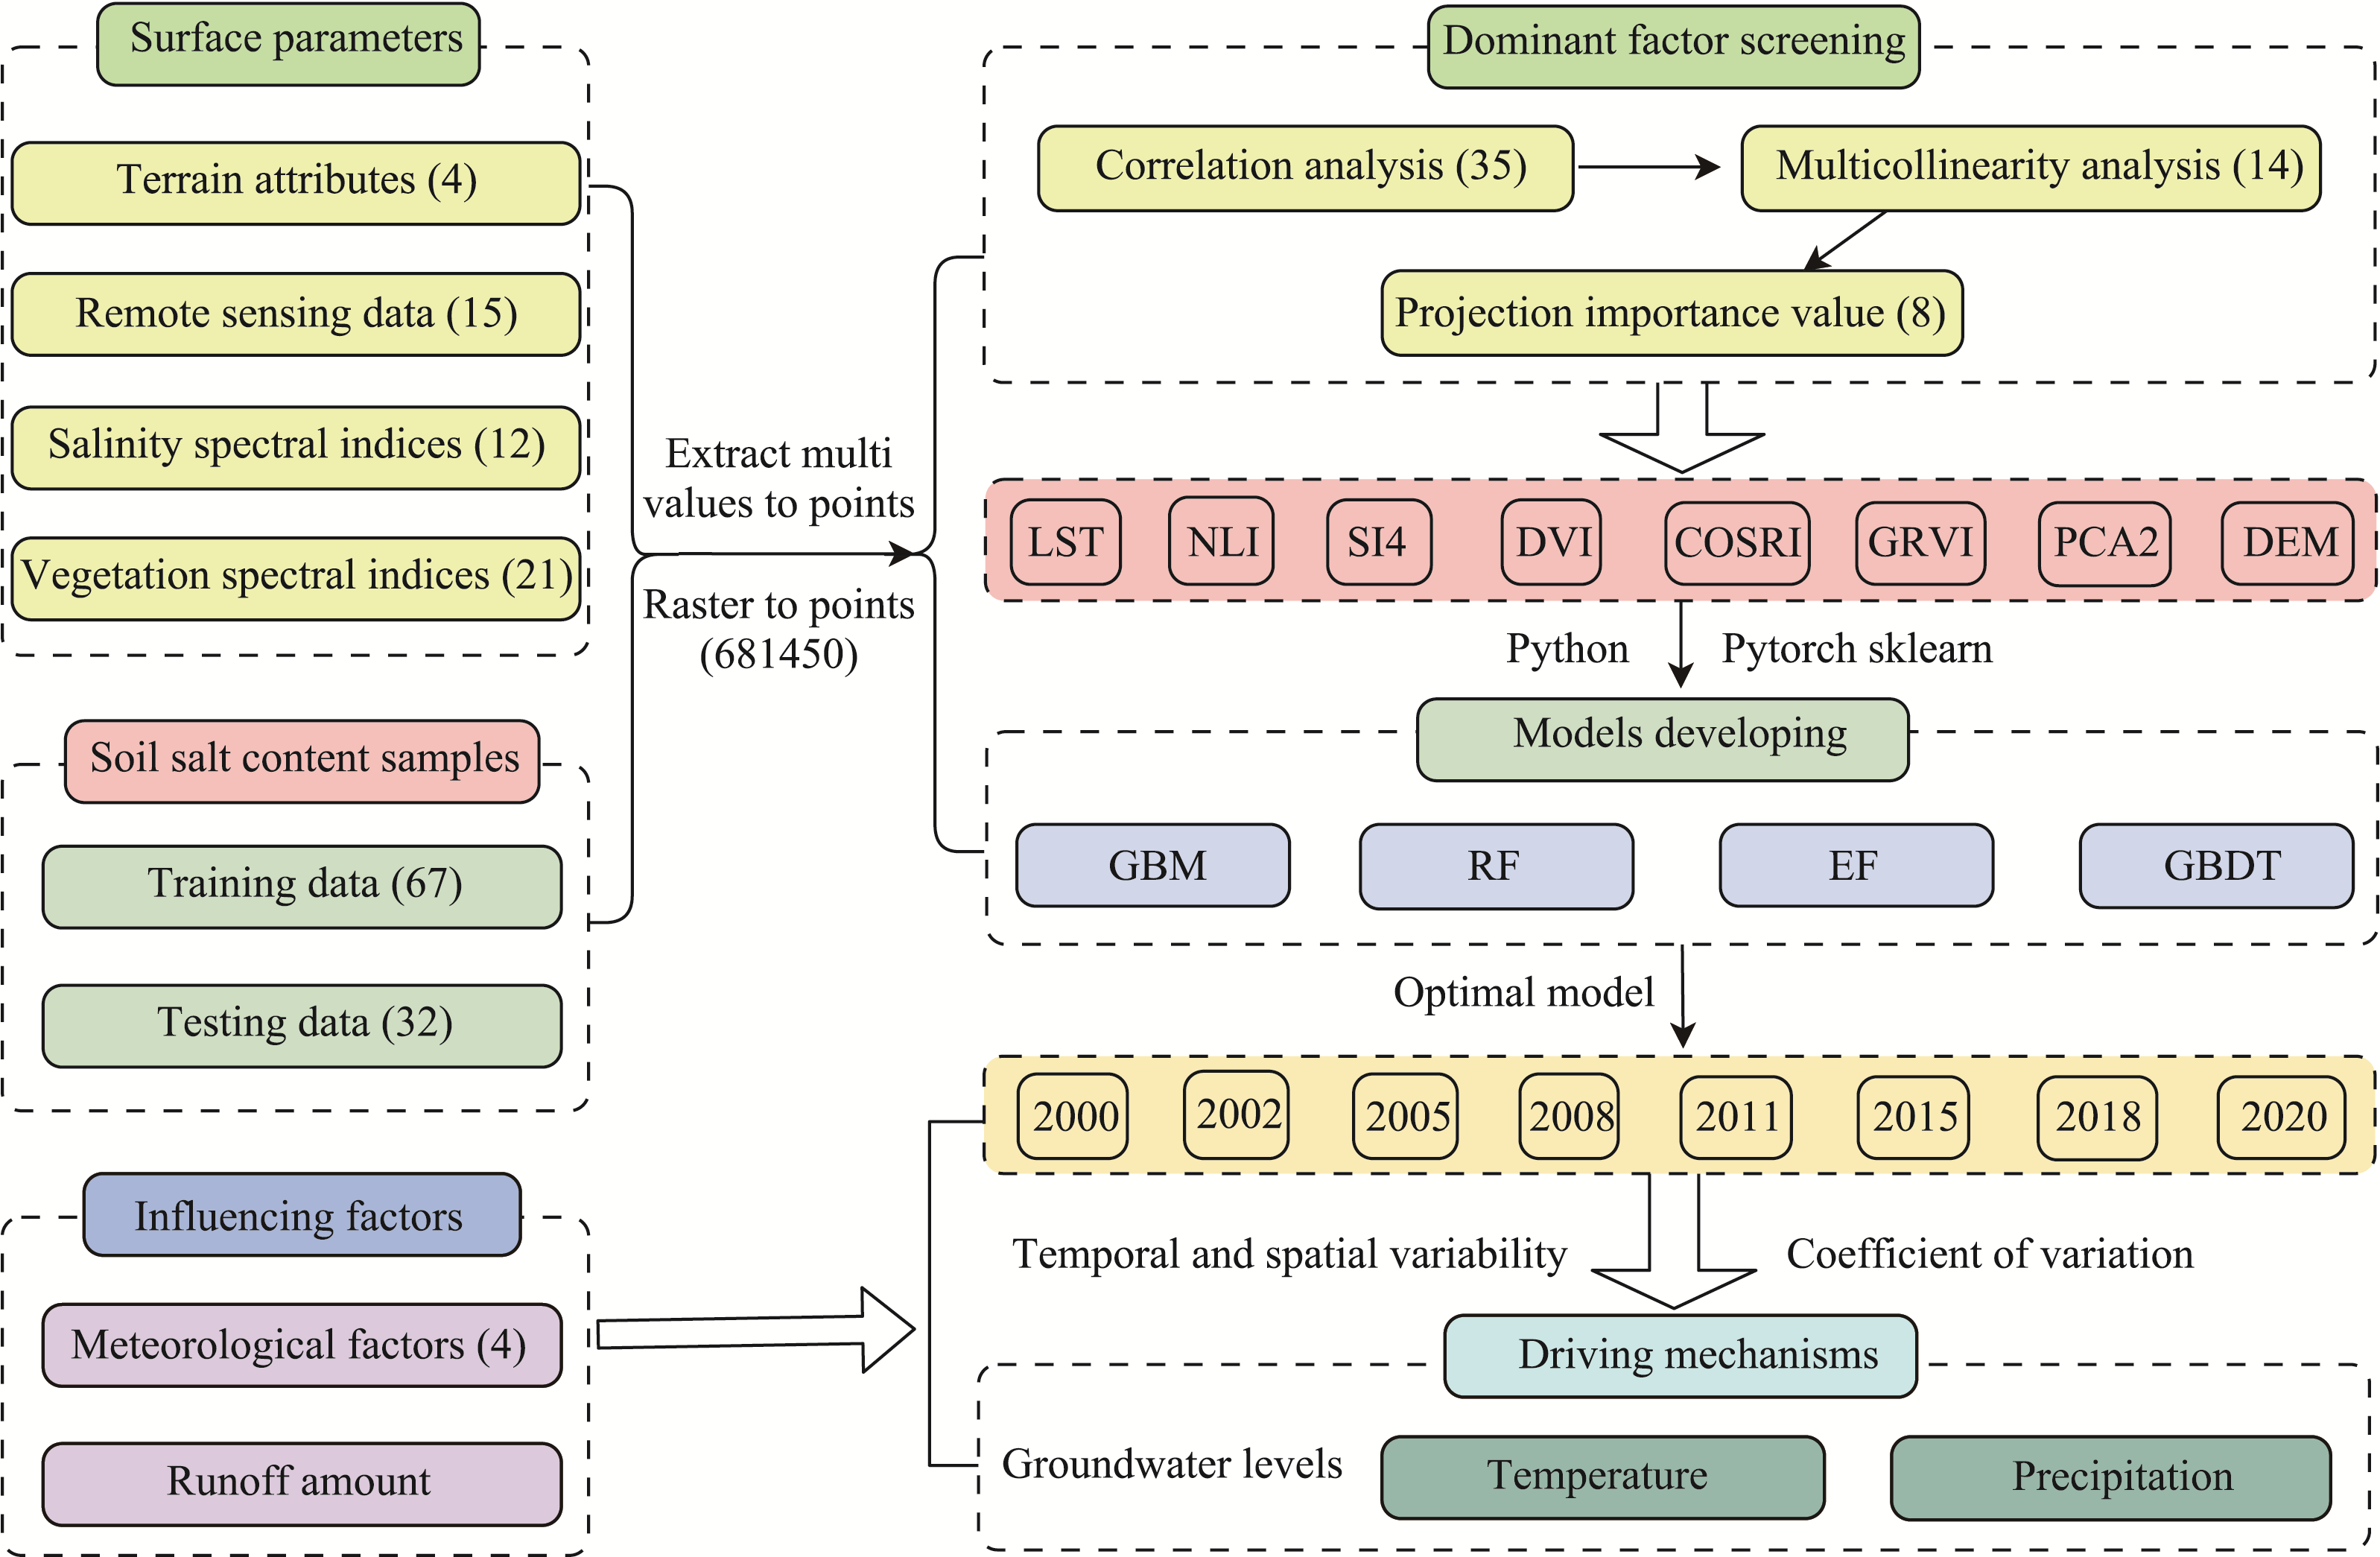
Figure 2
Methodological framework
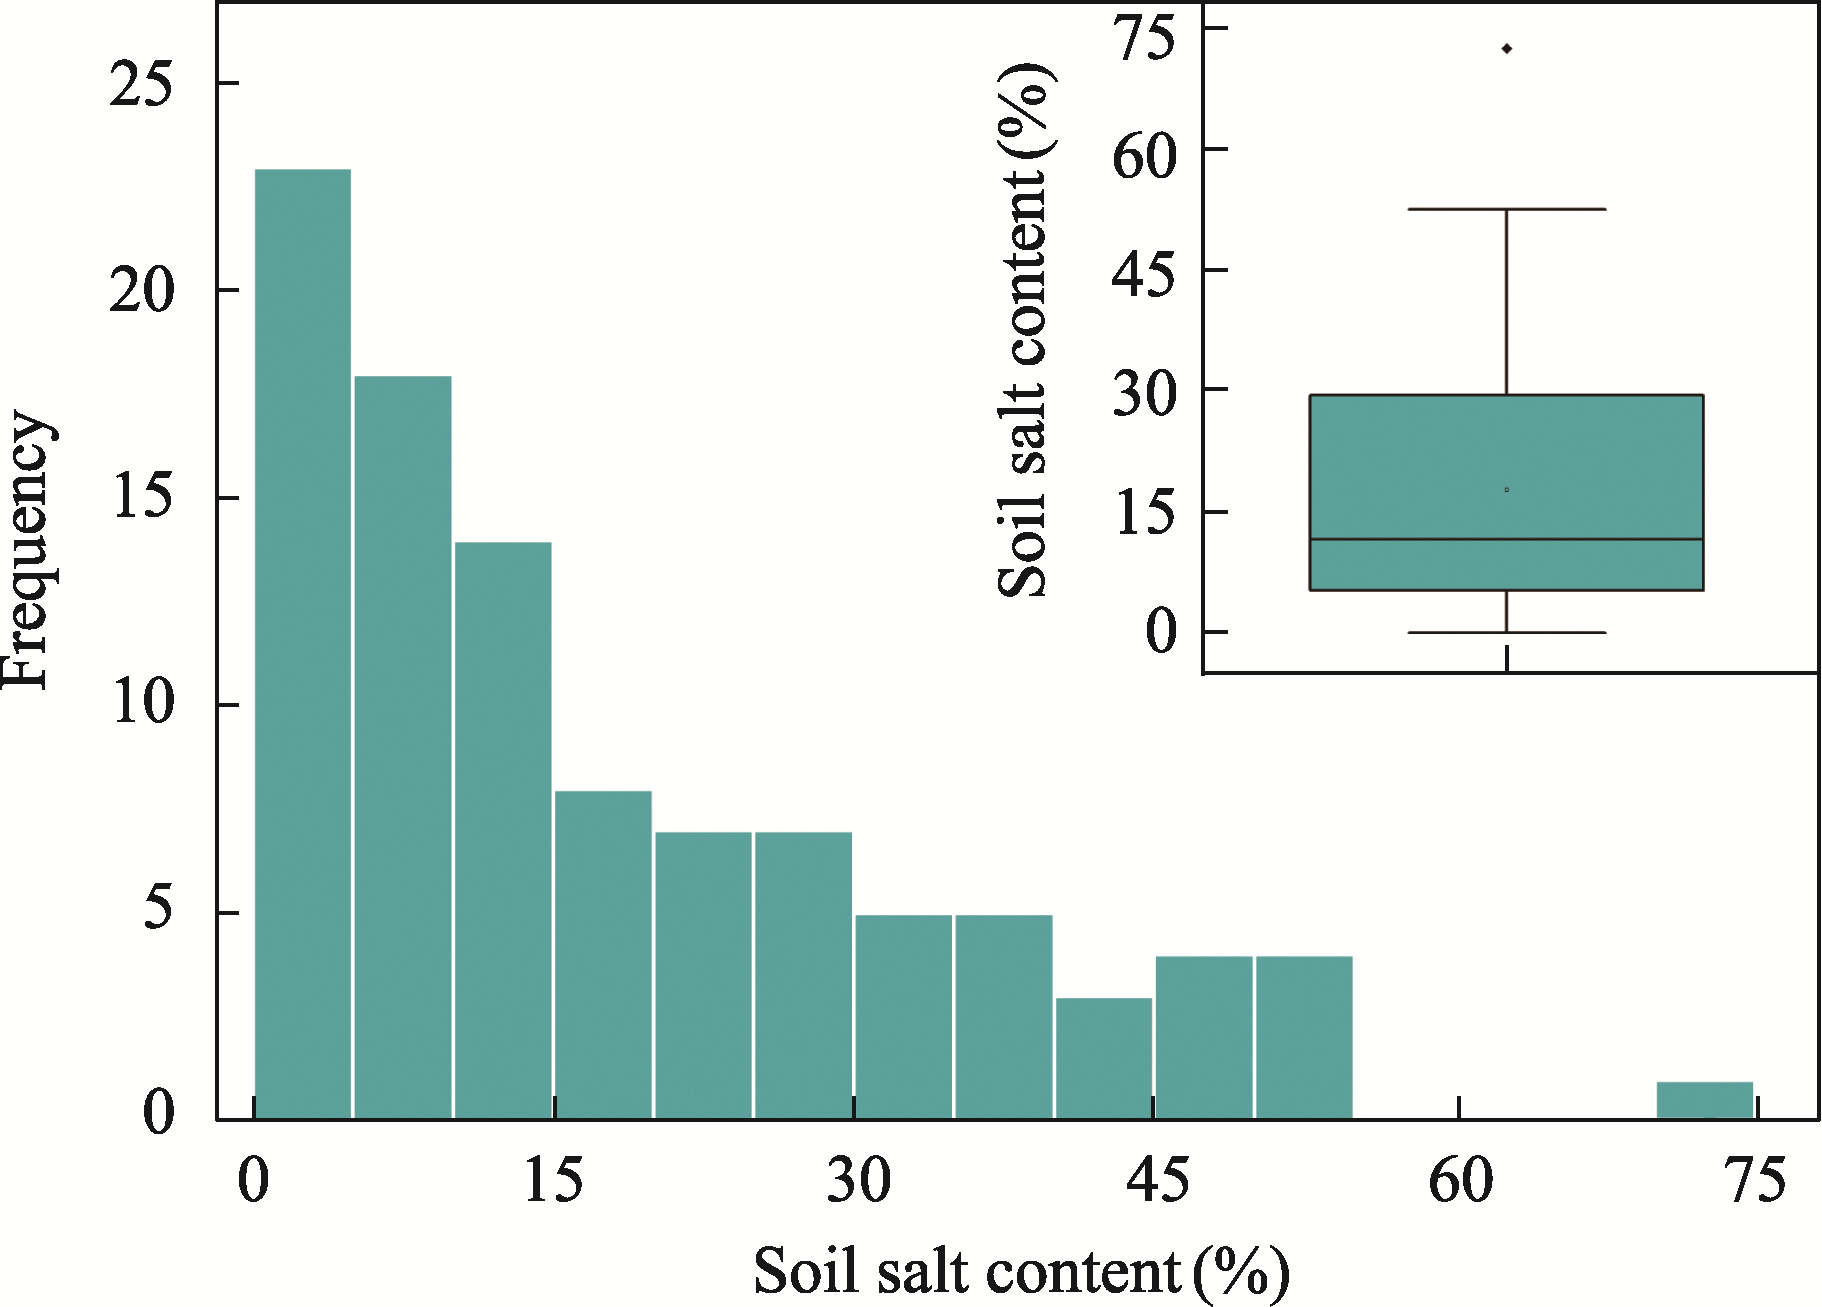
Figure 3
Distribution of soil salinity in the study area
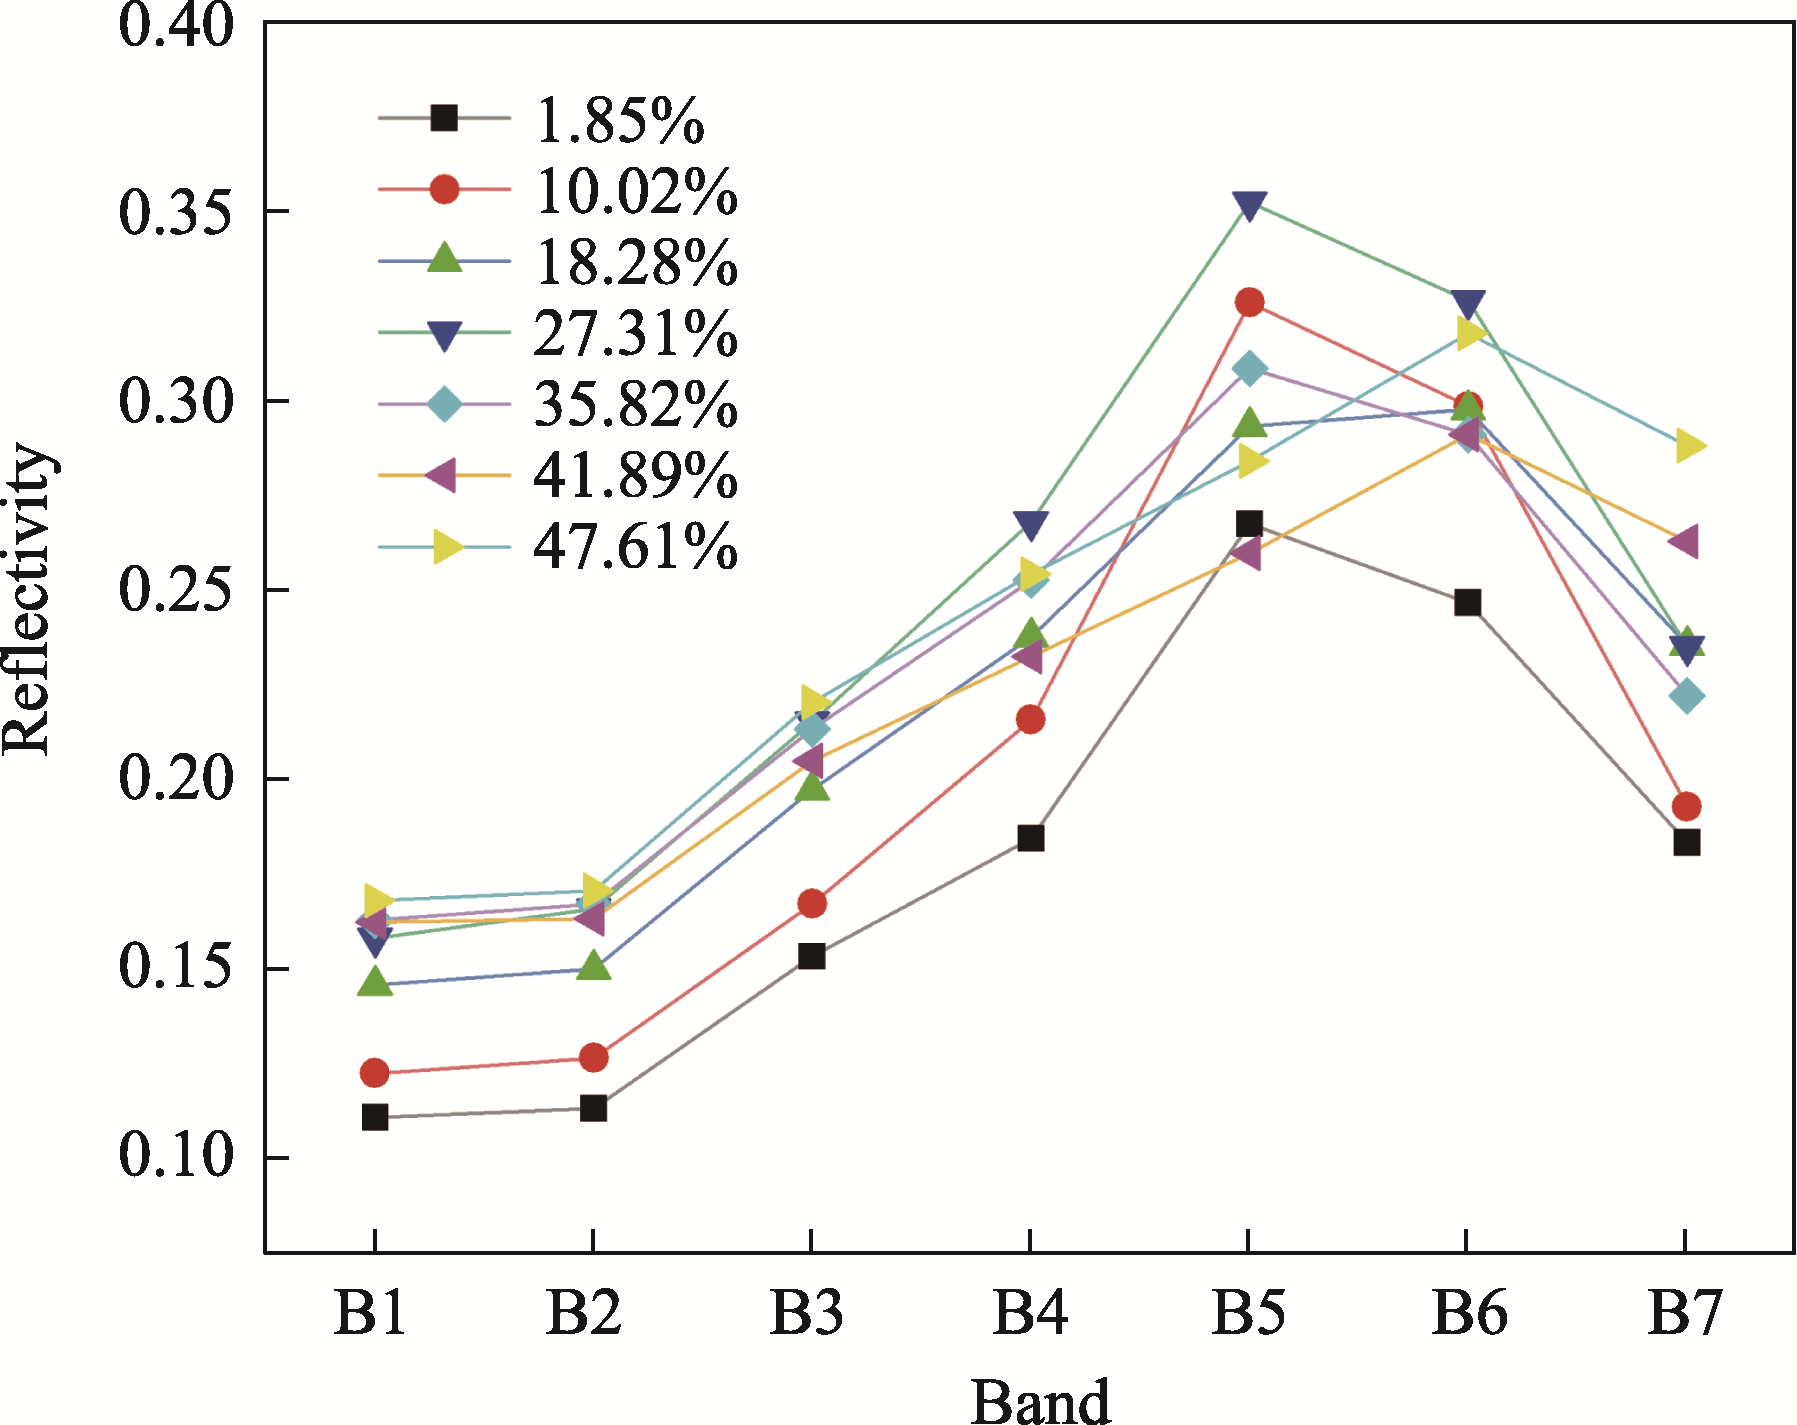
Figure 4
Multispectral reflectance curves for varying soil salinity levels
Table 3
Correlation coefficient between various factors and salt content
Table 4
Multicollinear factors and their VIFs
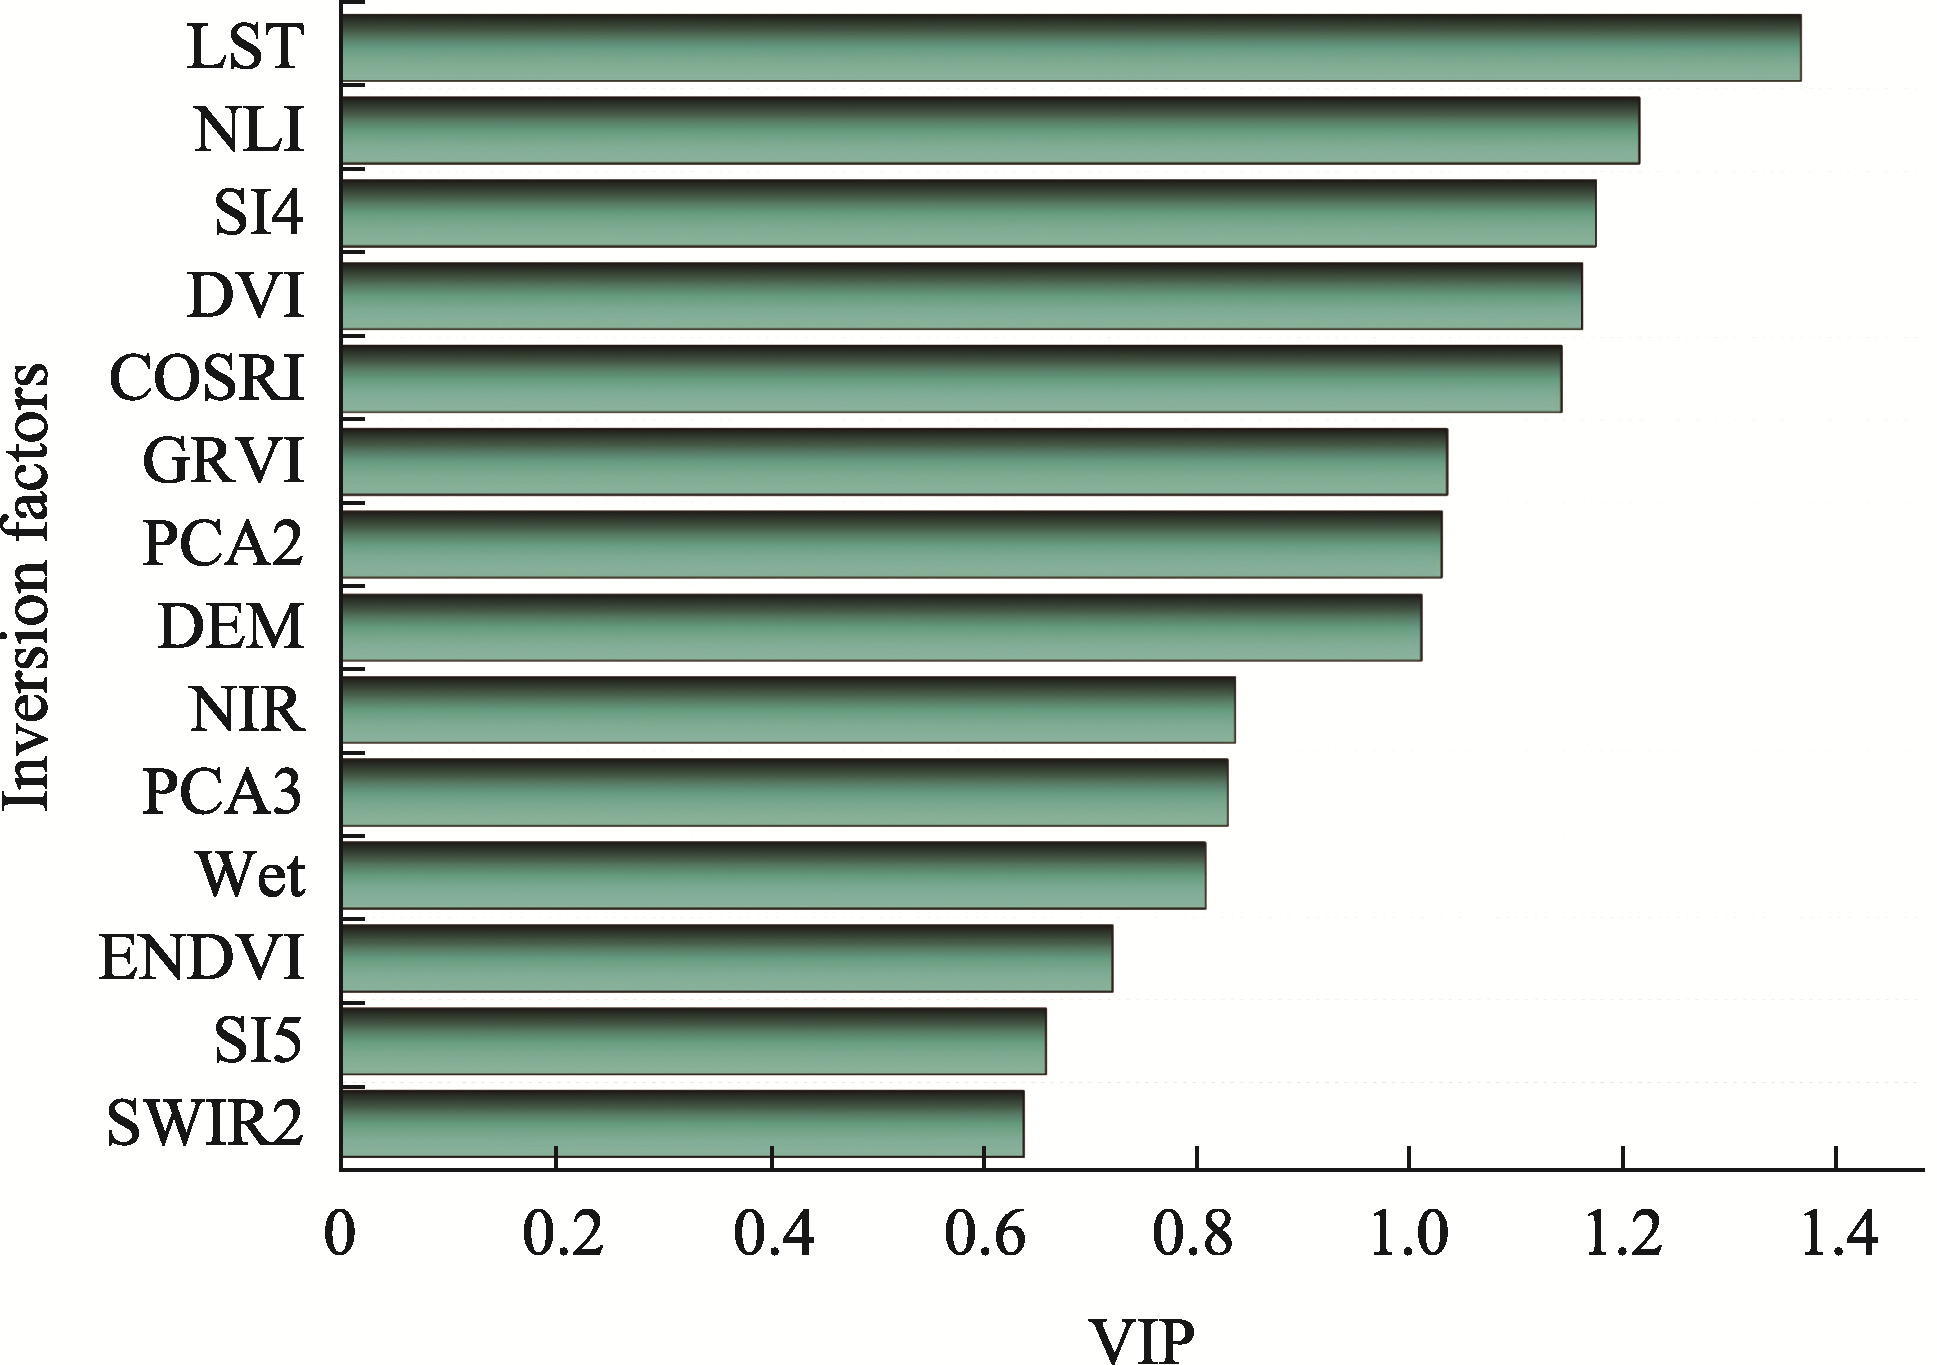
Figure 5
The VIP values of 14 inversion factors related to soil salinization
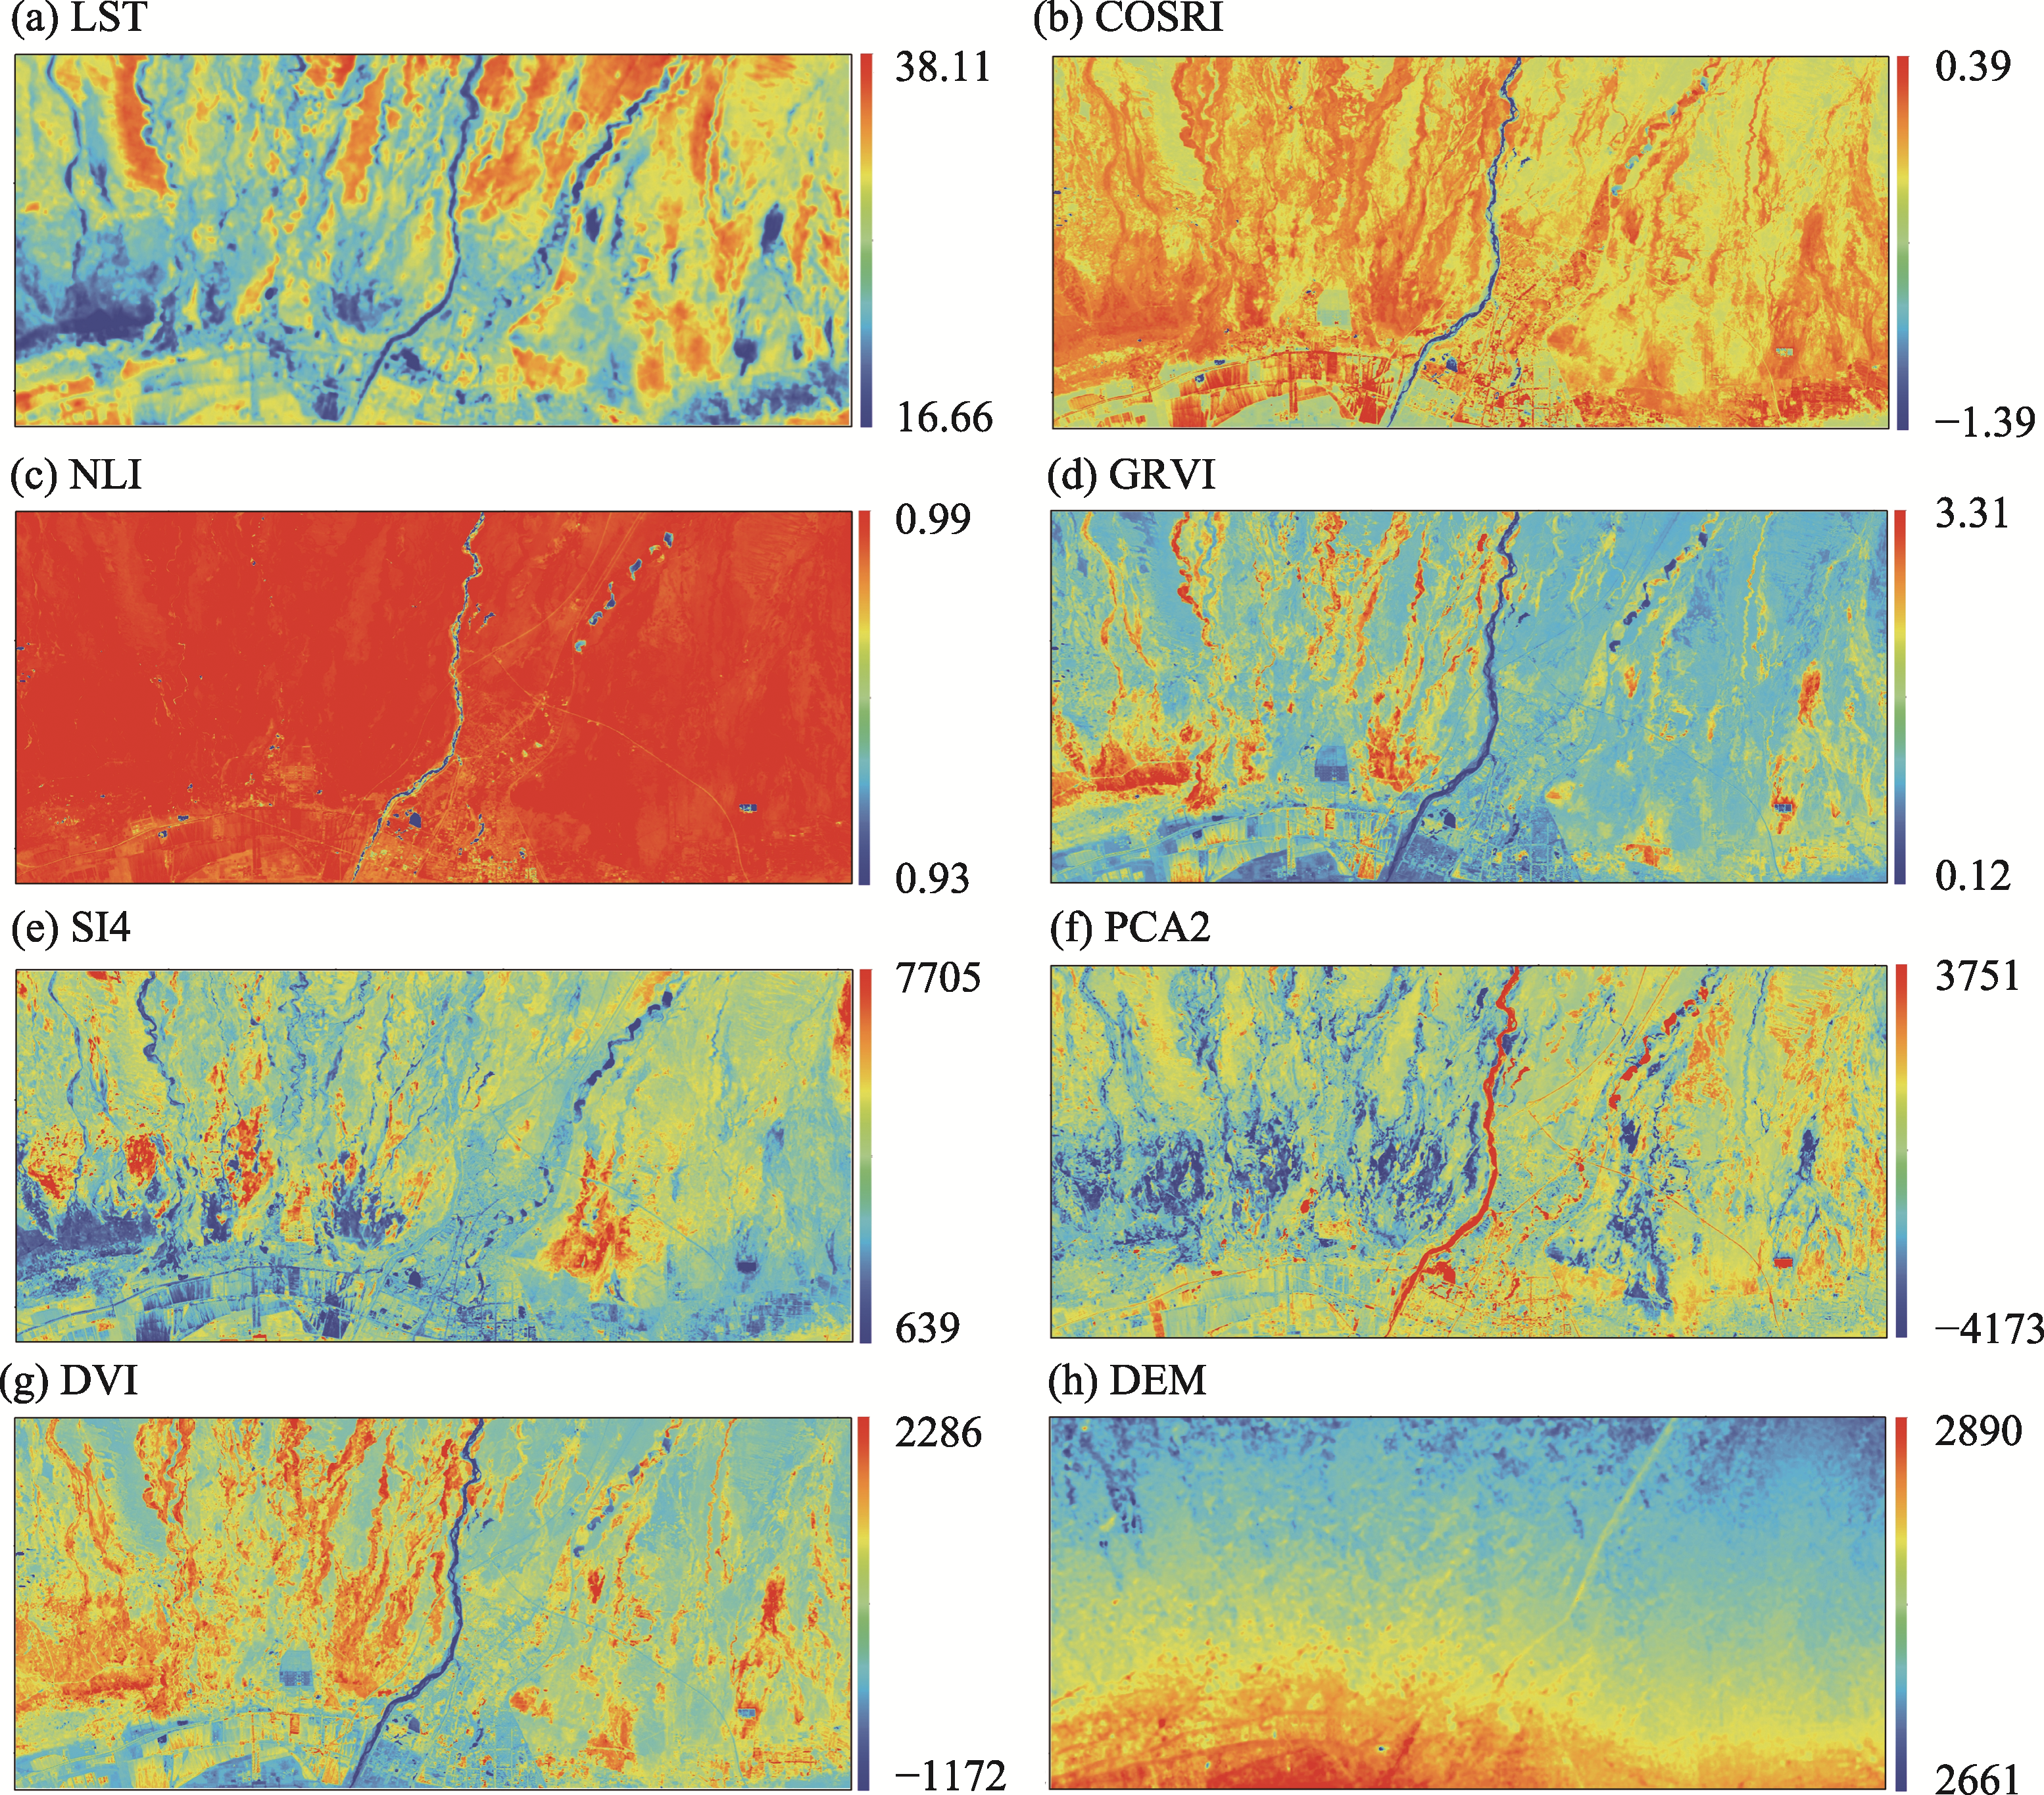
Figure 6
The eight key factors (COSRI, NLI, DVI, GRVI, DEM, SI4, PCA2 and LST) for soil salinization modeling
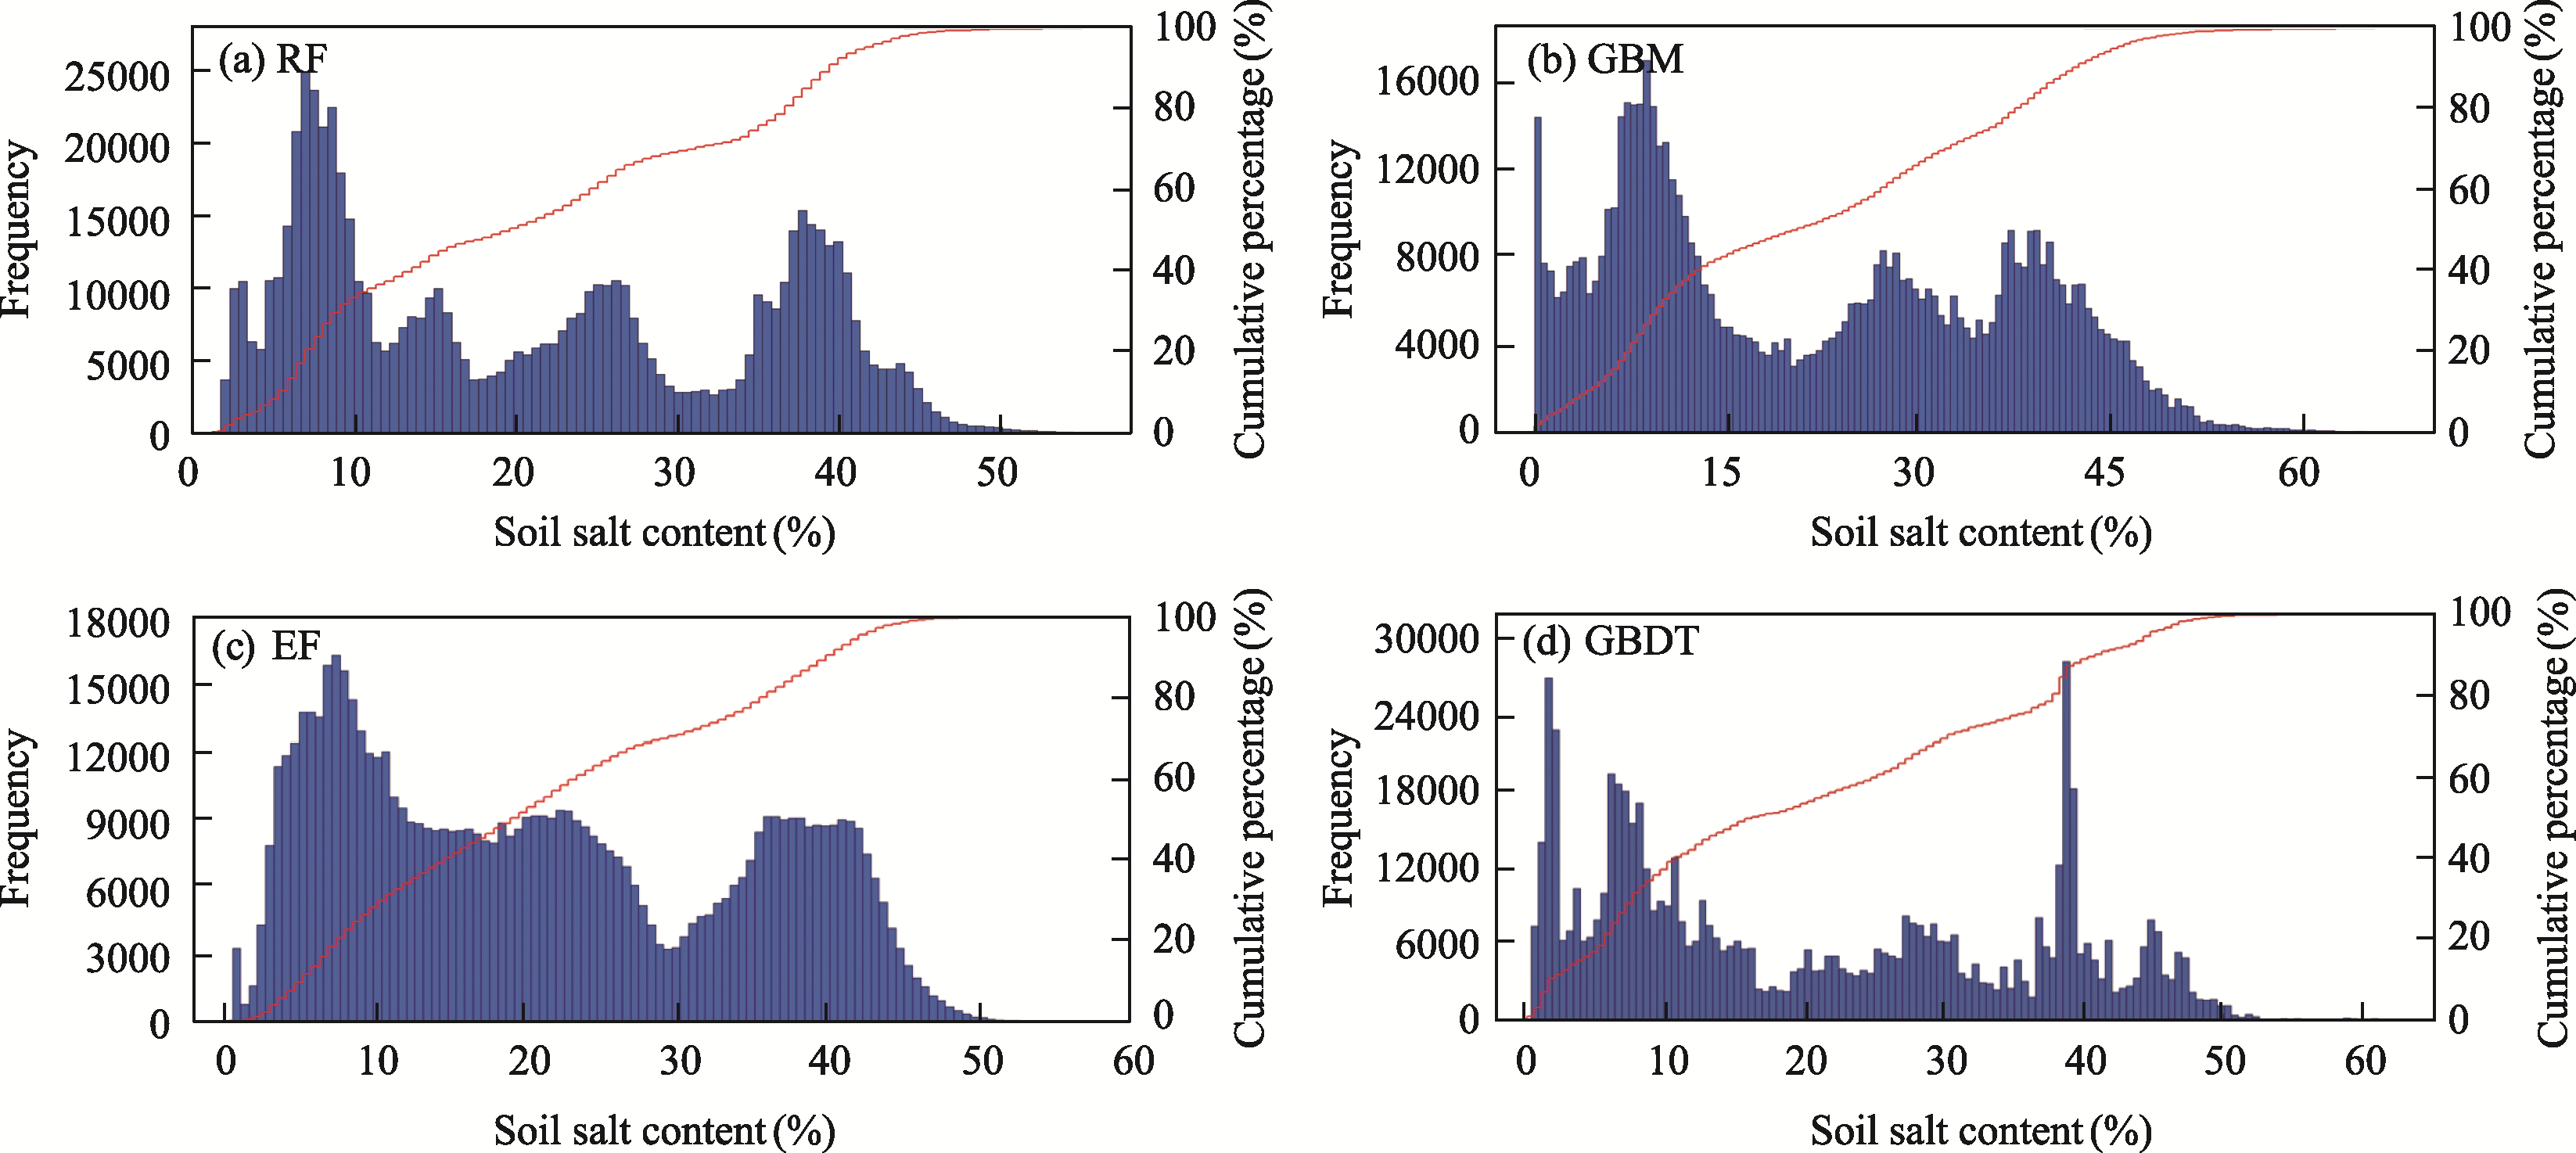
Figure 8
Predicted soil salt content histograms from four inversion models (RF, GBM, EF and GBDT)
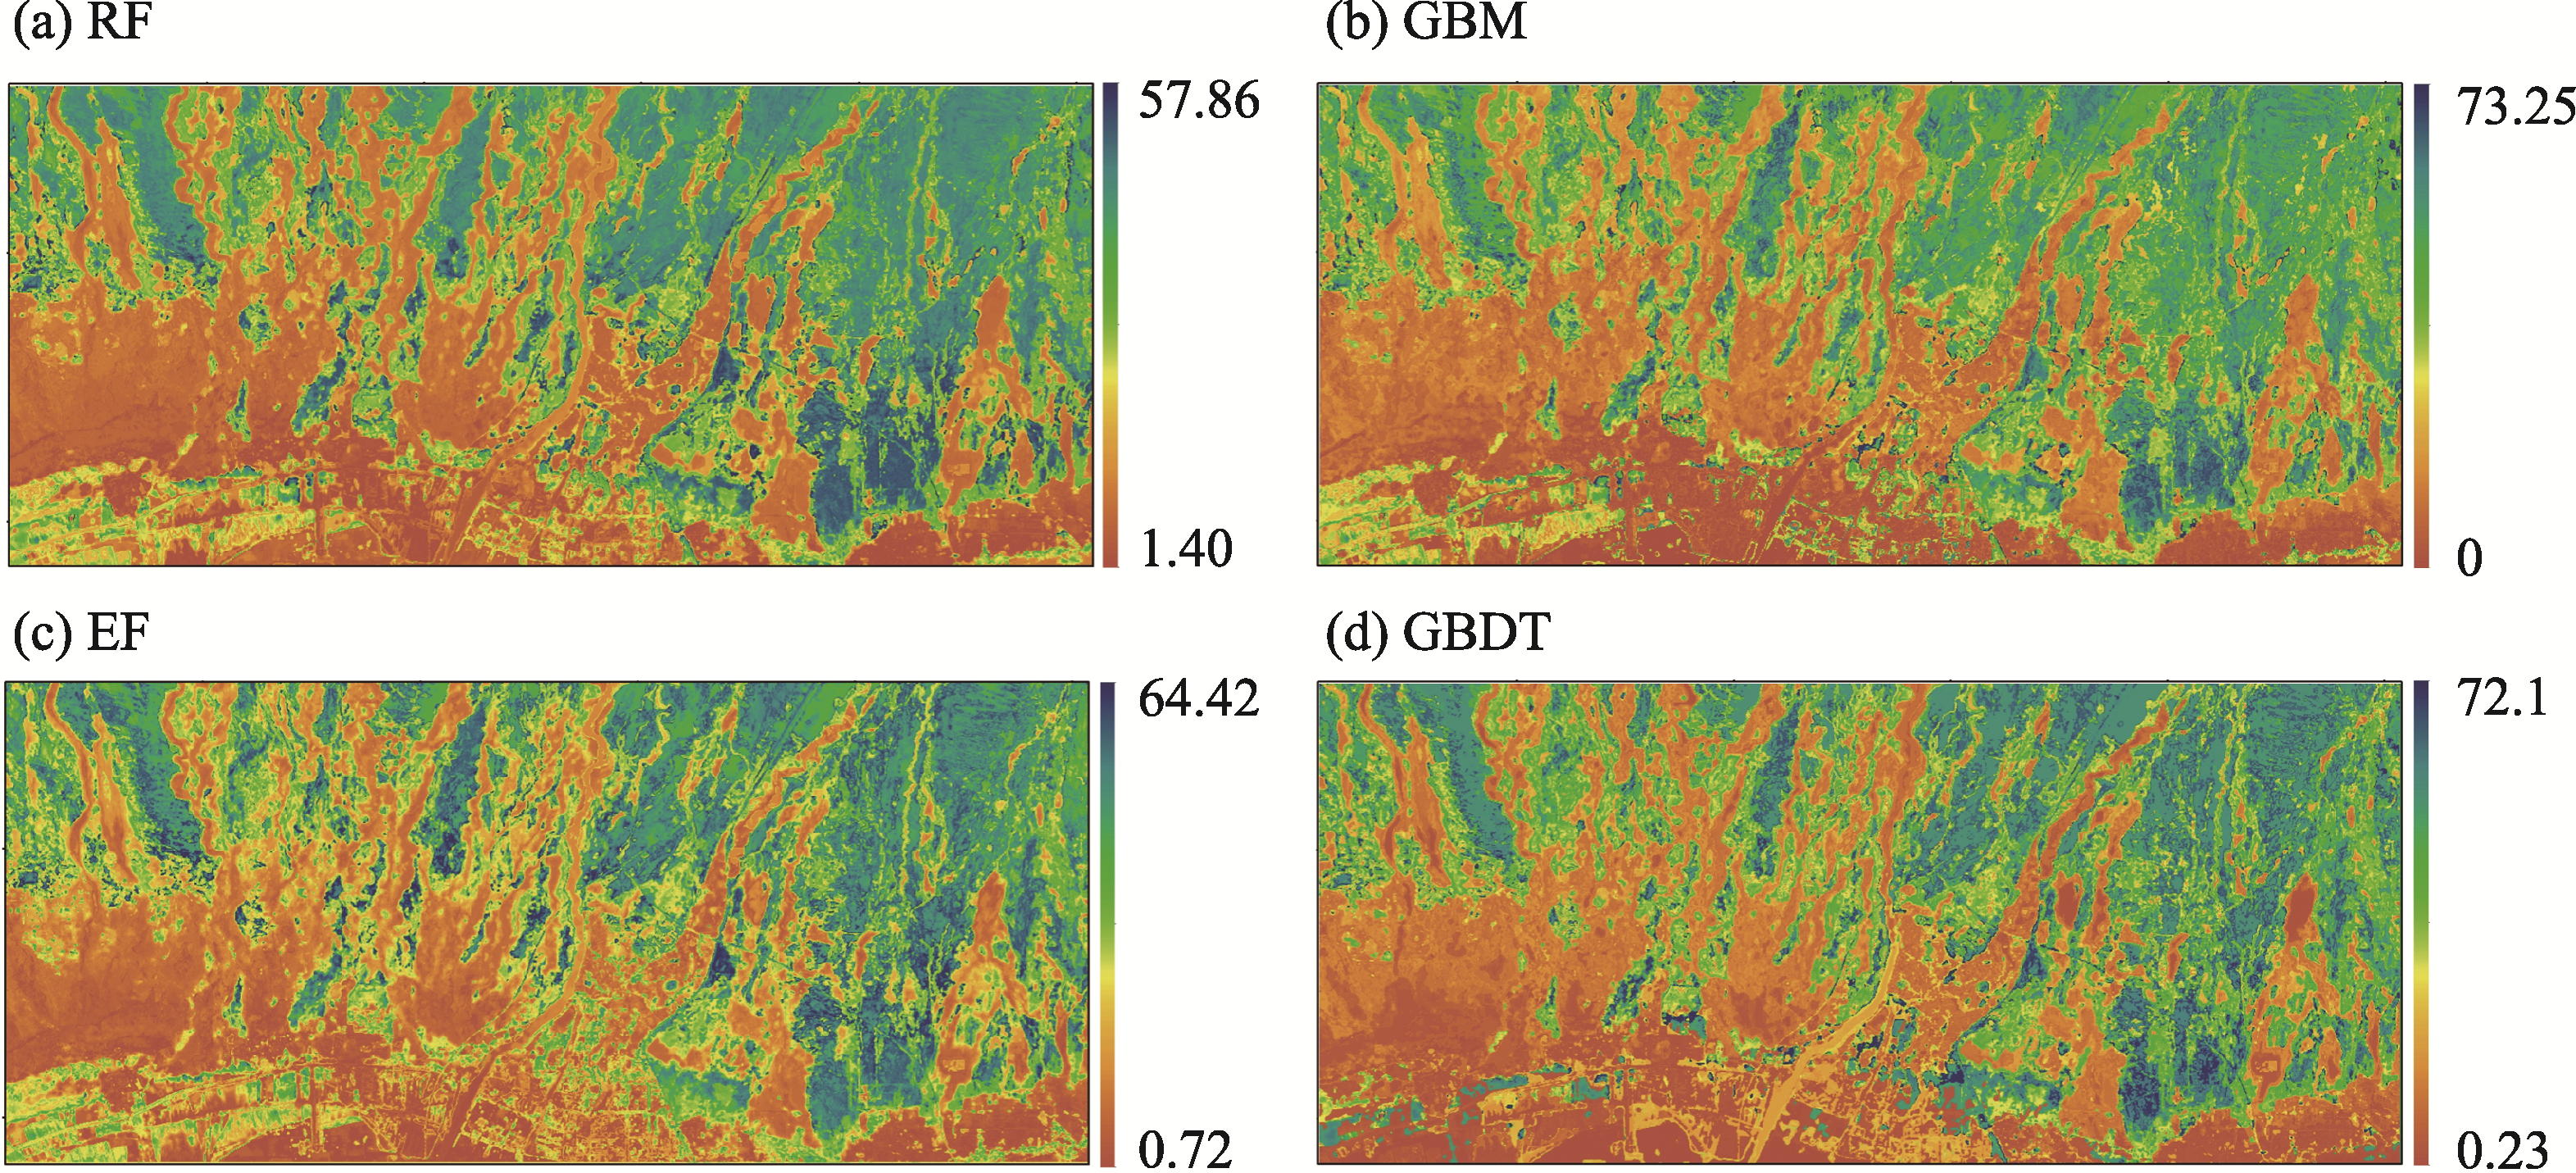
Figure 9
Spatial distribution of soil salinization using RF (a), GBM (b), EF (c) and GBDT (d) models
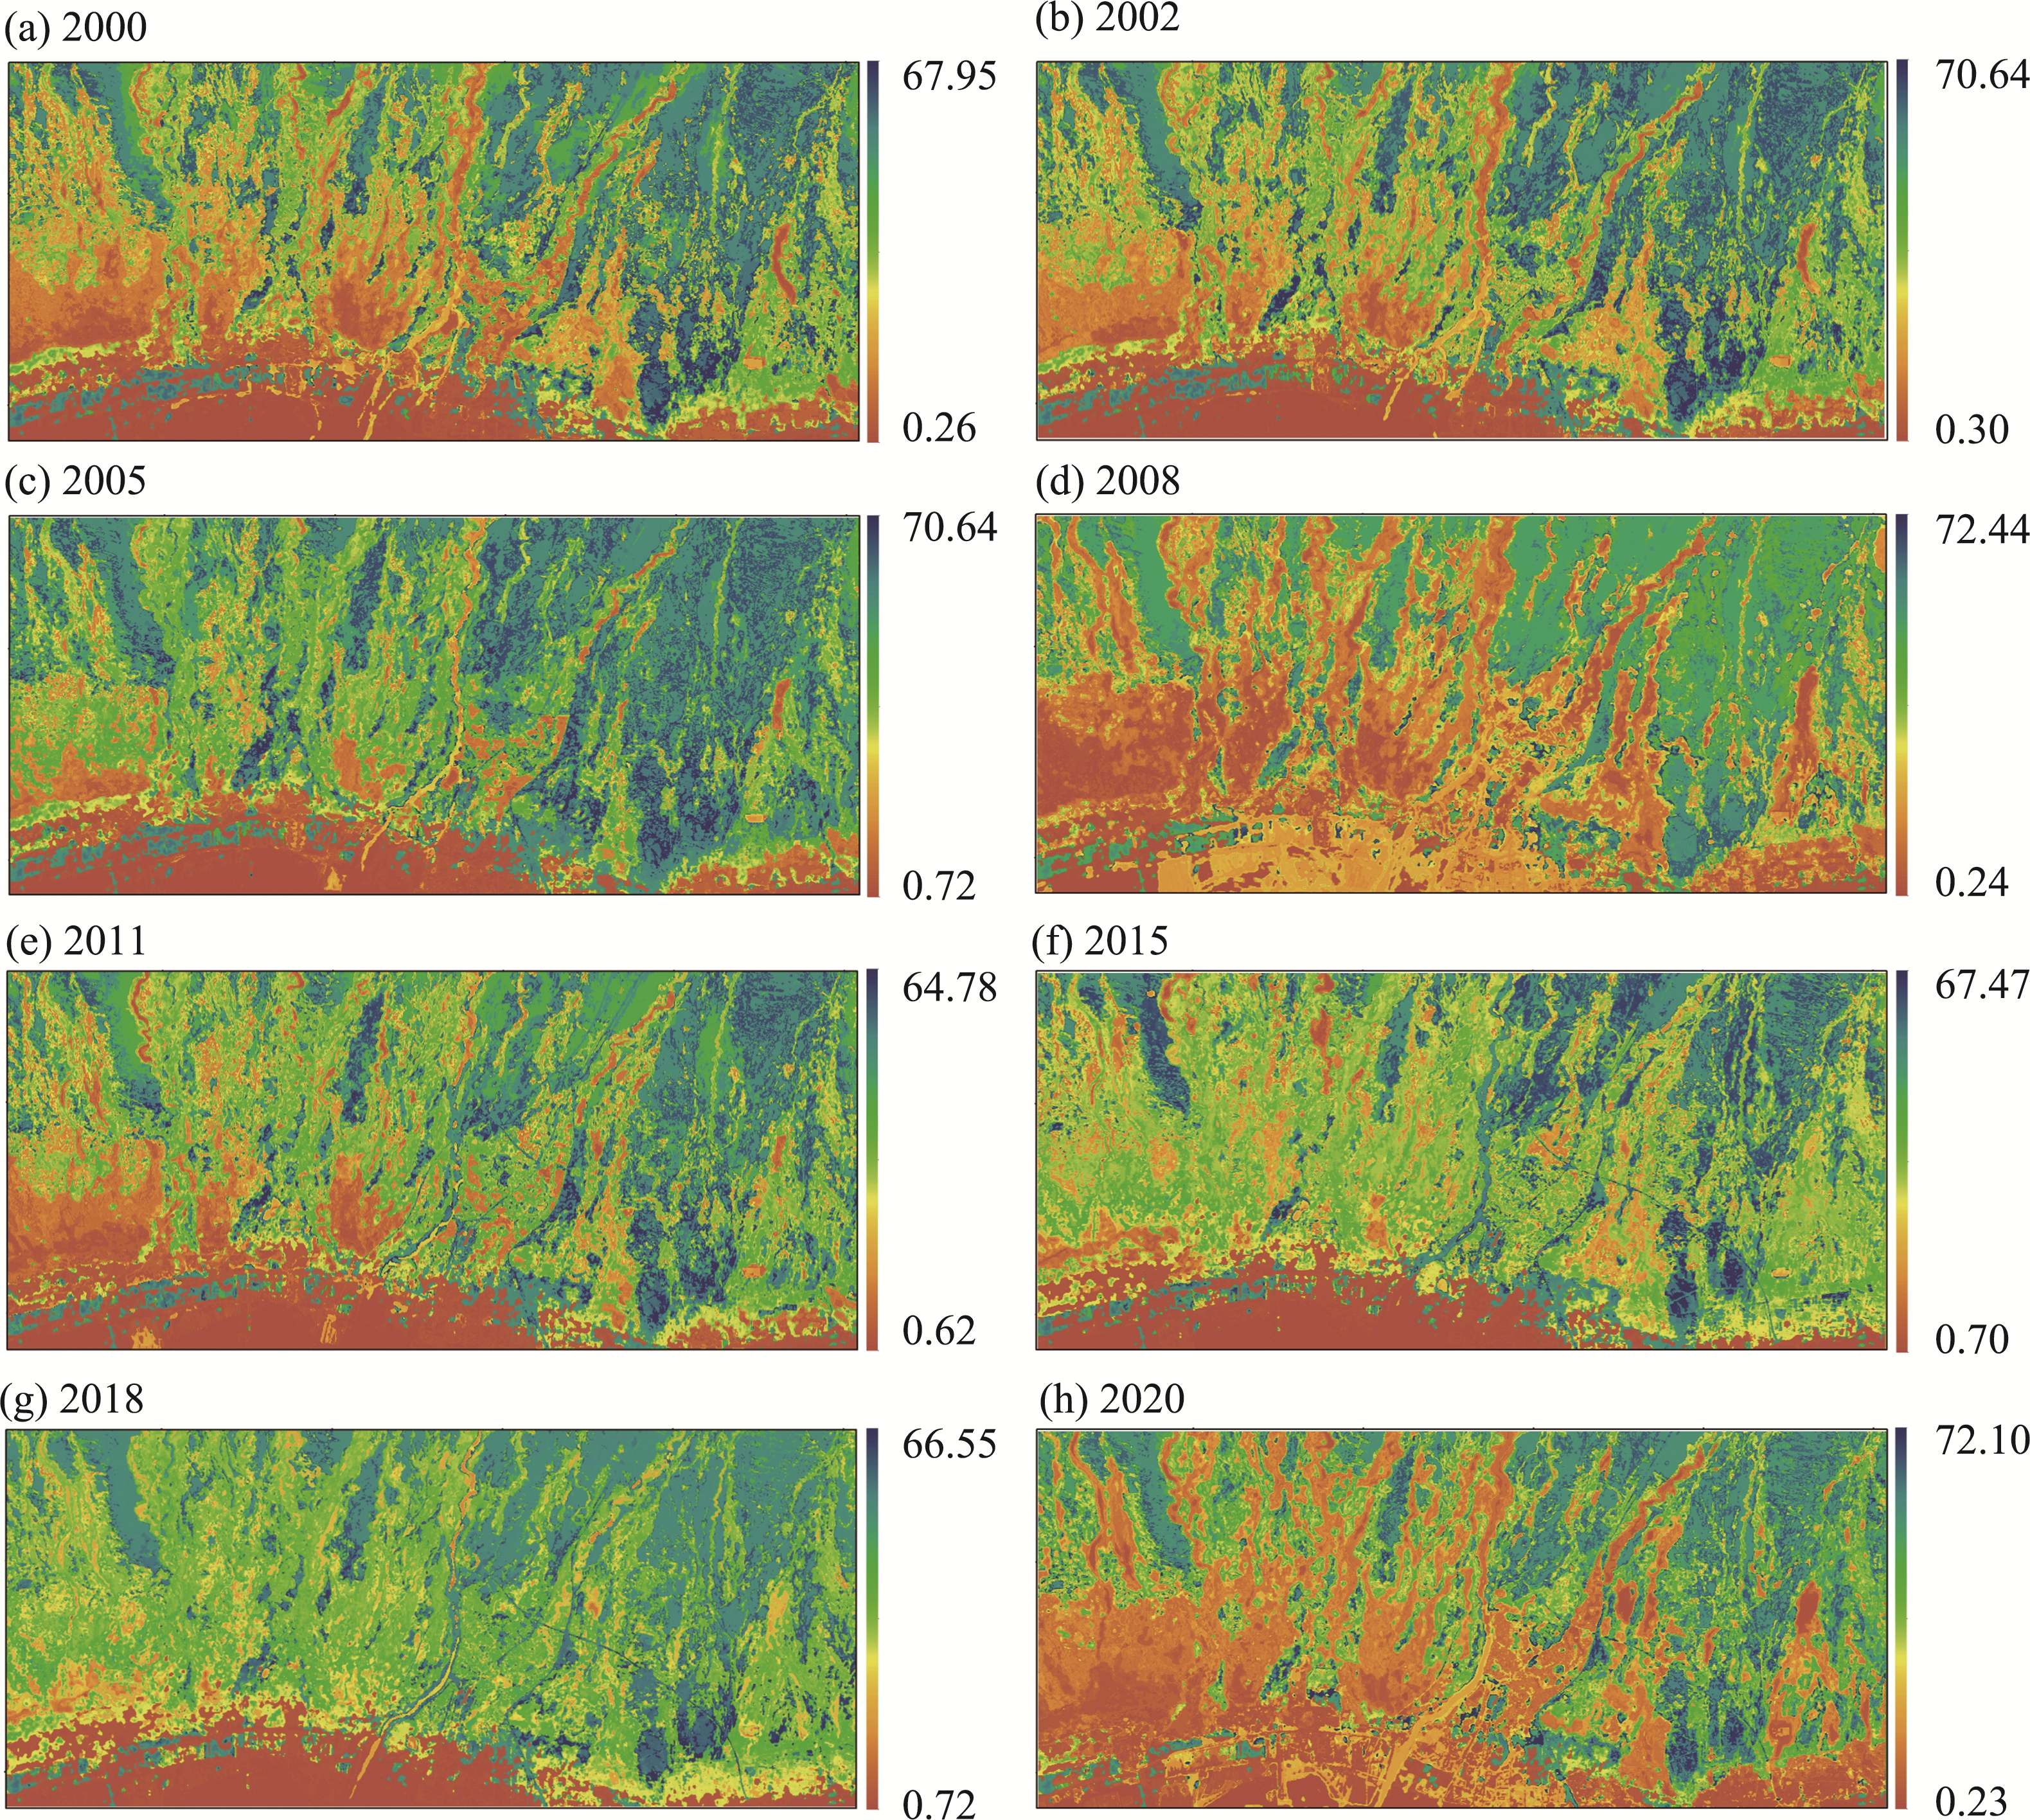
Figure 10
Spatial distribution of soil salinization in the middle and lower reaches of the Golmud River from 2000 to 2020
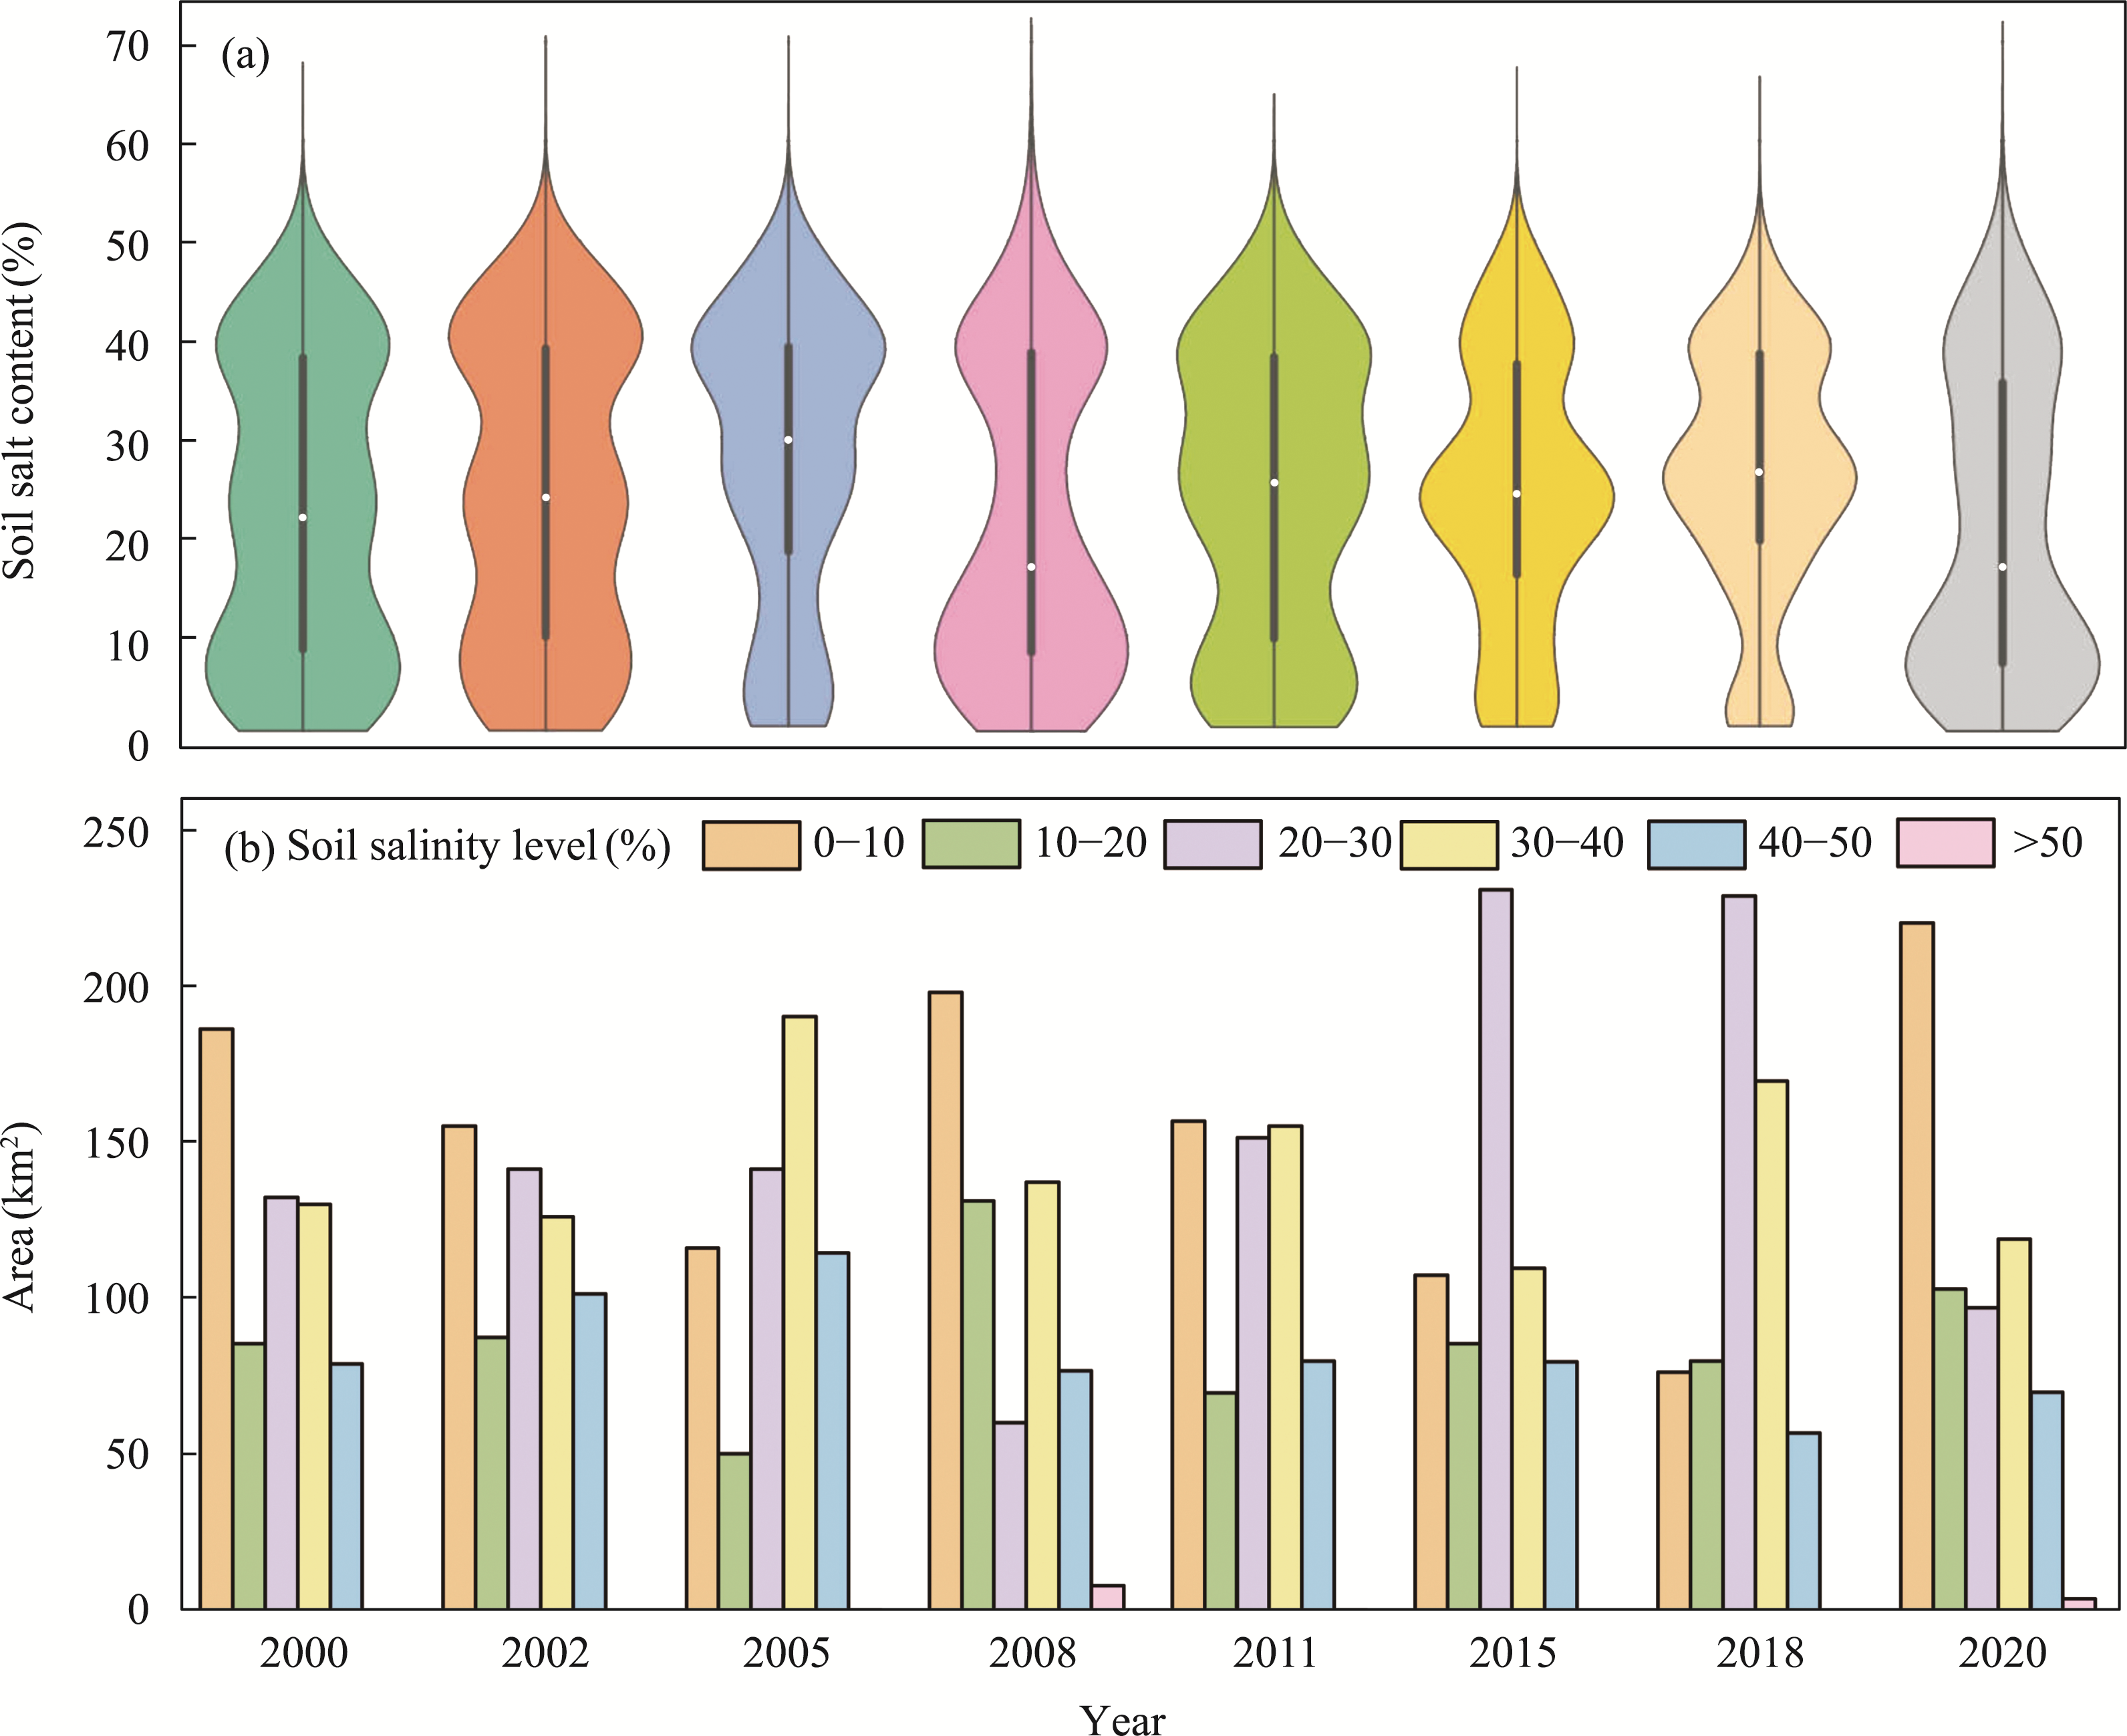
Figure 11
Distribution characteristics of soil salt content in various periods (a) and the area of different level of salinization (b)
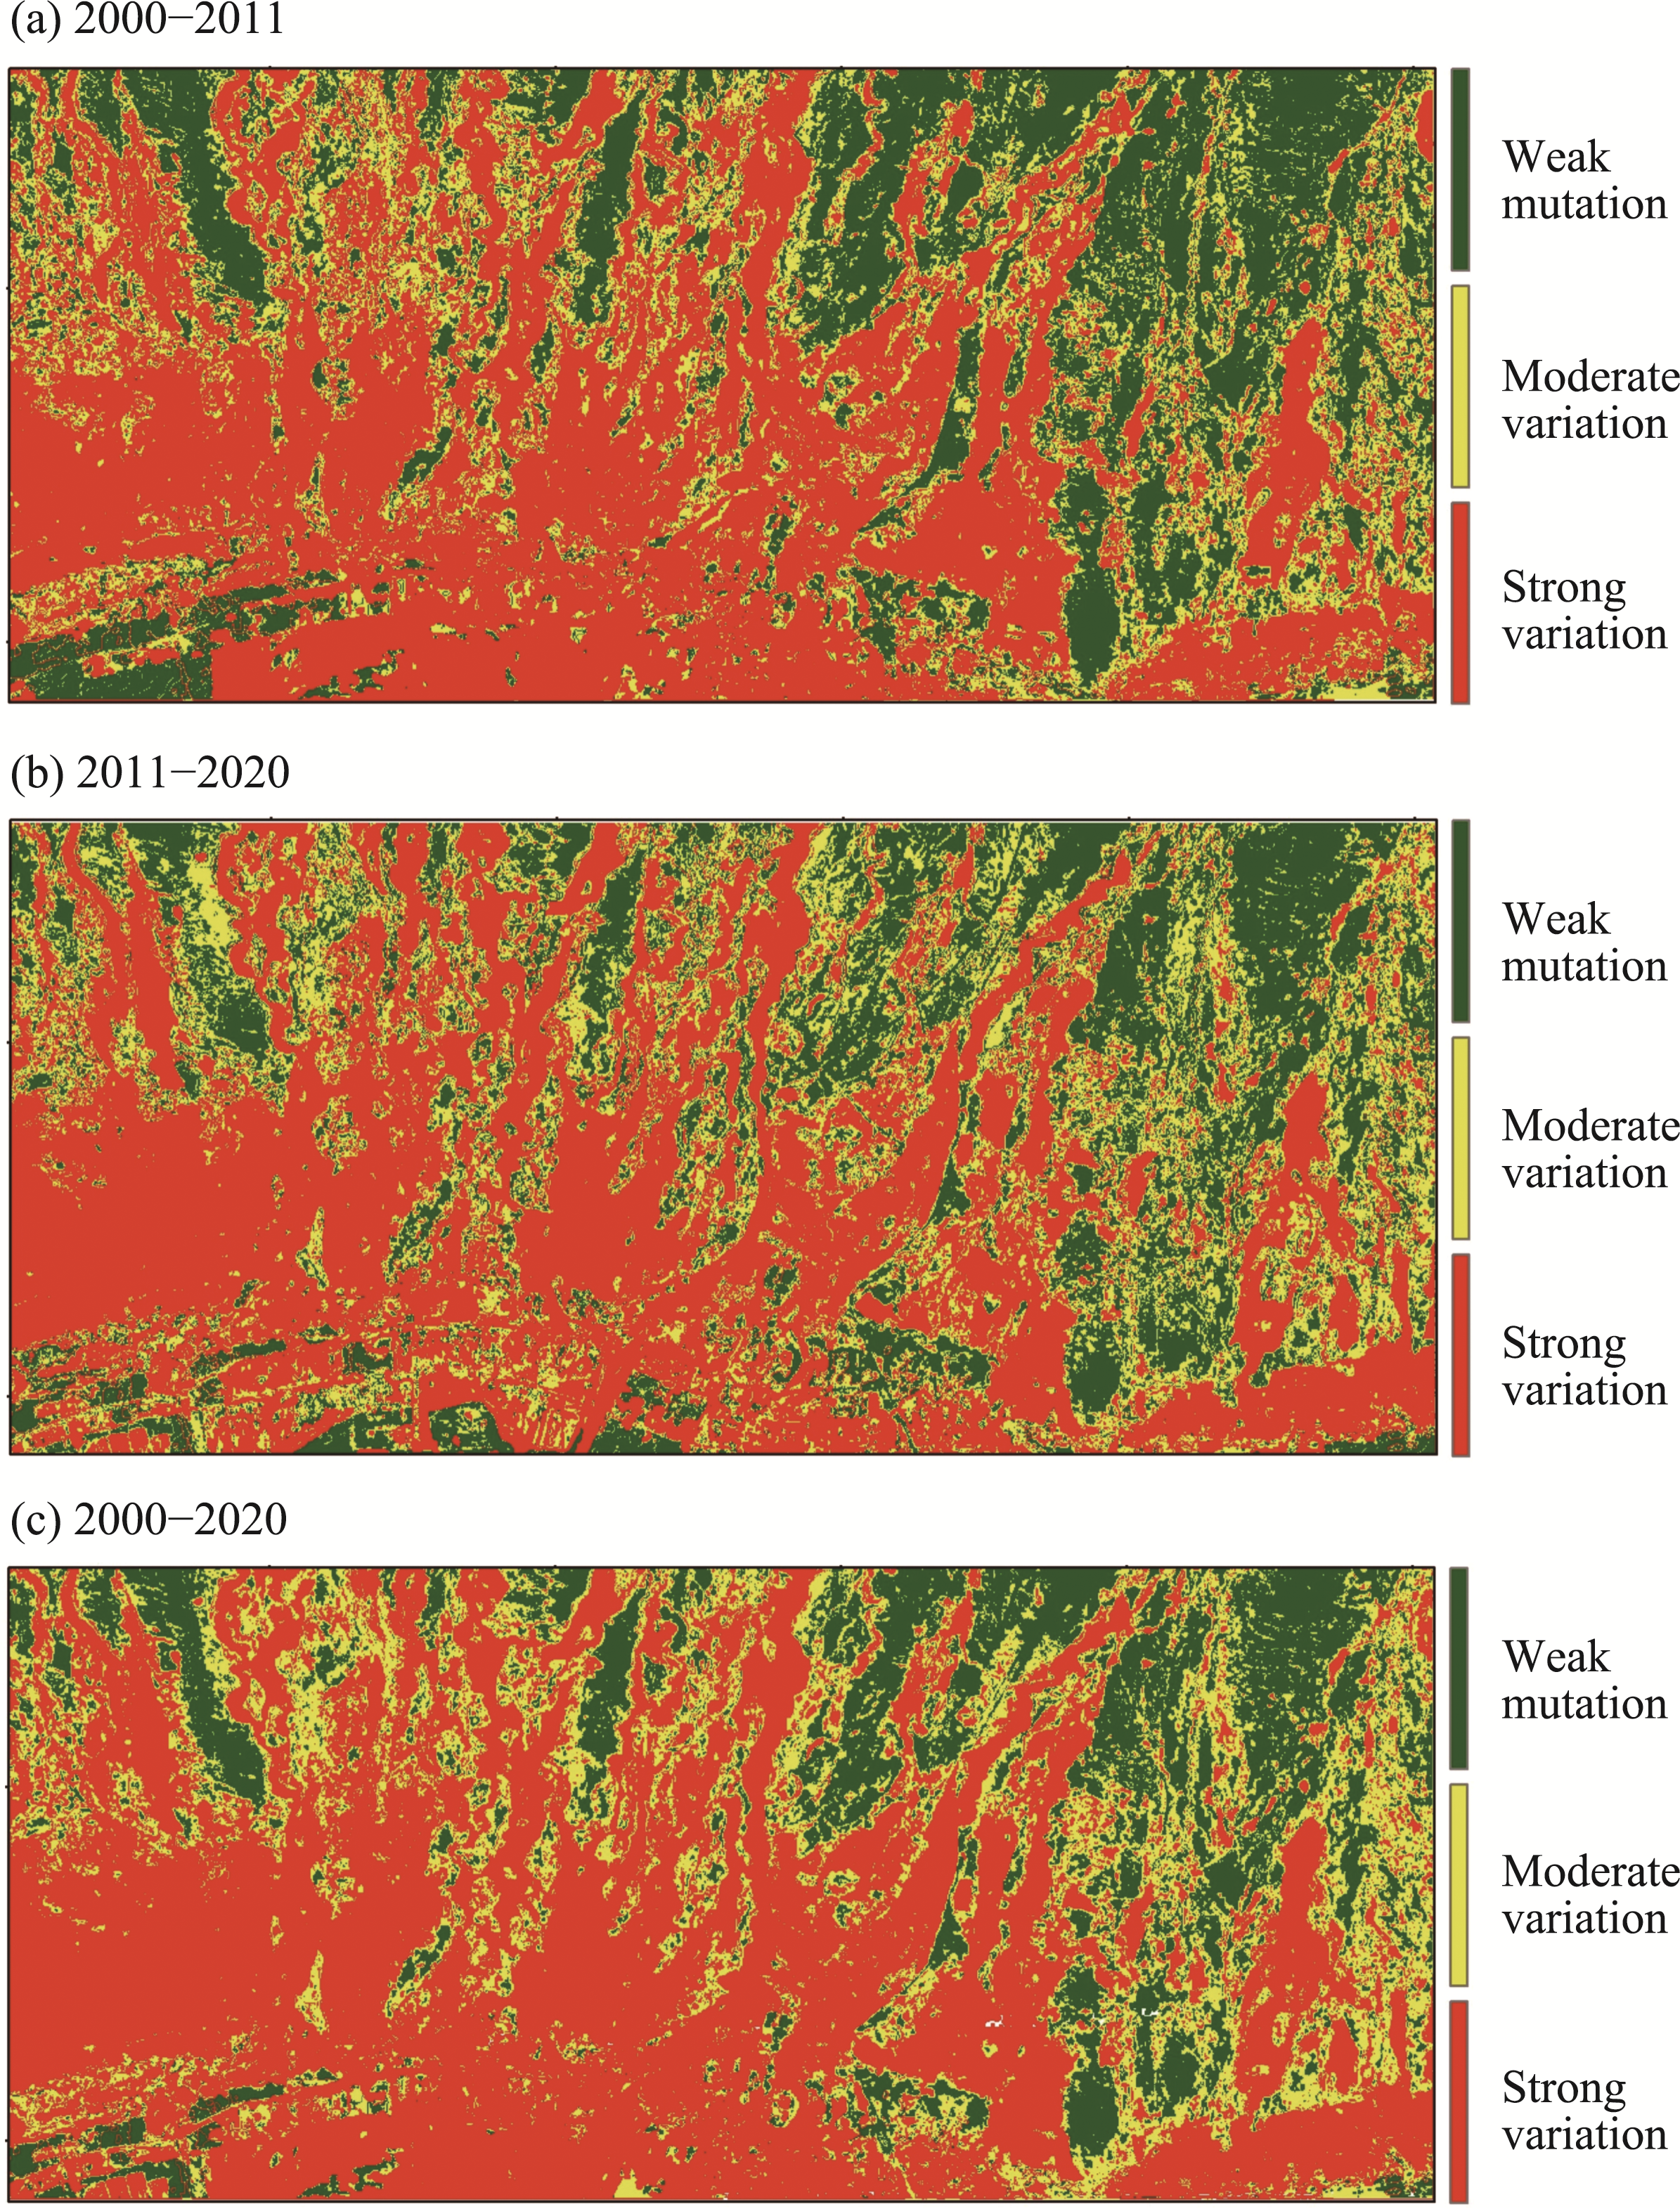
Figure 12
Spatial variability of soil salinization in the middle and lower reaches of the Golmud River from 2000 to 2020
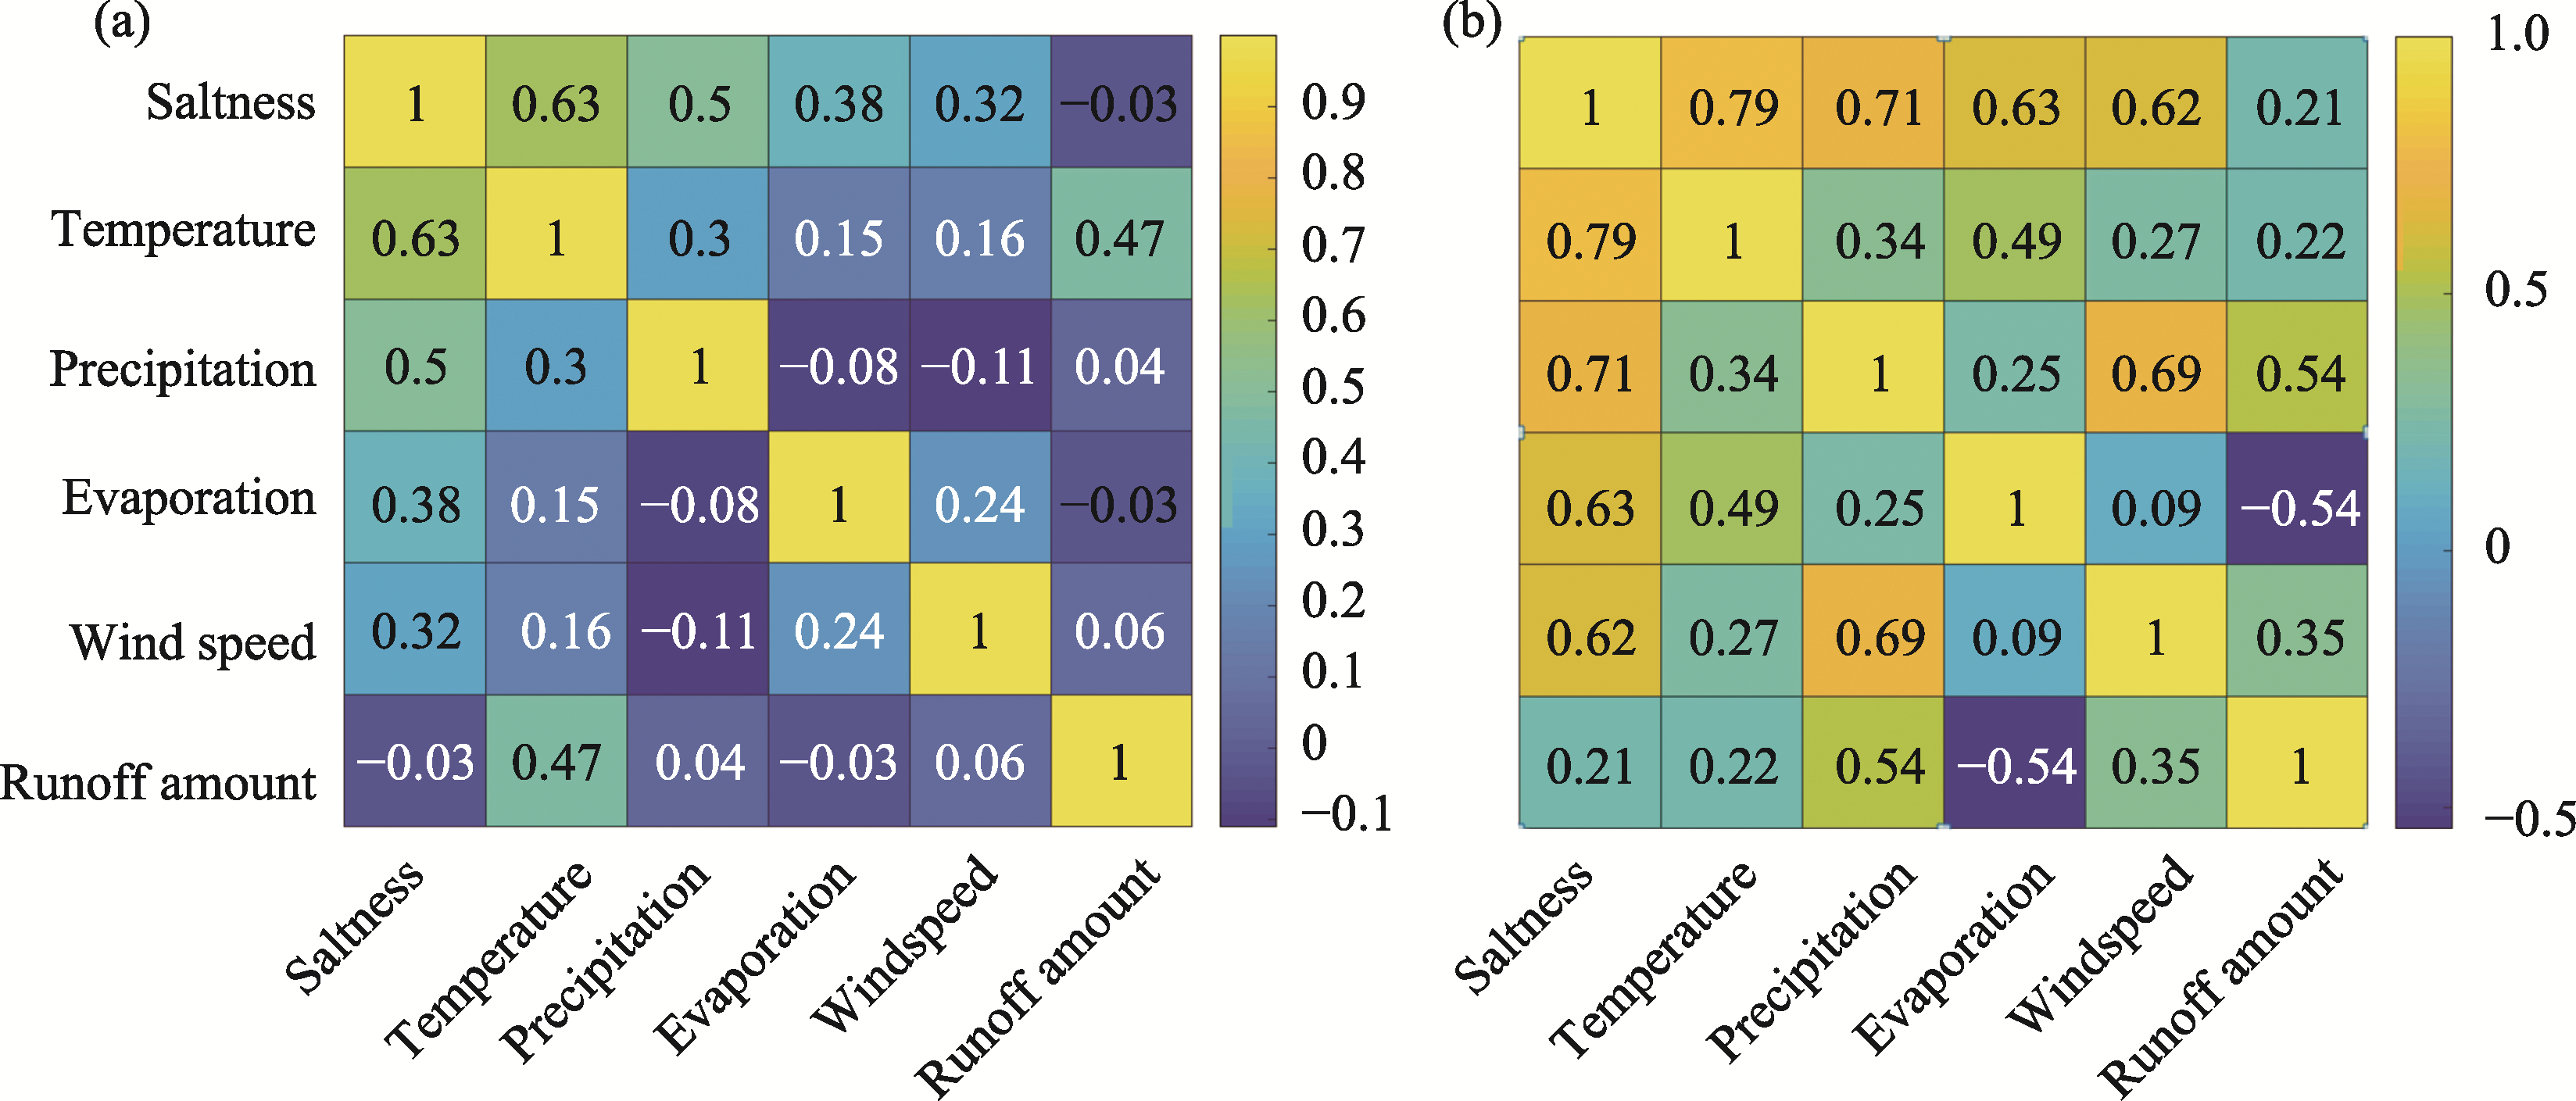
Figure 13
Correlation coefficient matrix between soil salinity and annual meteorological factors (a) and monthly meteorological factors (b)