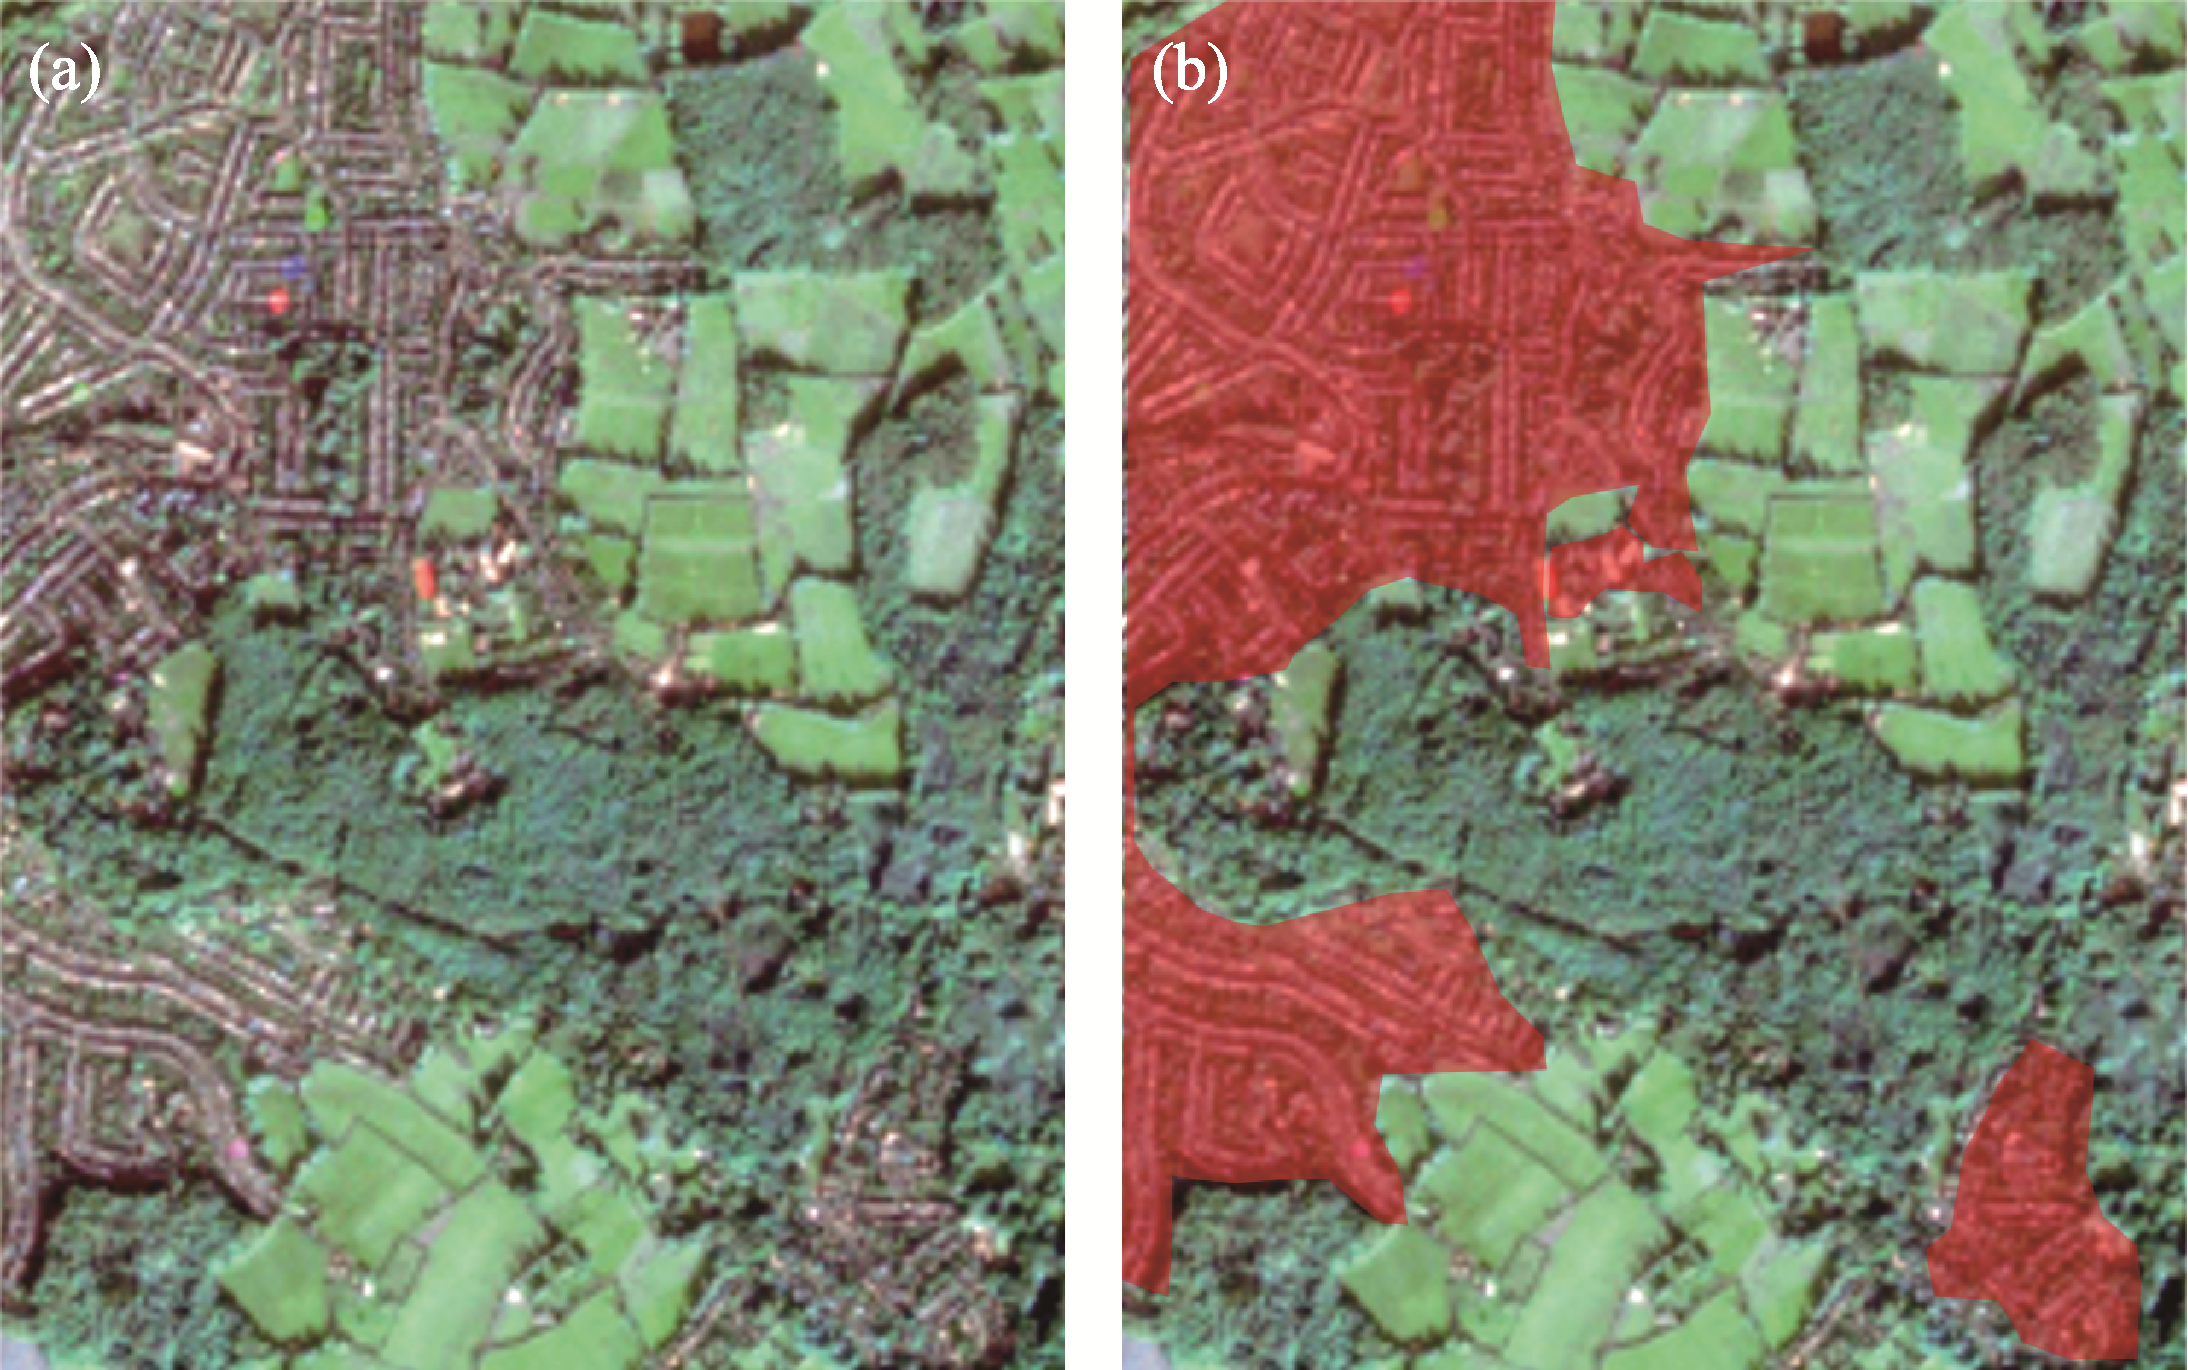
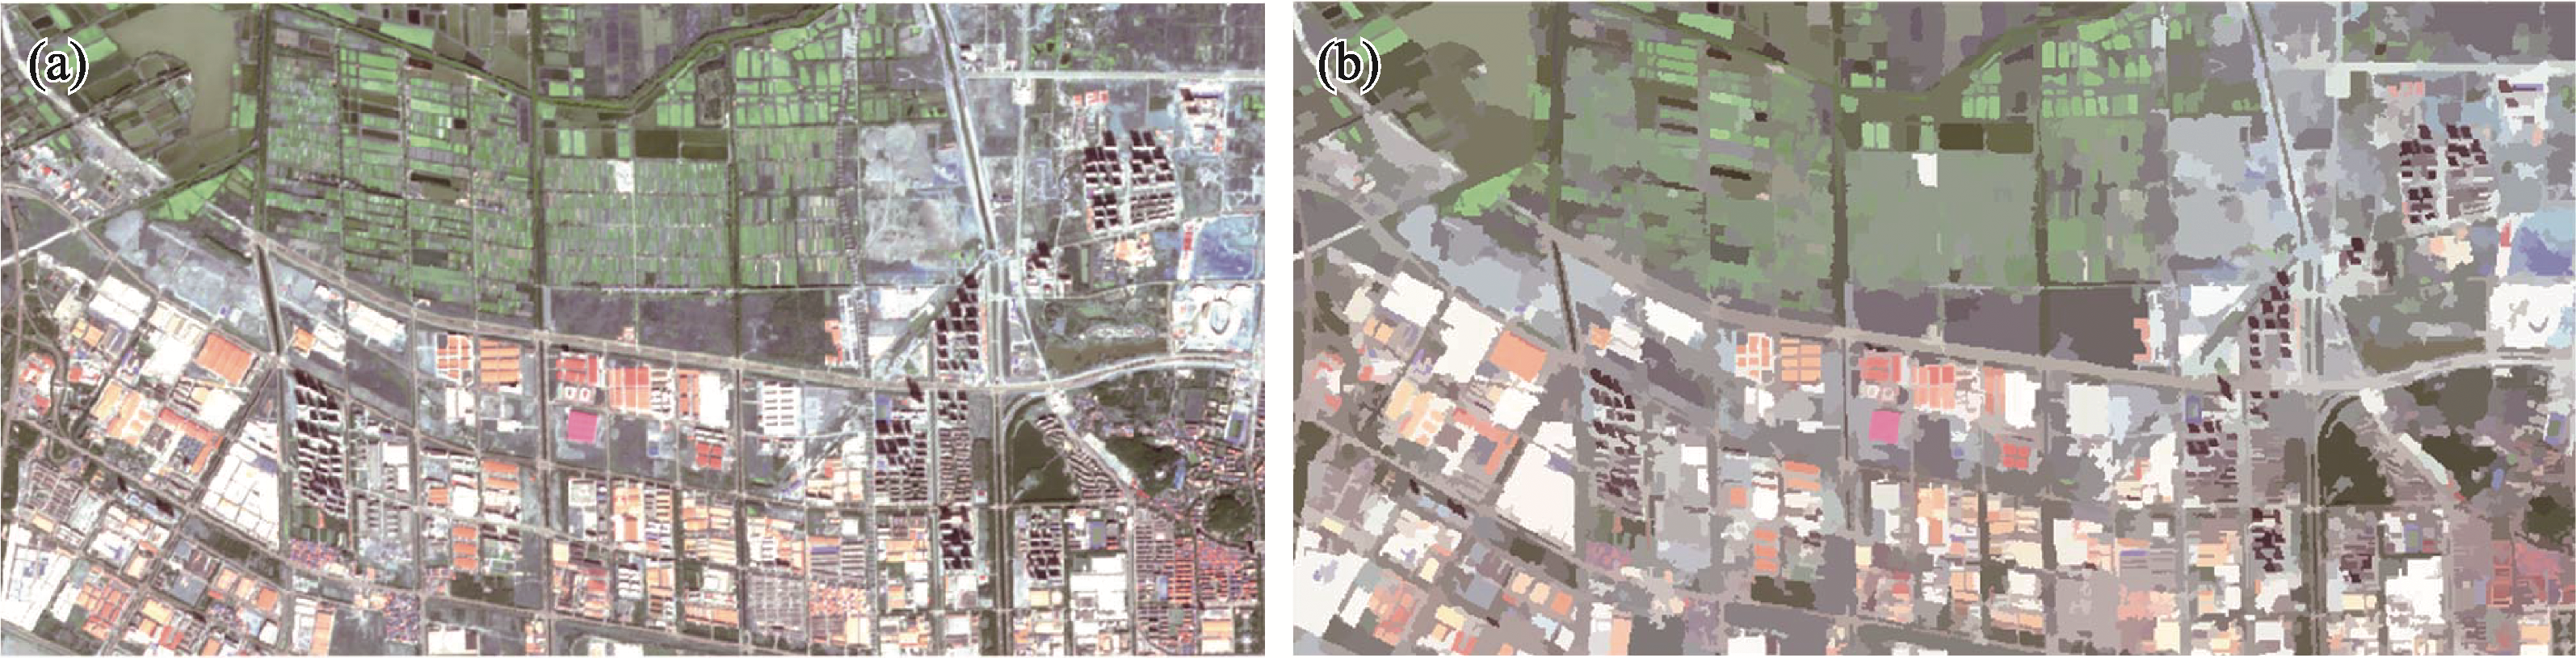
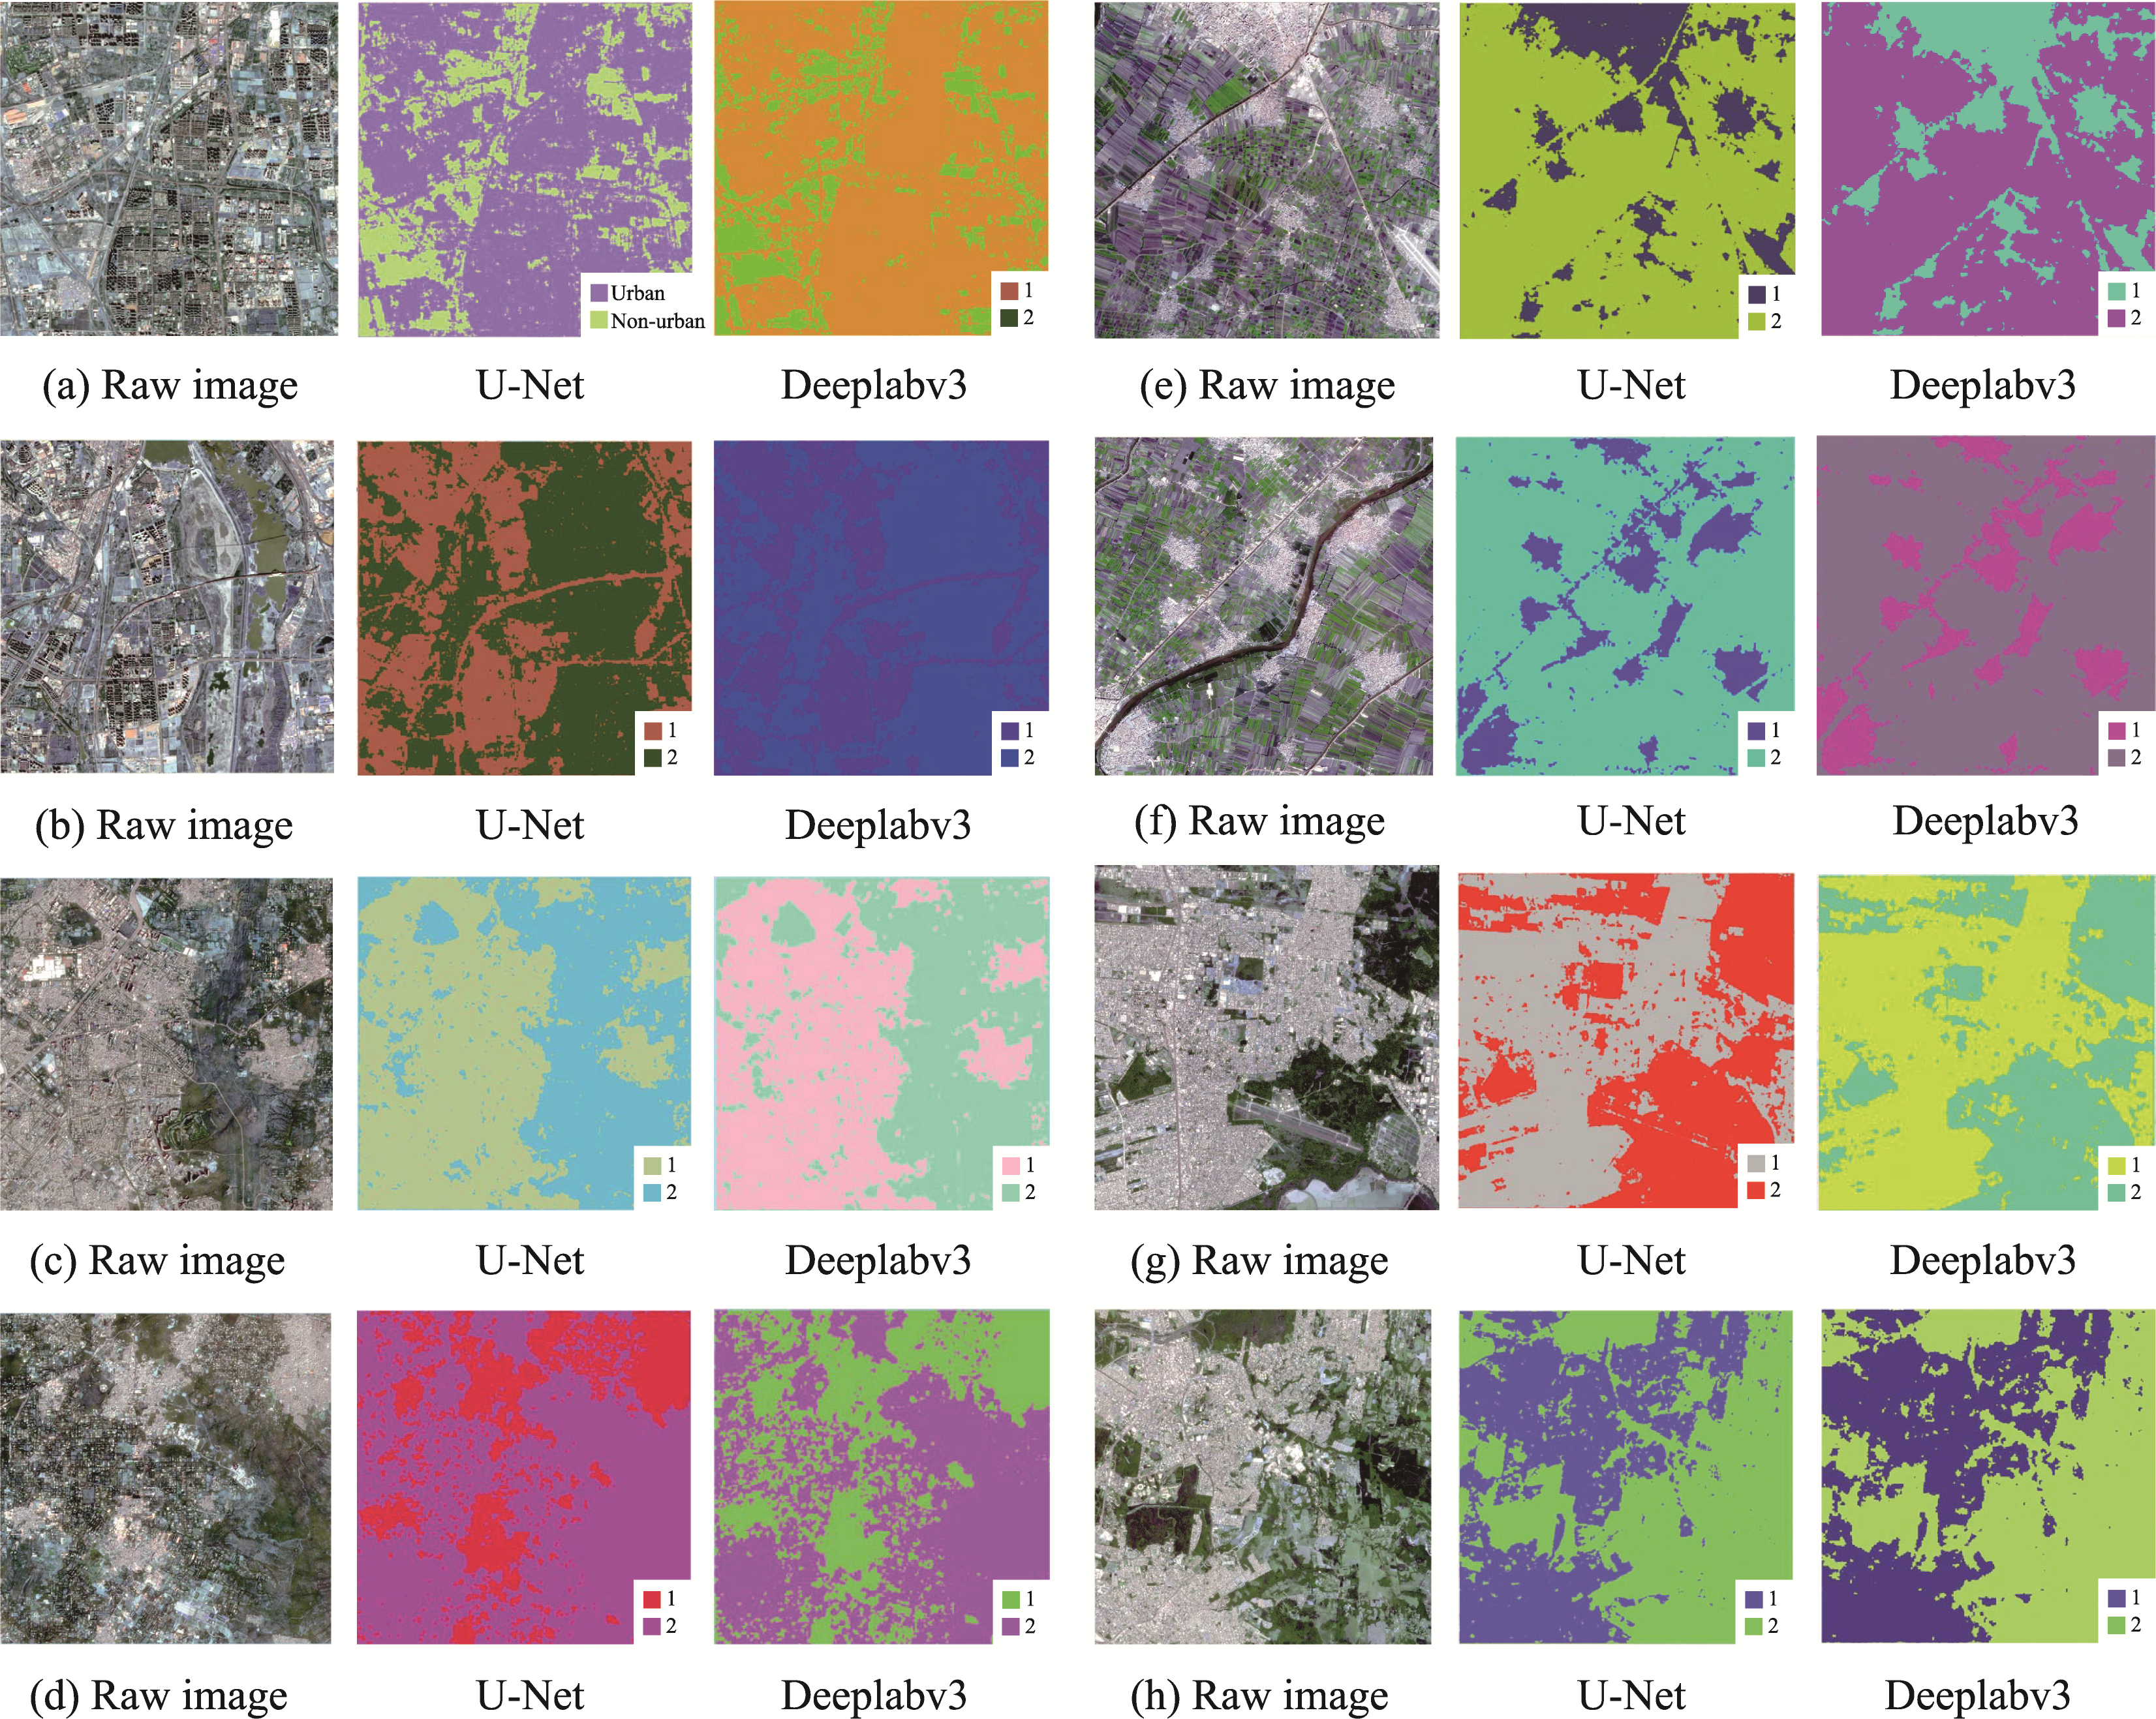
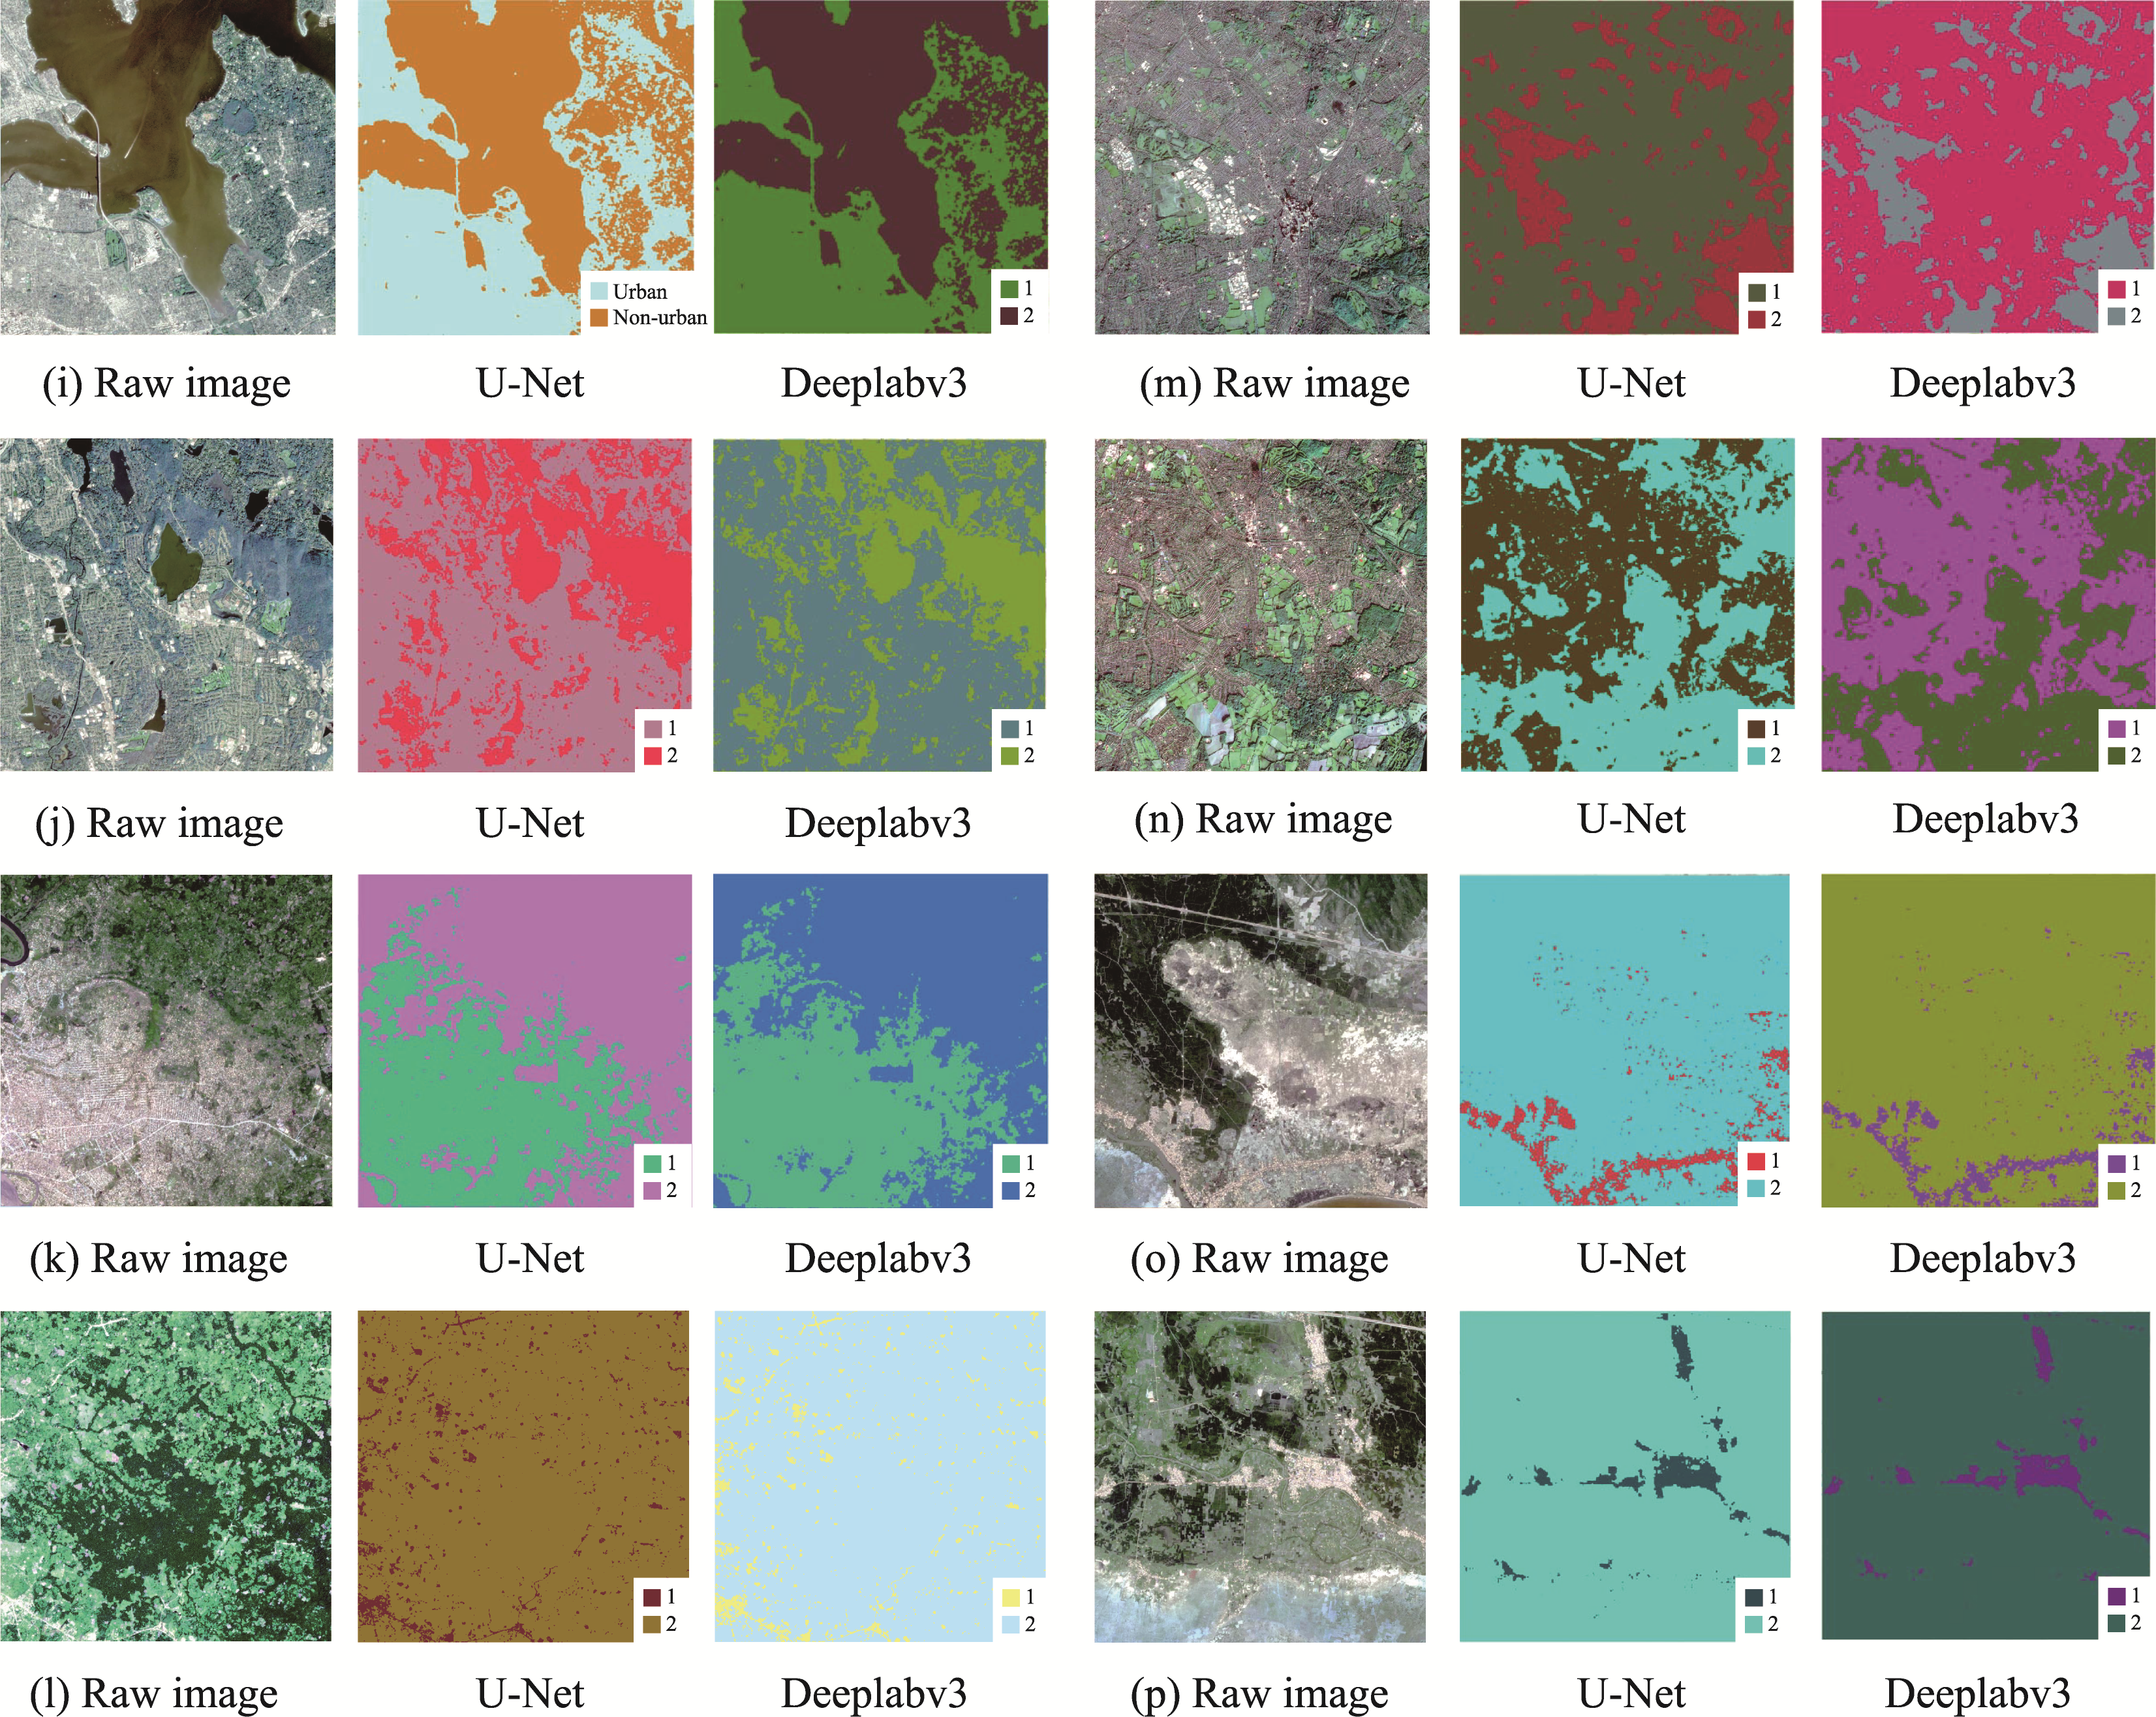
Figure 18 Comparison of UF extraction details between the two deep learning algorithms. Graph a shows that U-Net misclassifies some of the urban shadows, and graph b shows that DeeplabV3 misclassifies some of the smaller inner-city public green spaces. The circle represents the misjudged area.
Other figure/table from this article