×
模态框(Modal)标题
在这里添加一些文本
Close
Close
Submit
Cancel
Confirm
×
模态框(Modal)标题
×
Journal
Article
Figure
Search
EN
中文
Home
About Journal
About Journal
Indexed in
Awards
Editorial Board
Guide for Authors
Browse
Current Issue
Online First
Archive
Highlights
Topic
Archive by Subject
Most Viewed
Most Download
Most Cited
E-mail Alert
RSS
Subscribe
Advertisement
Contact us
EN
中文
Figure/Table detail
Comparative analysis of different machine learning algorithms for urban footprint extraction in diverse urban contexts using high-resolution remote sensing imagery
GUI Baoling, Anshuman BHARDWAJ, Lydia SAM
Journal of Geographical Sciences
, 2025, 35(
3
): 664-696. DOI:
10.1007/s11442-025-2339-y
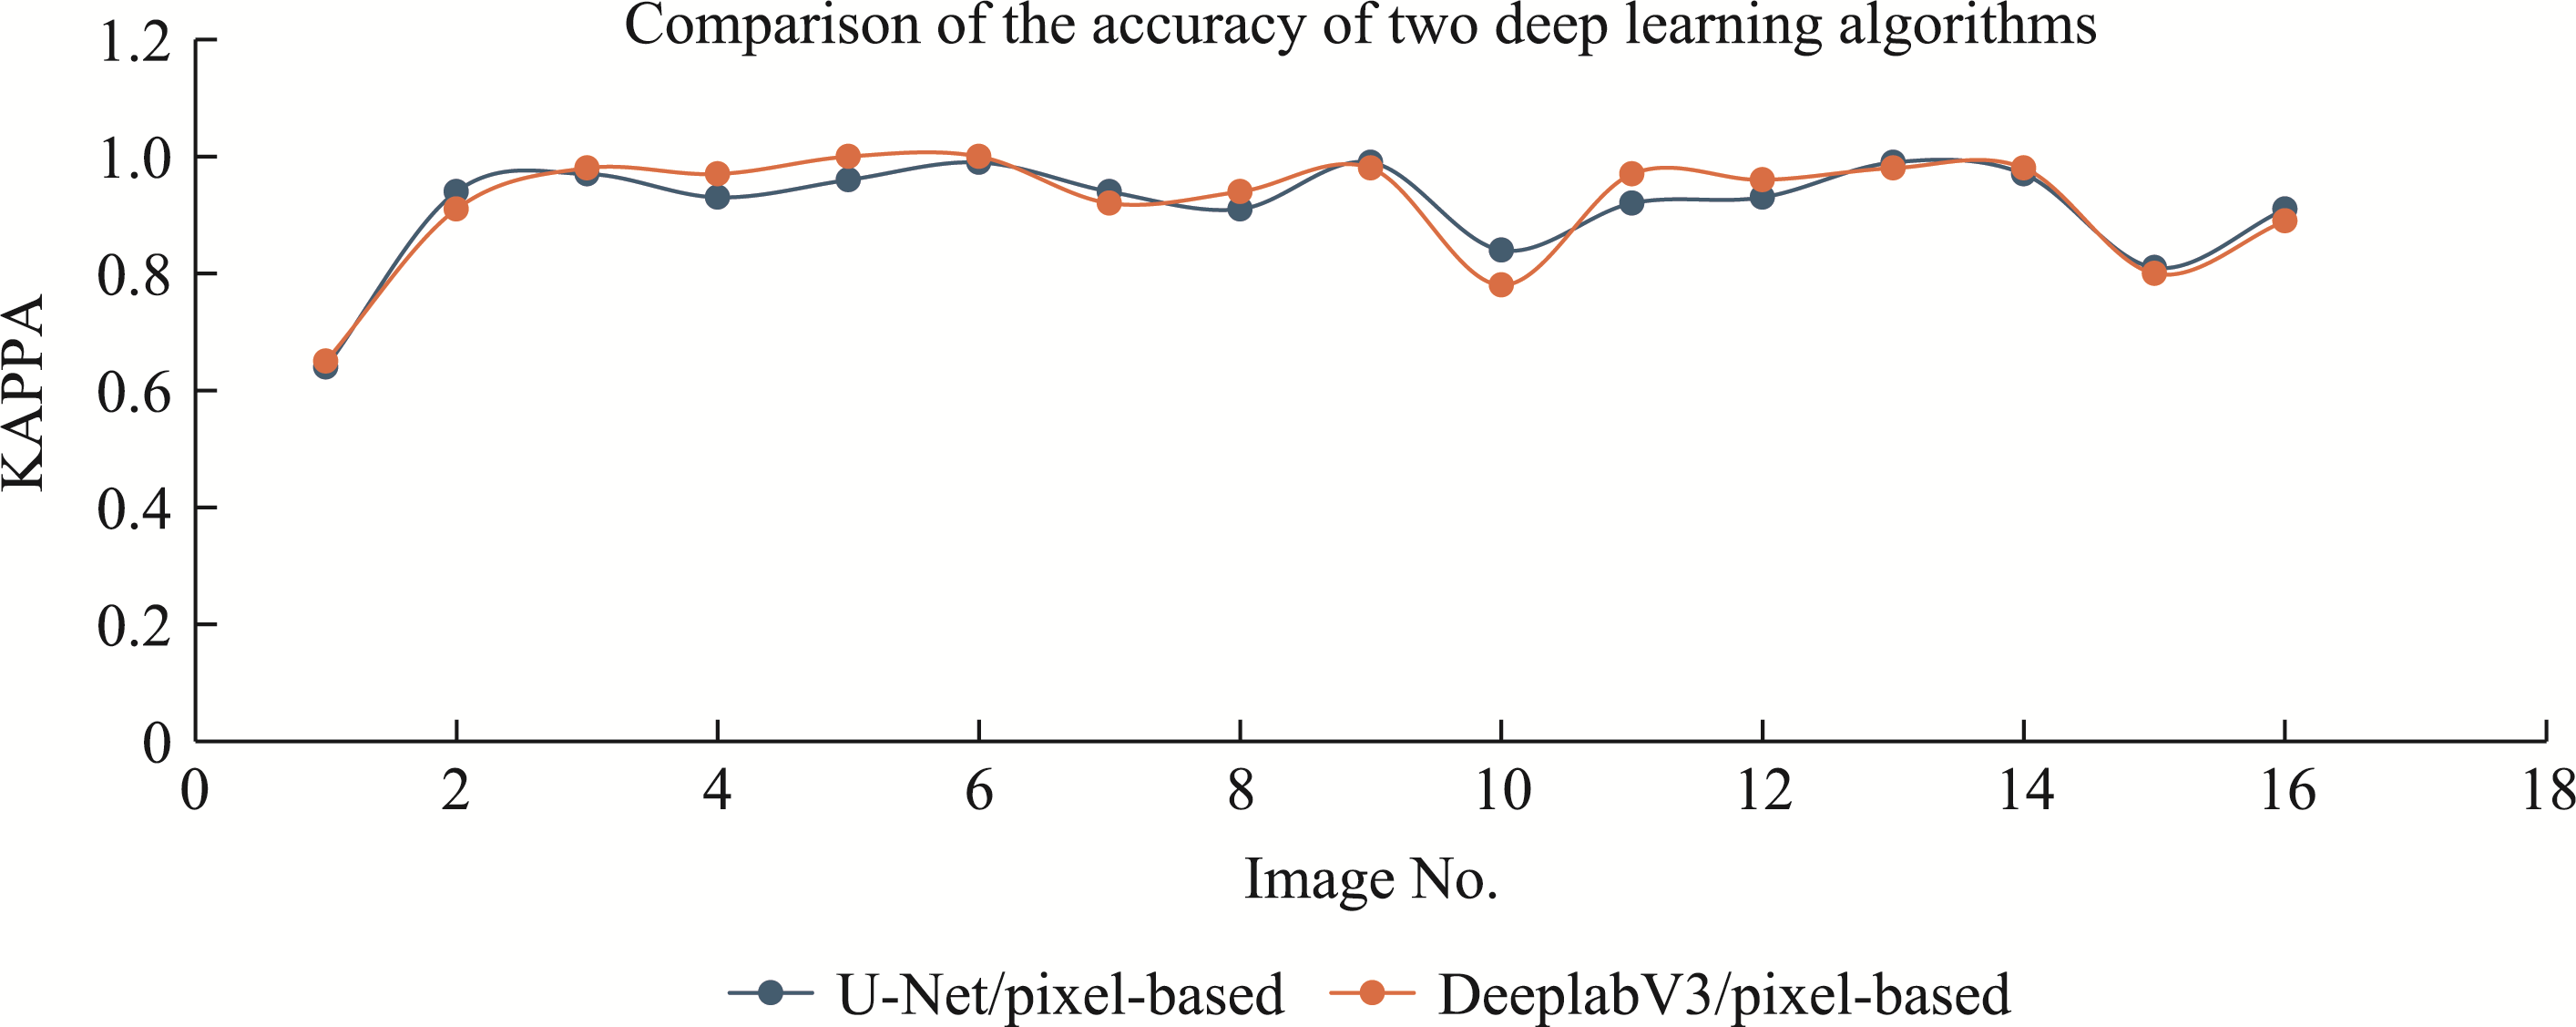
Figure 15
Kappa precision numerical curve of UF extraction based on deep learning
Other figure/table from this article
Figure 1
Schematic representation of UF coverage (a. original image; b. UF coverage)
Figure 2
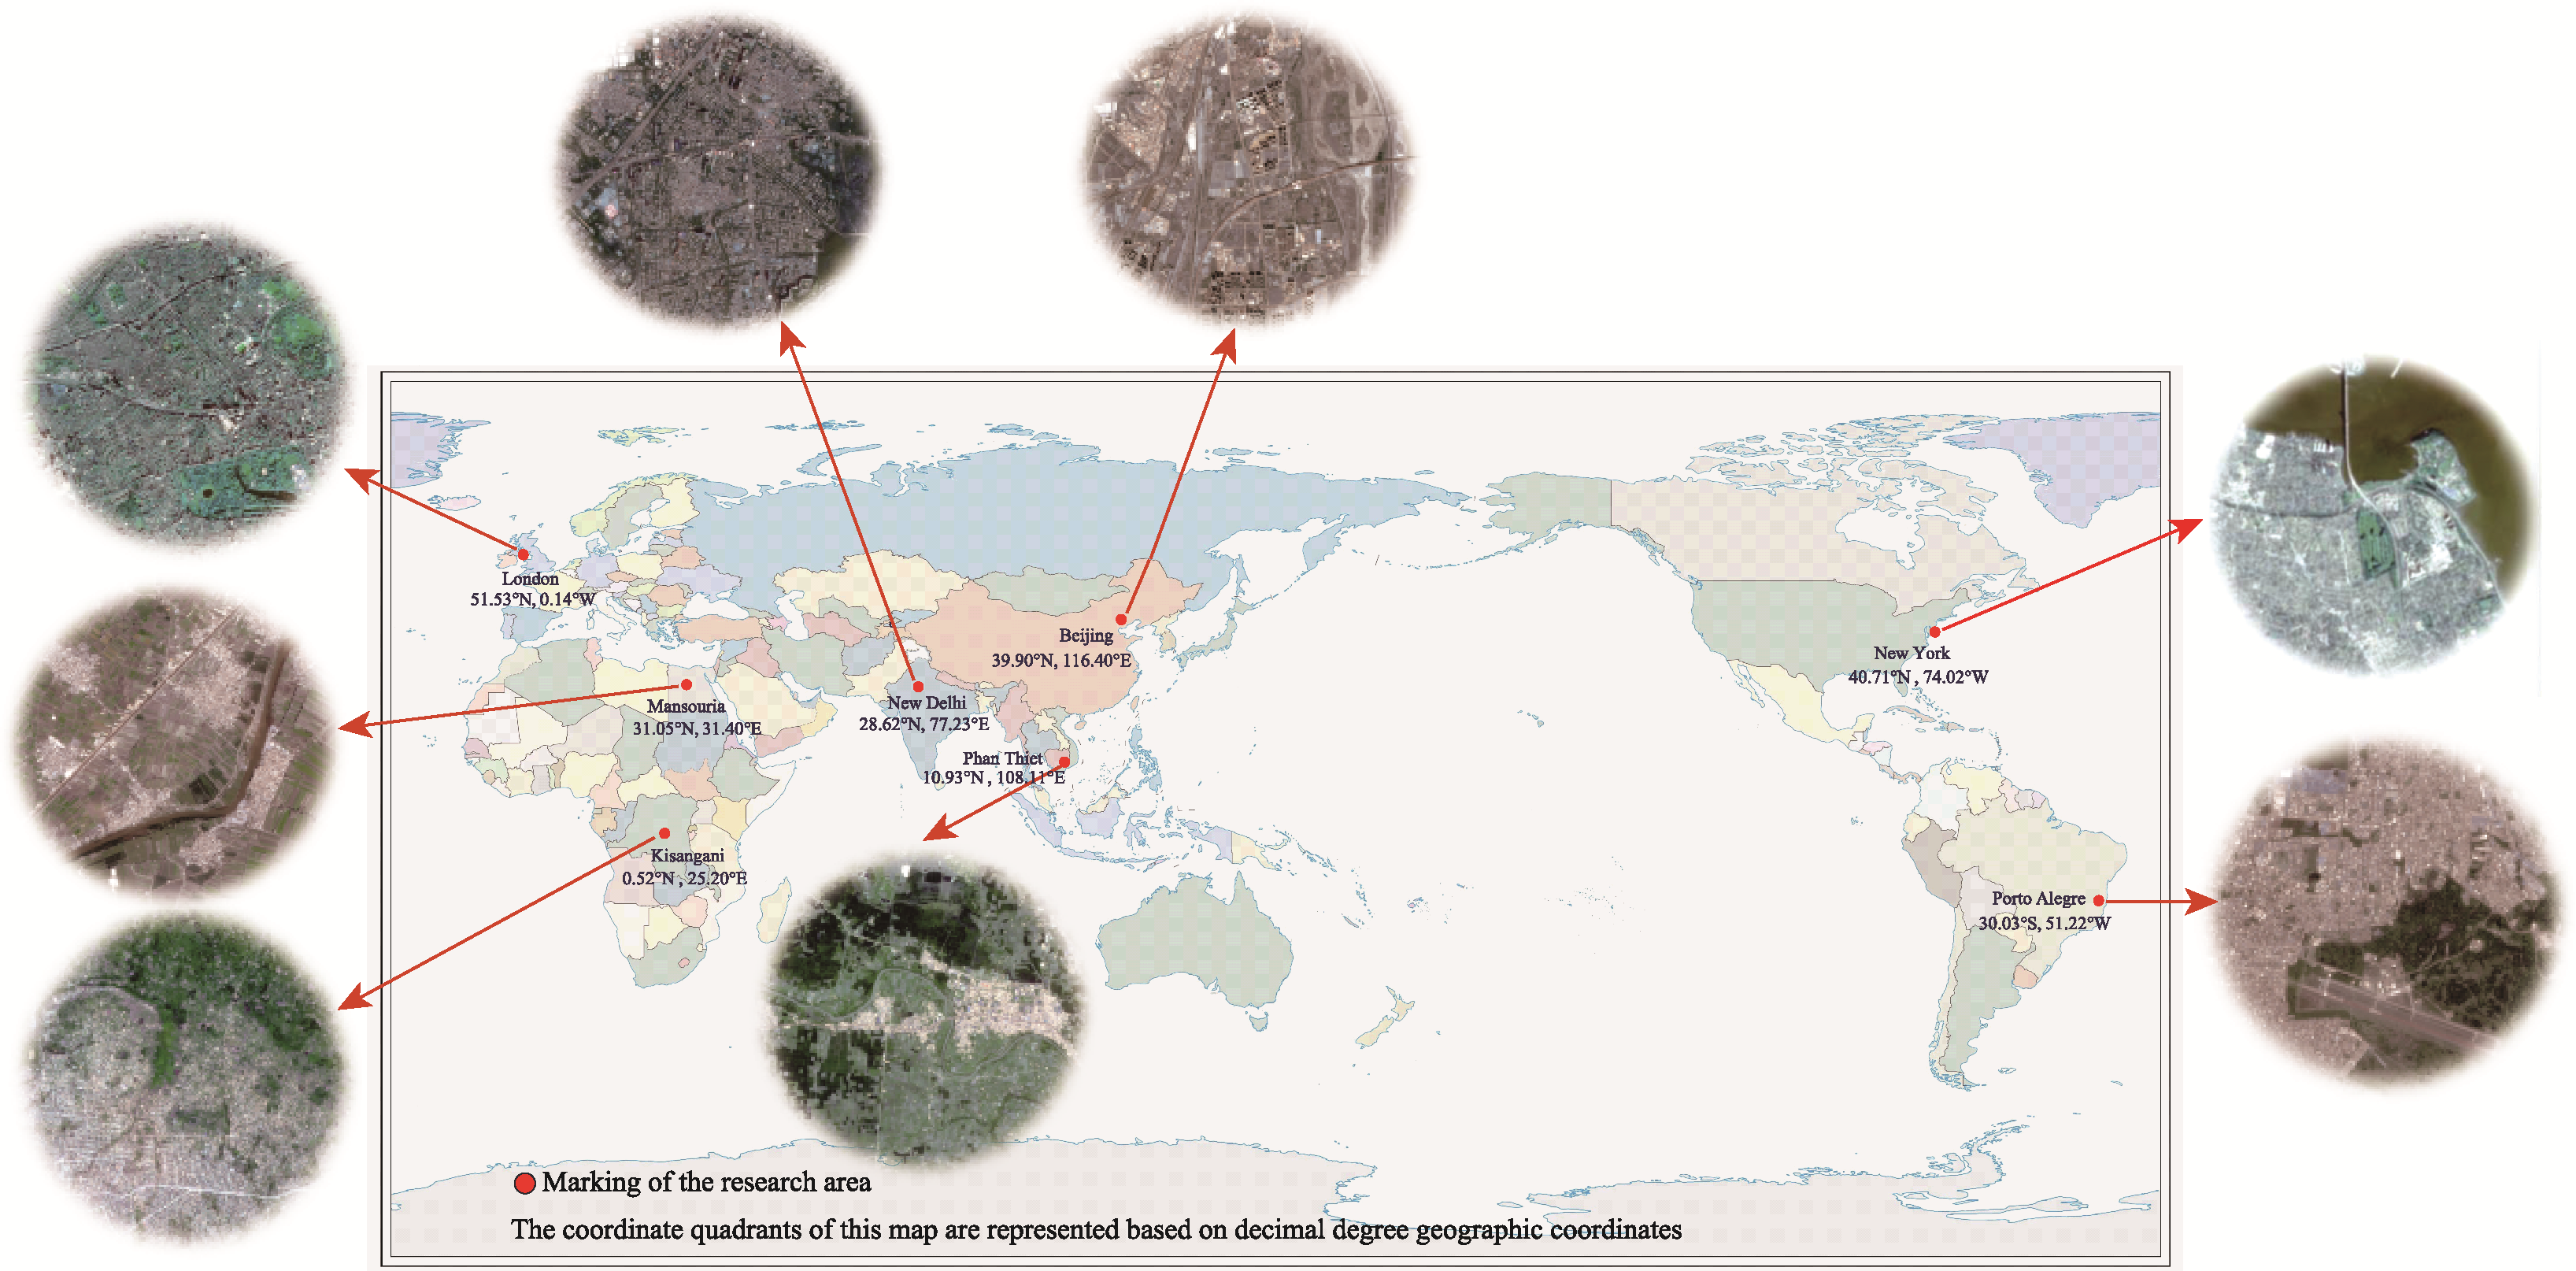
Map of the study area (eight cities across the world)
Table 1
Detailed description of the characteristics of different cities
Figure 3
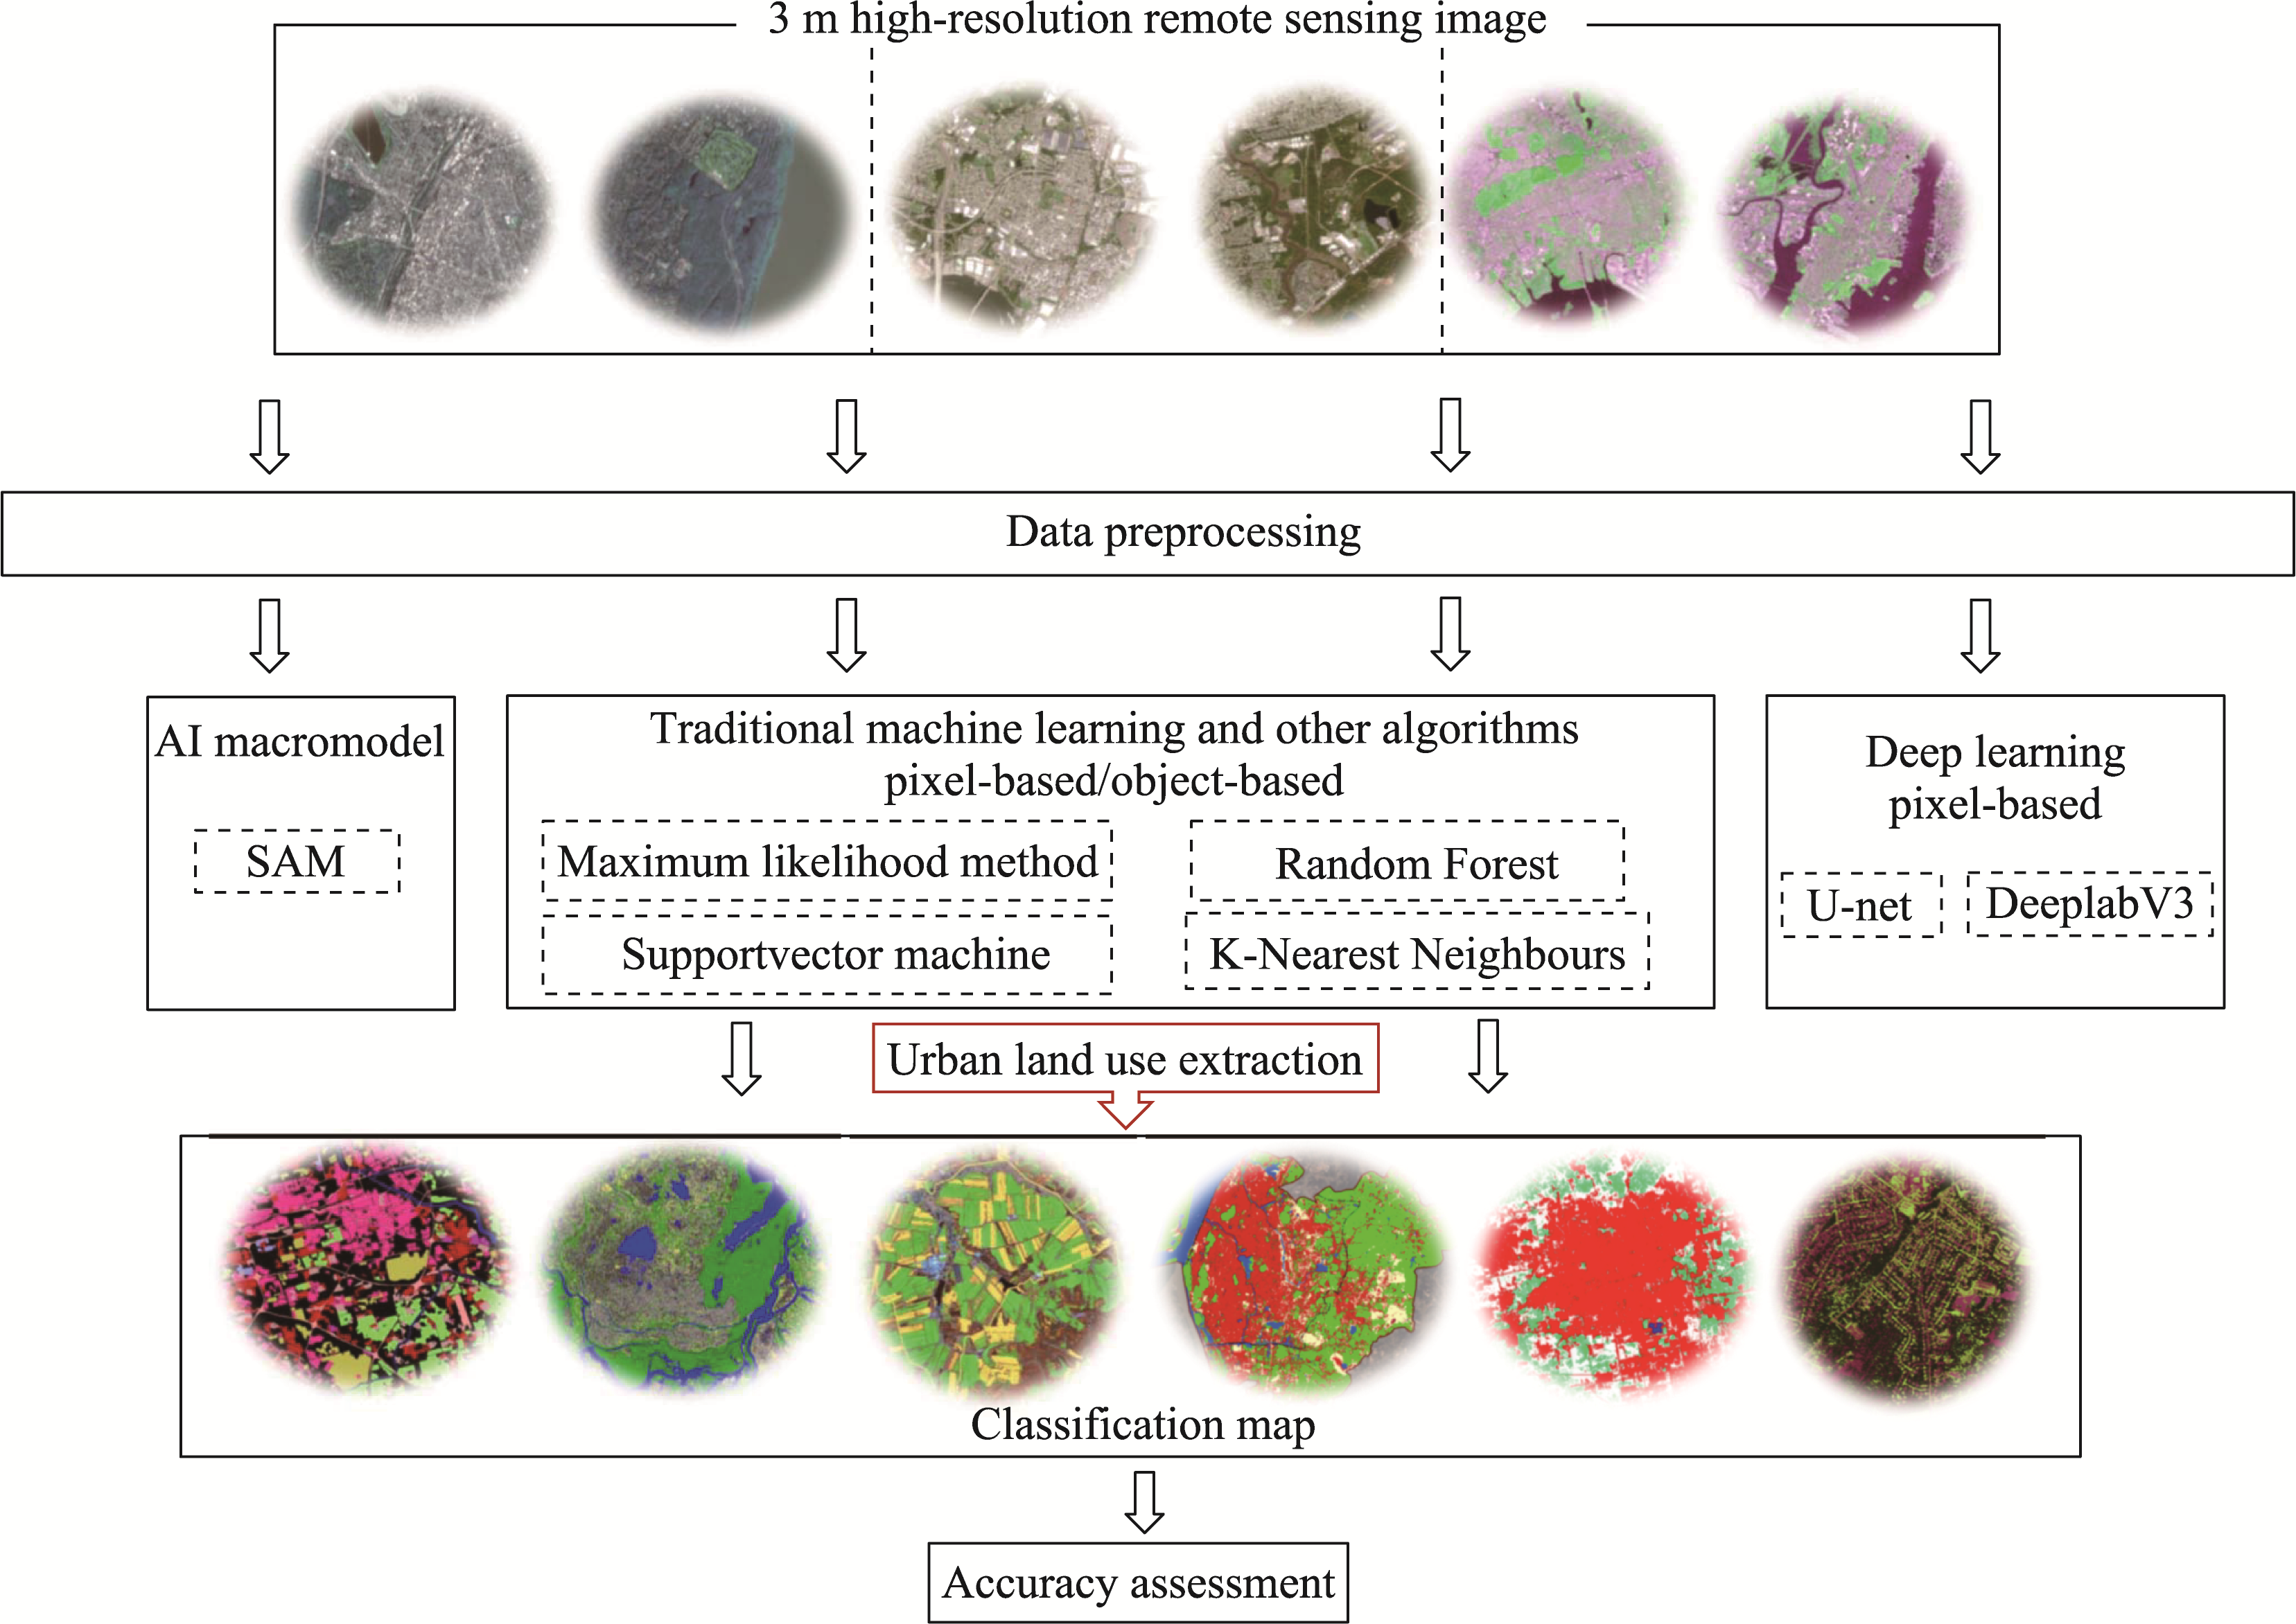
Flowchart of the operation of this experiment
Figure 4
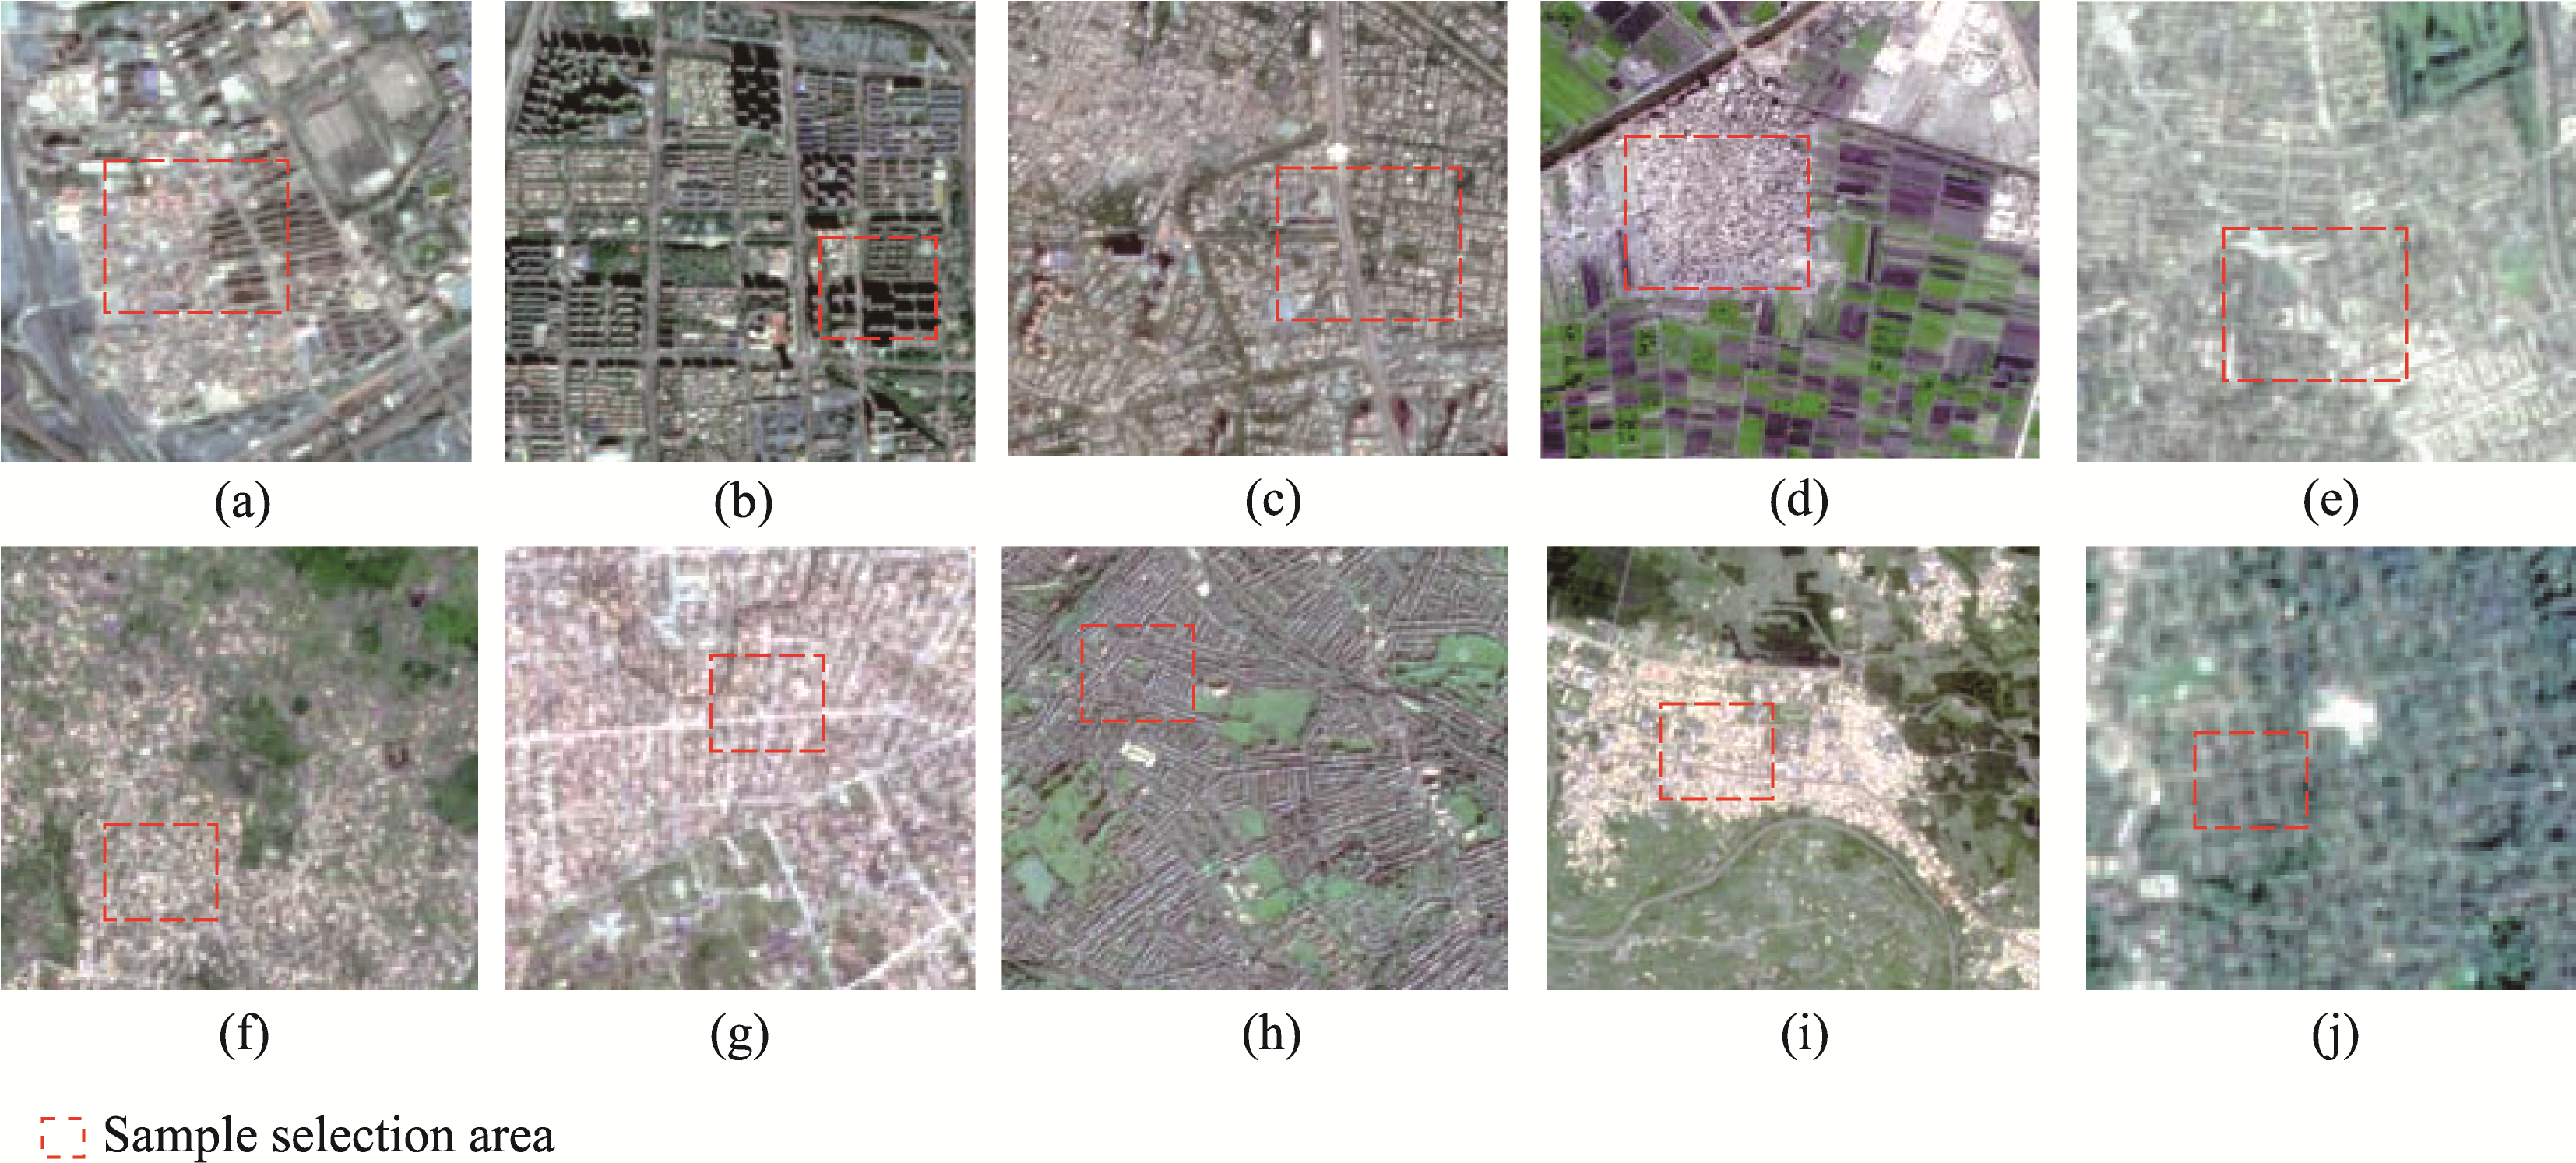
Illustration of an example of sample selection for UF extraction (a-j represent the layout of different cities and the selection of samples. a and b correspond to Beijing, c to New Delhi, d to Mansouria, e to Porto Alegre, f and g to Kisangani, h and i to London, and j to New York.)
Figure 5
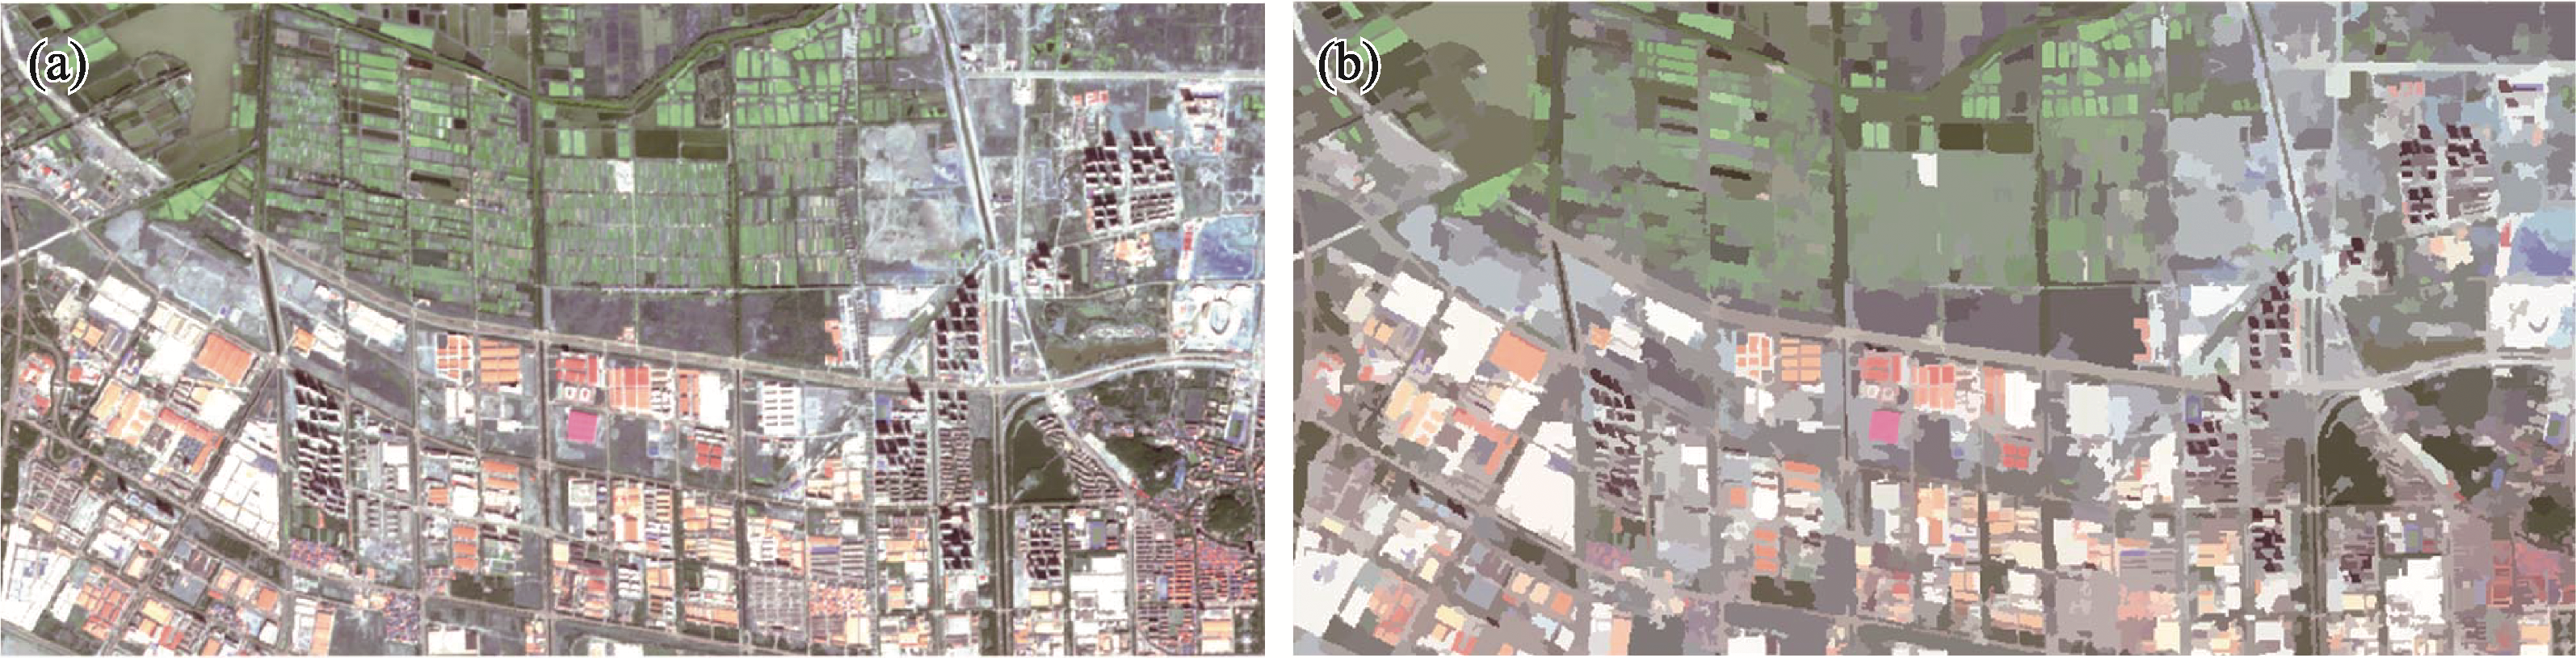
Segmentation results based on the Mean Shift algorithm (a. original image; b. segmentation result)
Figure 6
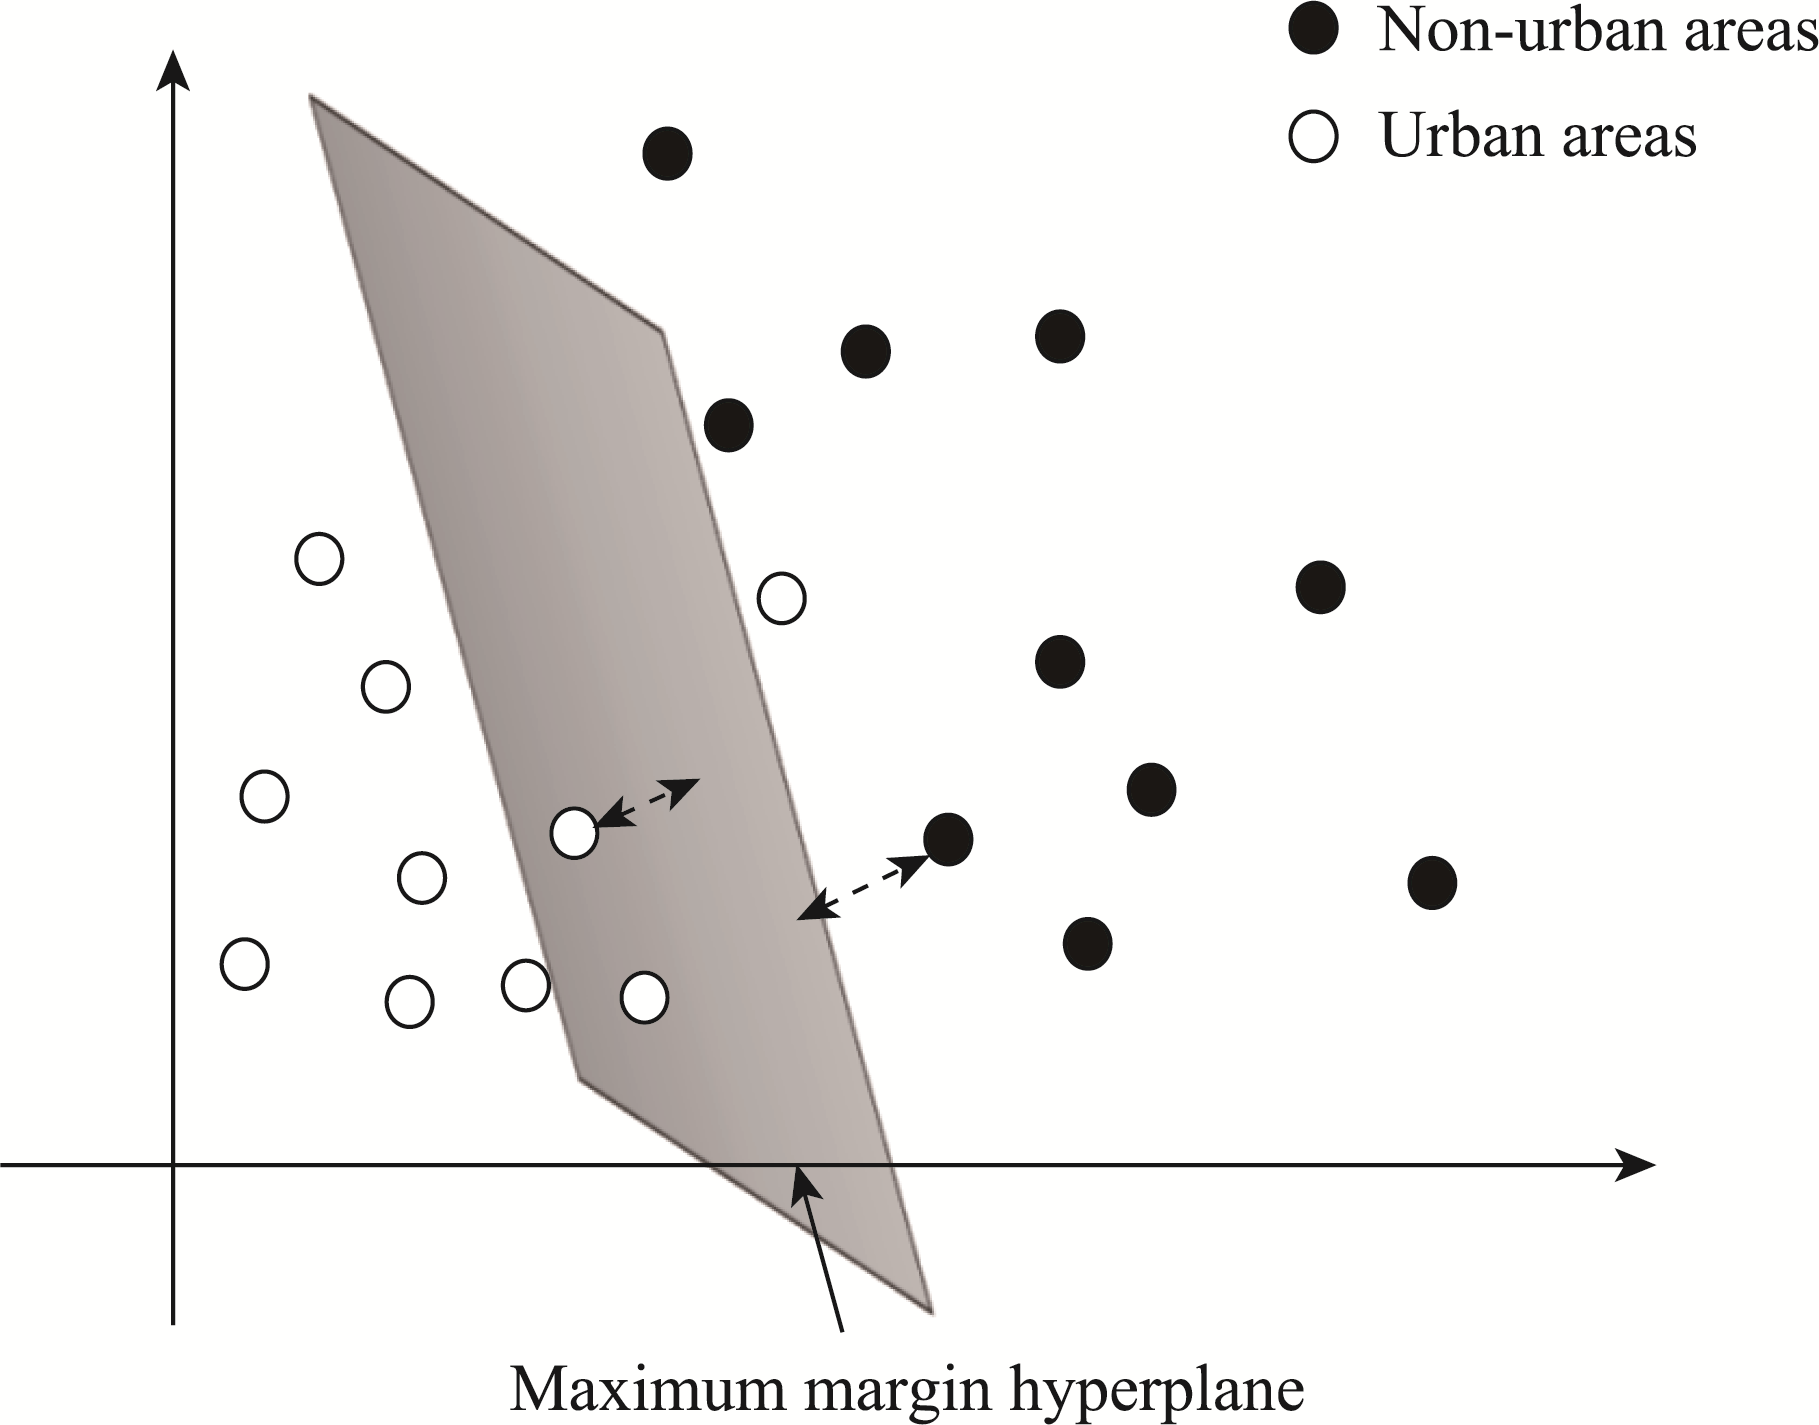
Schematic diagram of the classification principle of SVM
Figure 7
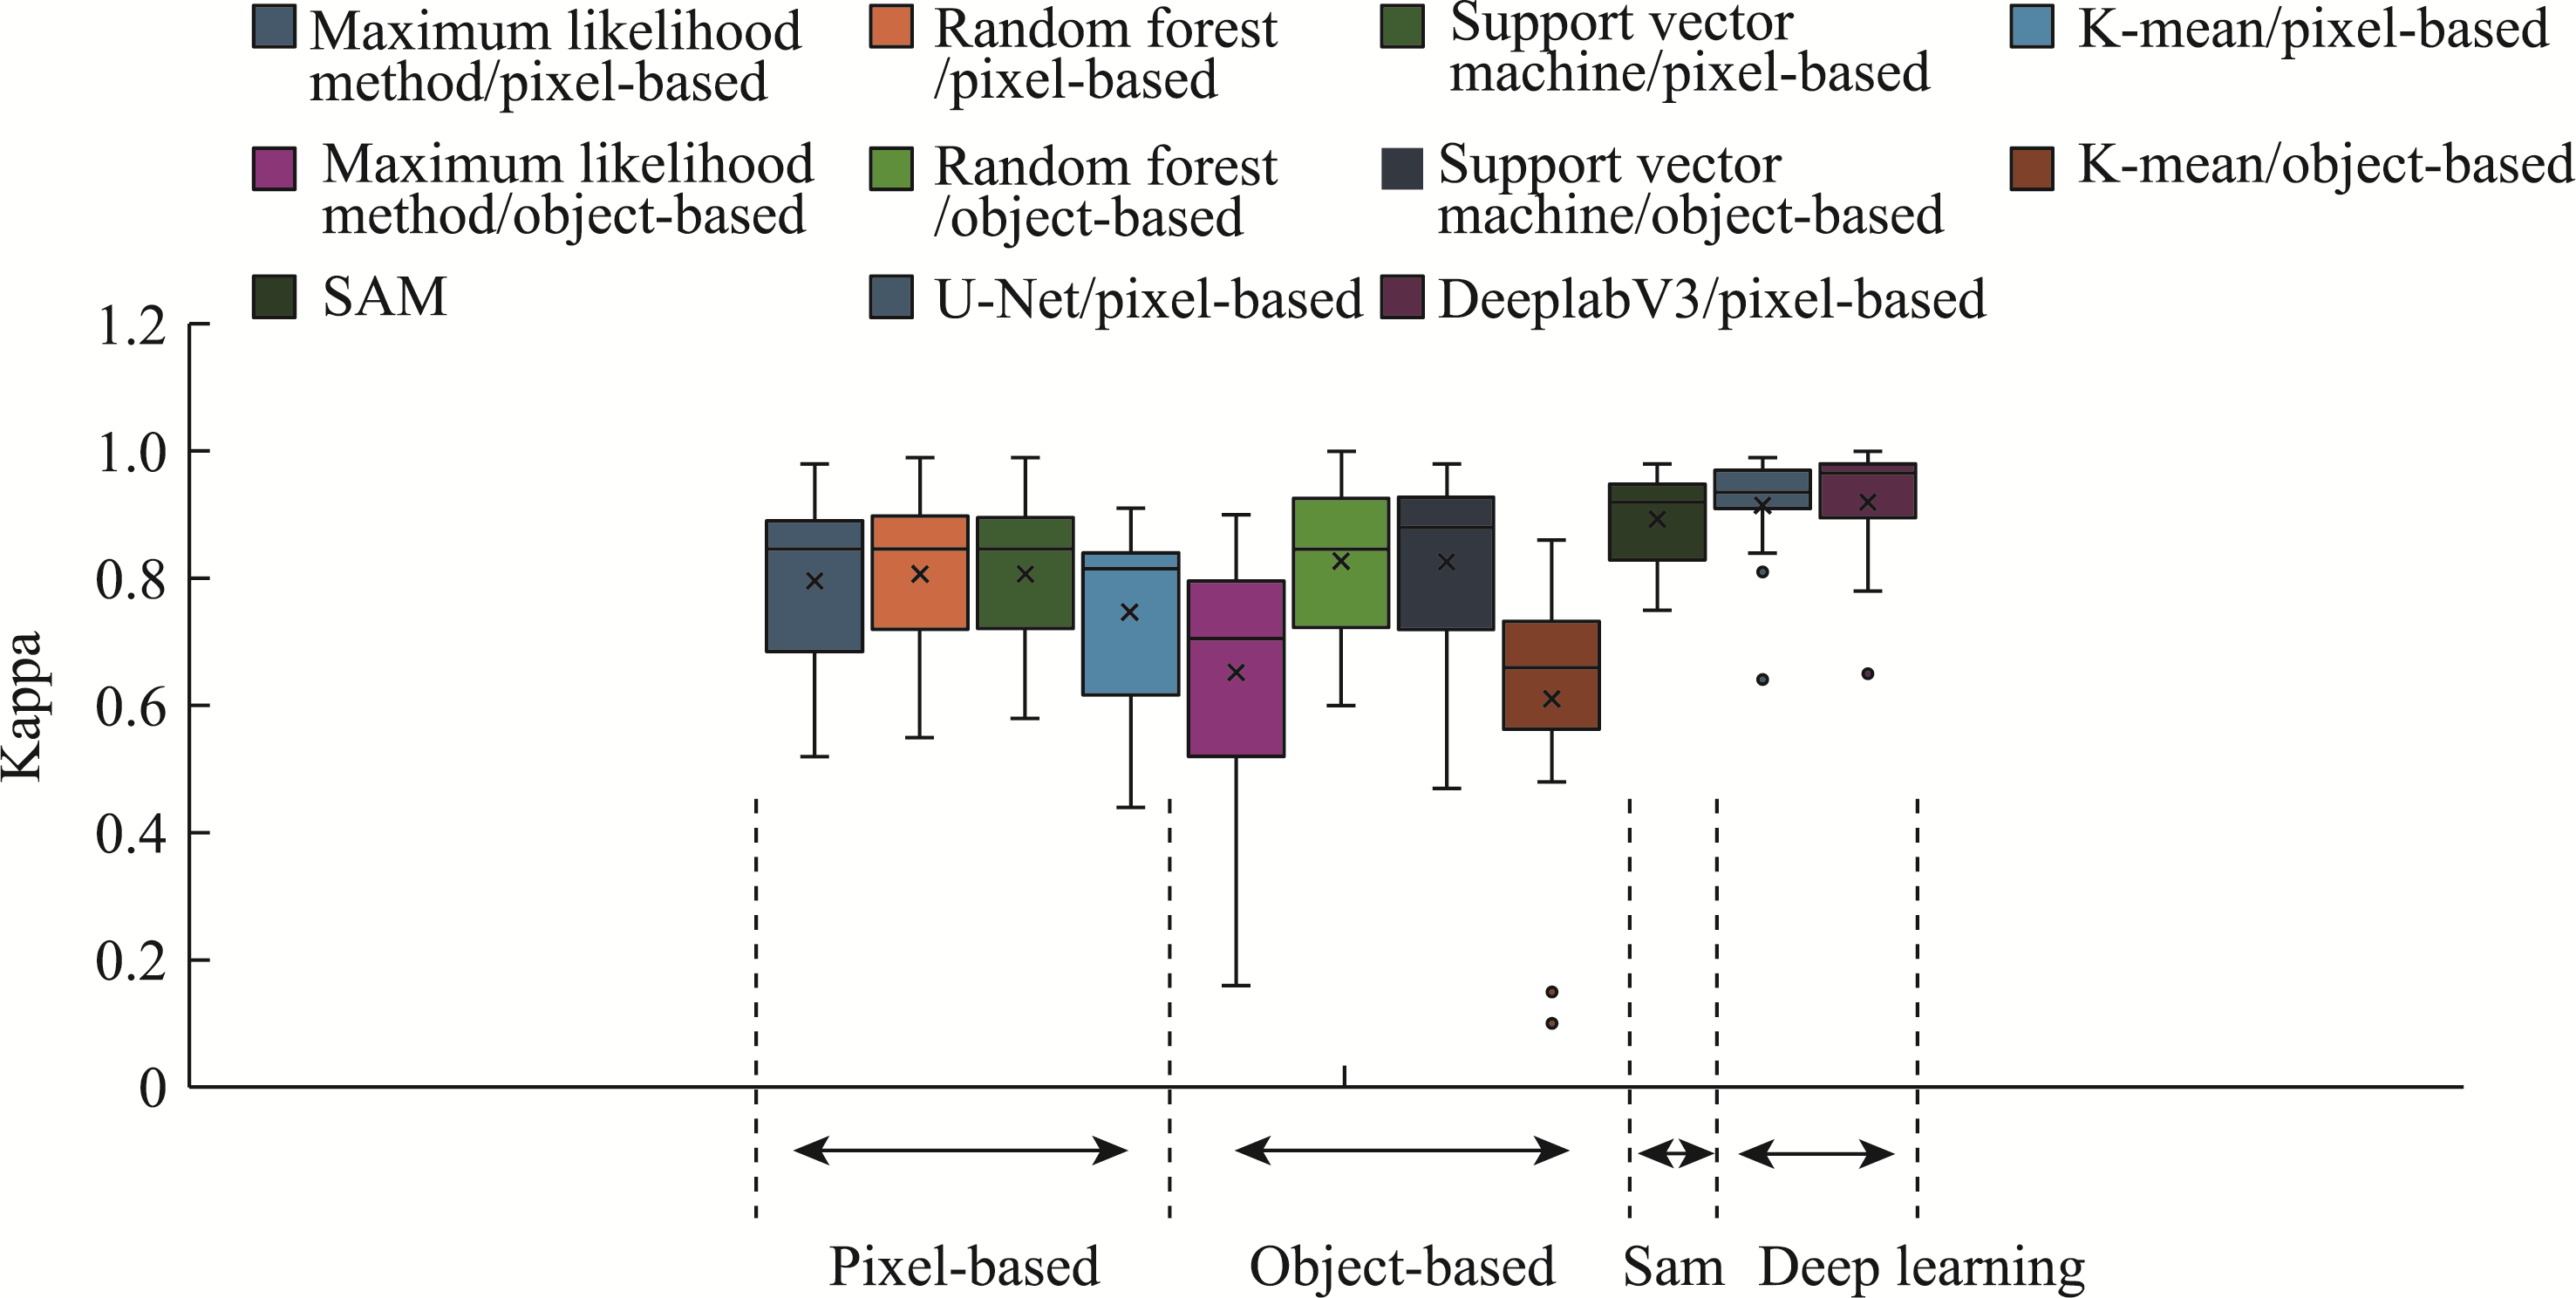
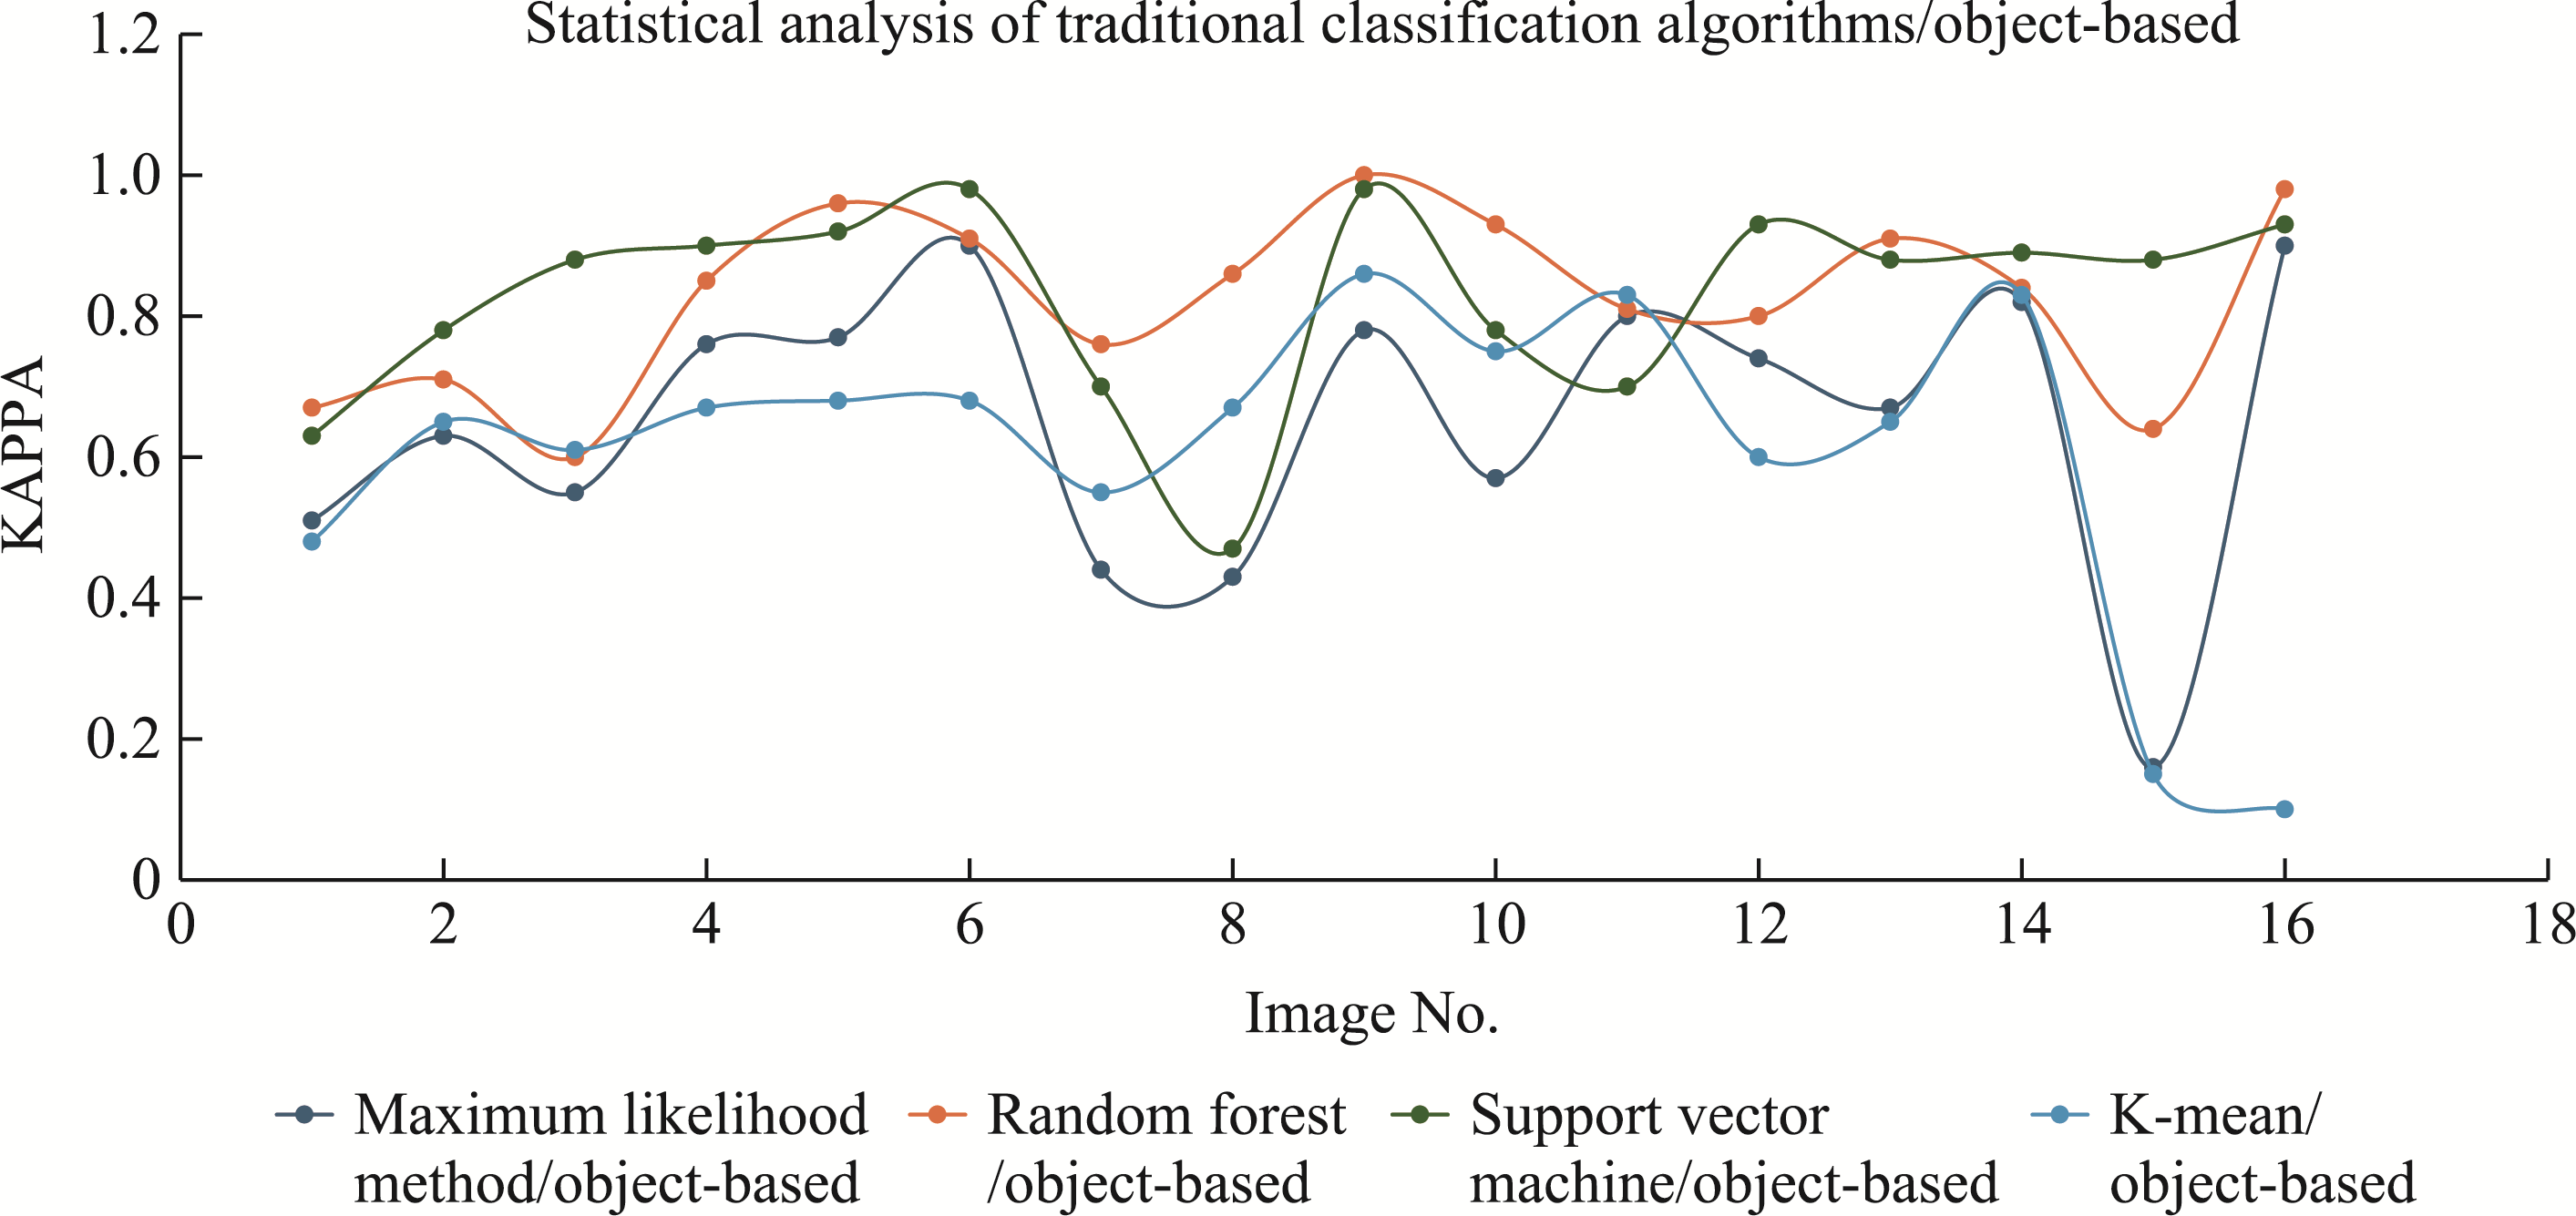
Kappa accuracy values for all images under different classification methods
Figure 8
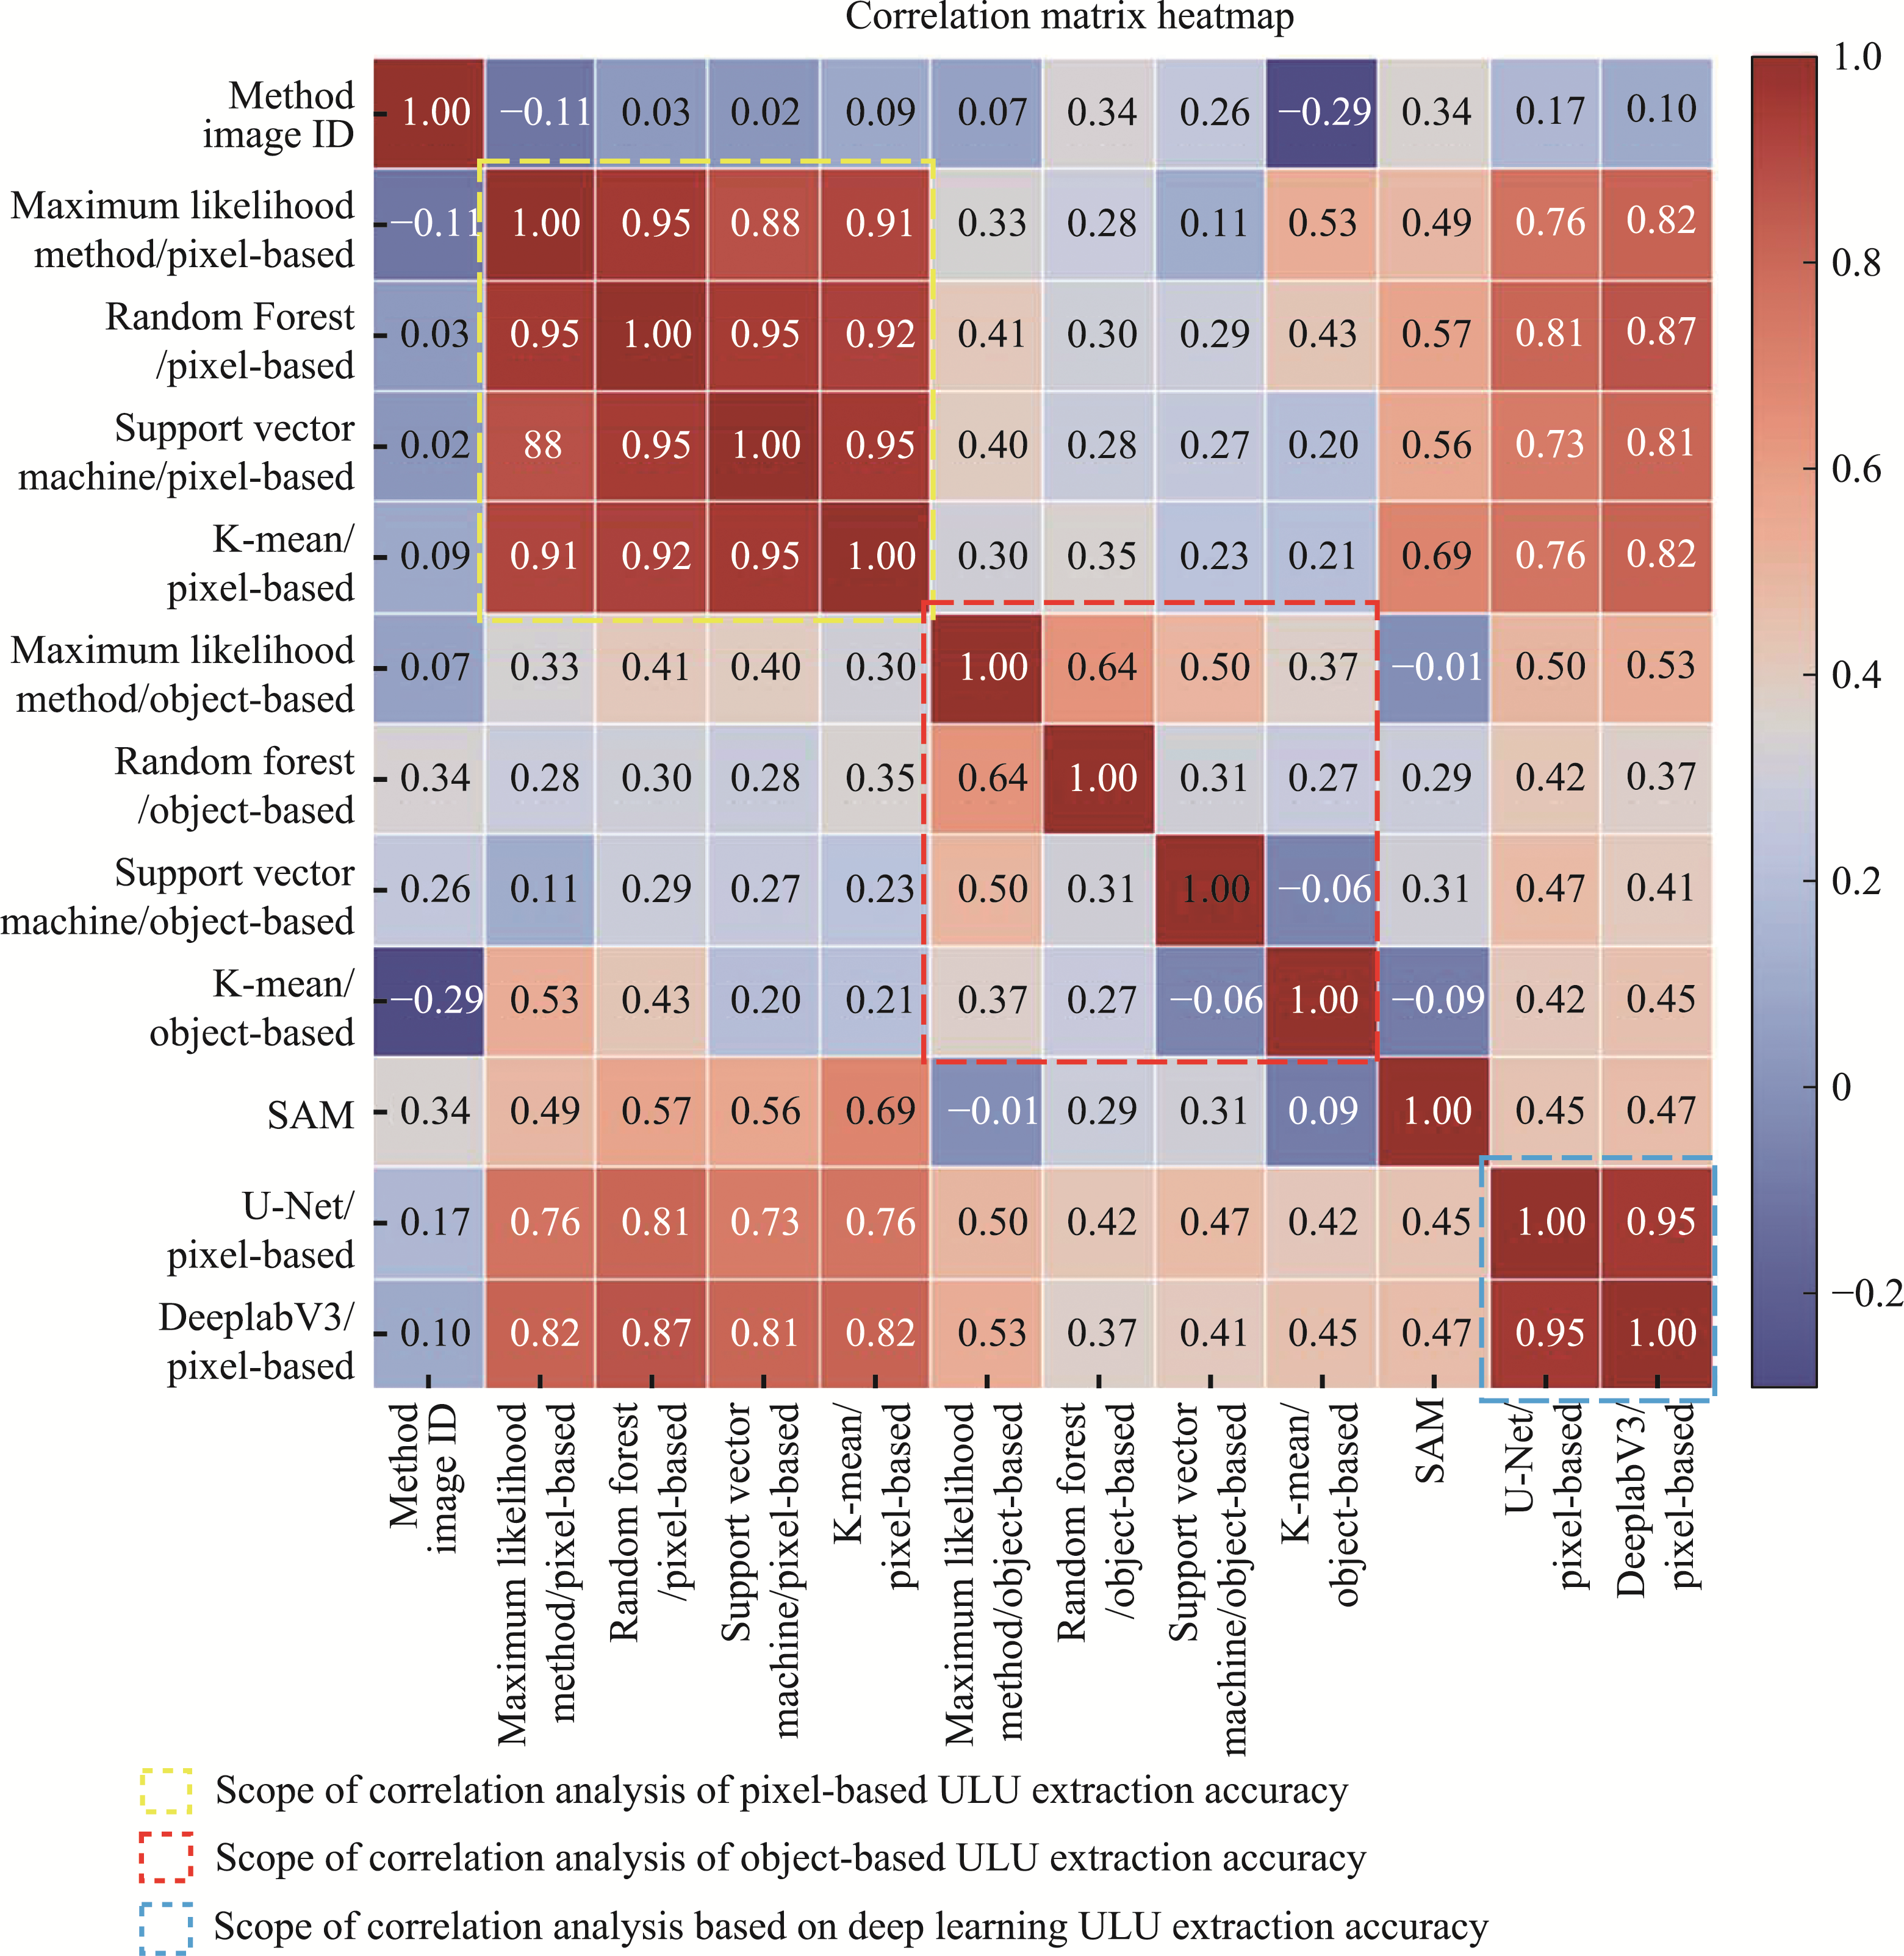
Correlation analysis diagram of UF extraction accuracy (Kappa) with different algorithms
Figure 9
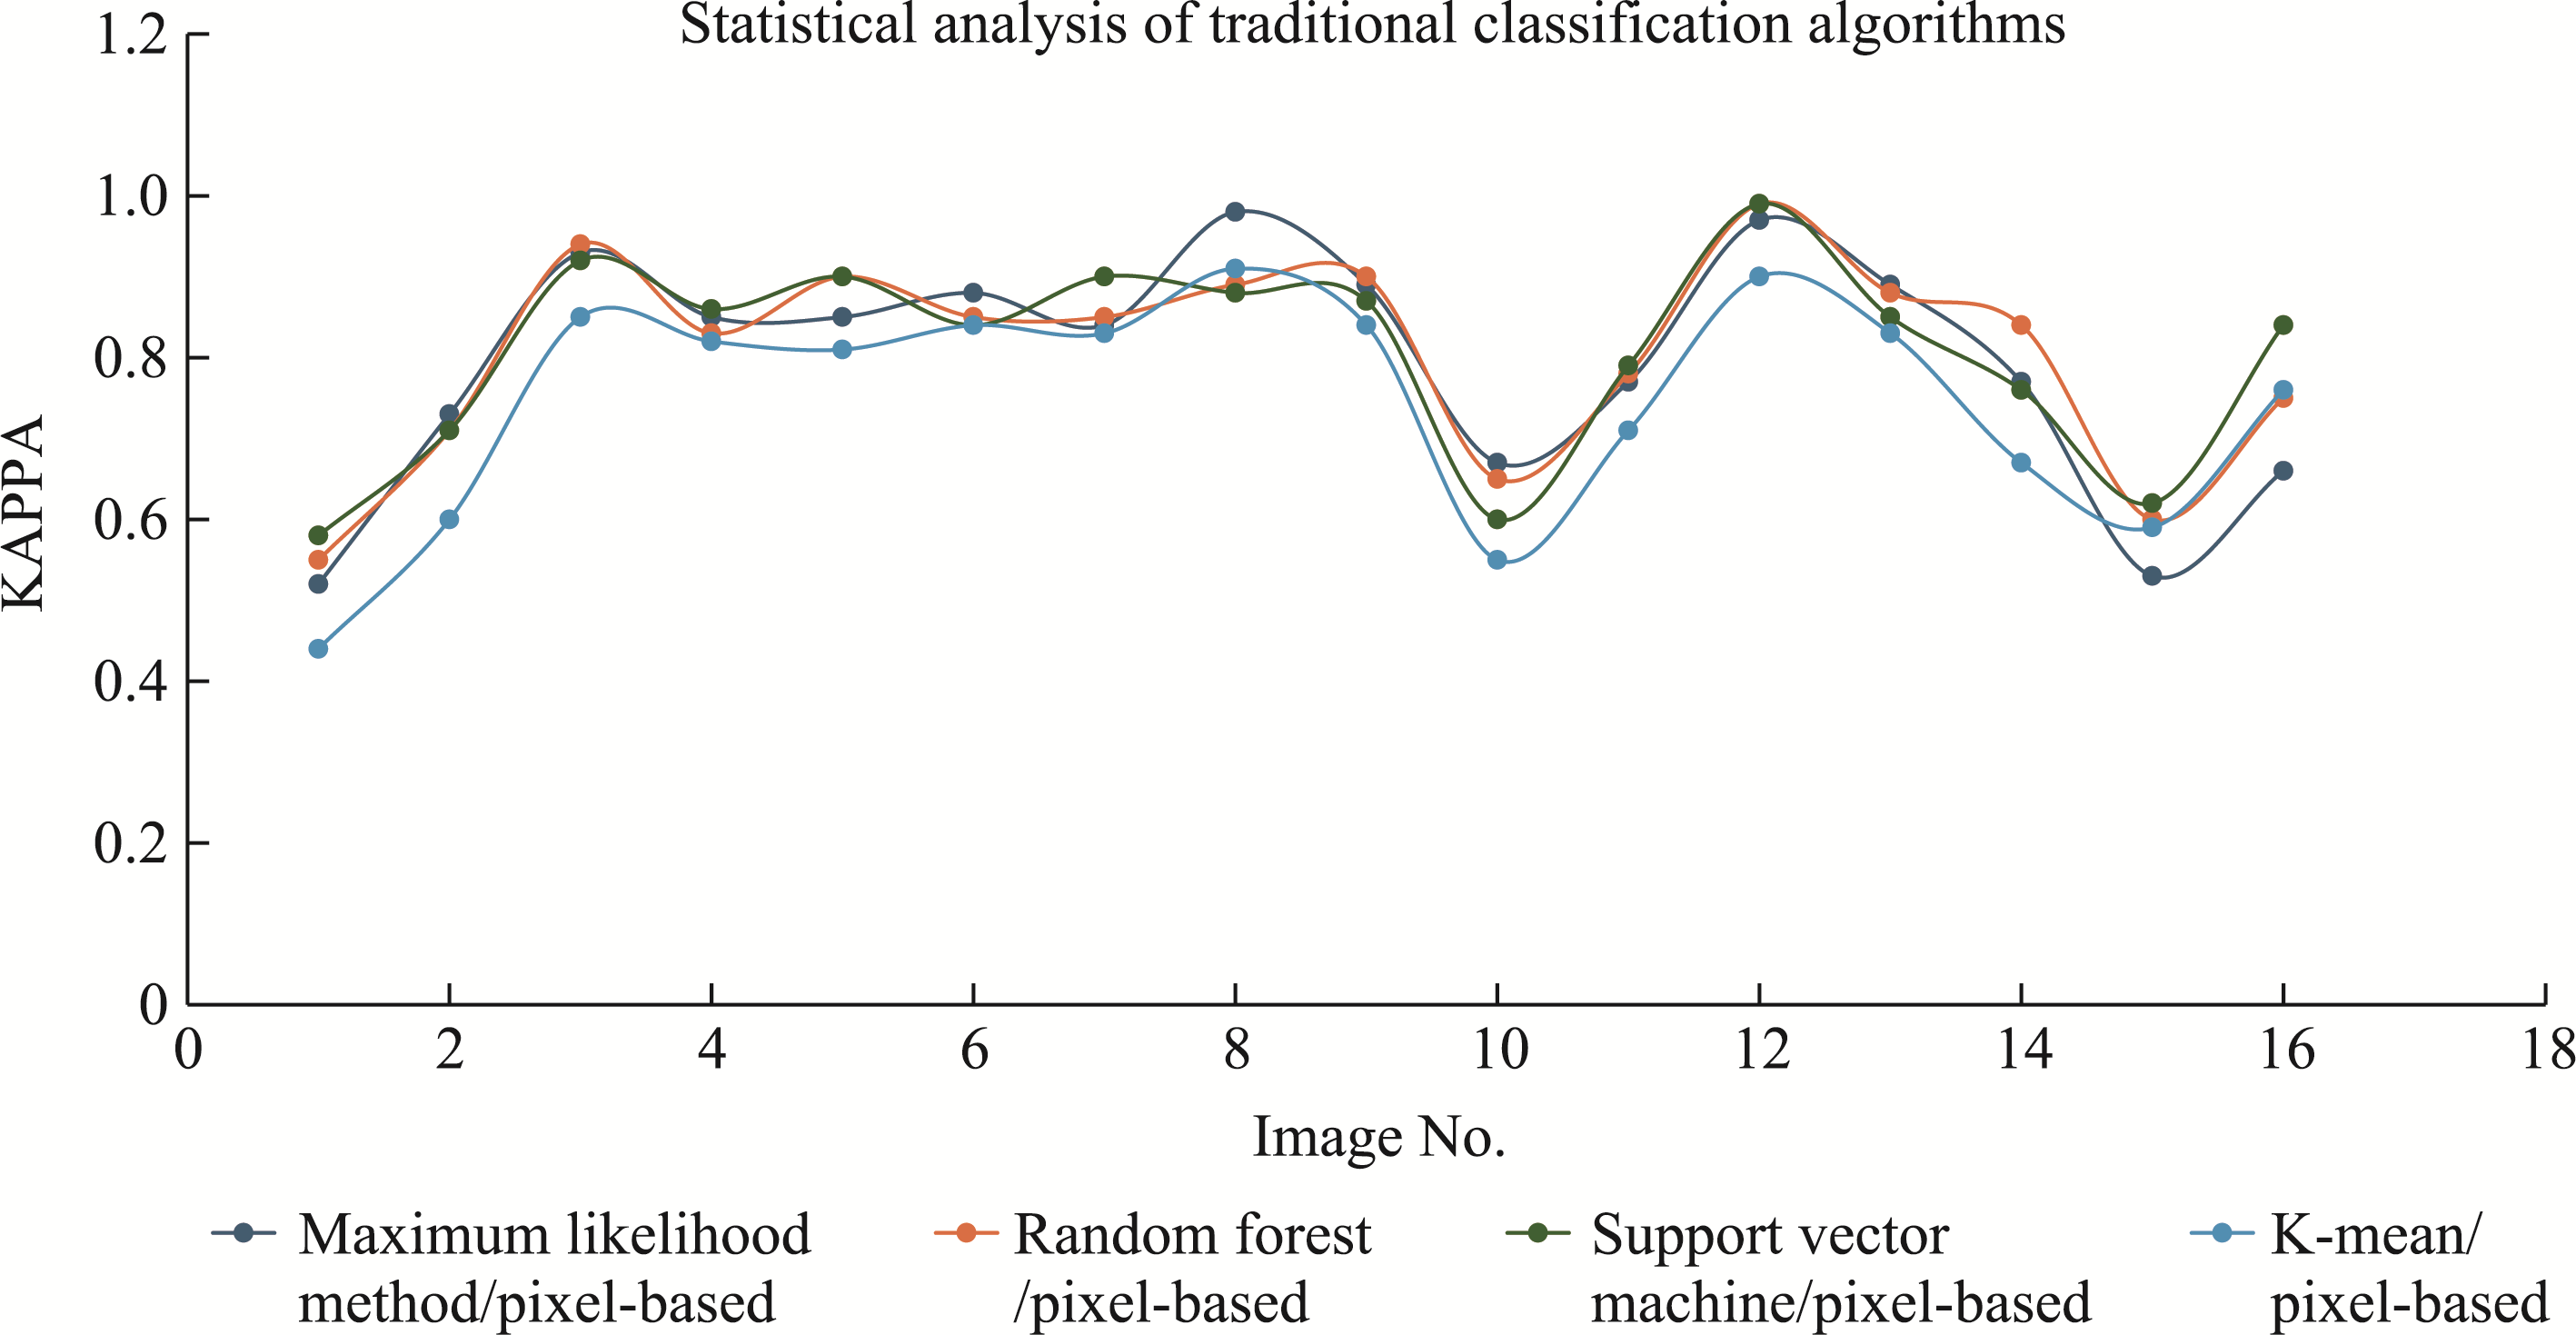
Pixel-based UF extraction Kappa precision numerical graph based on four traditional algorithms
Figure 10
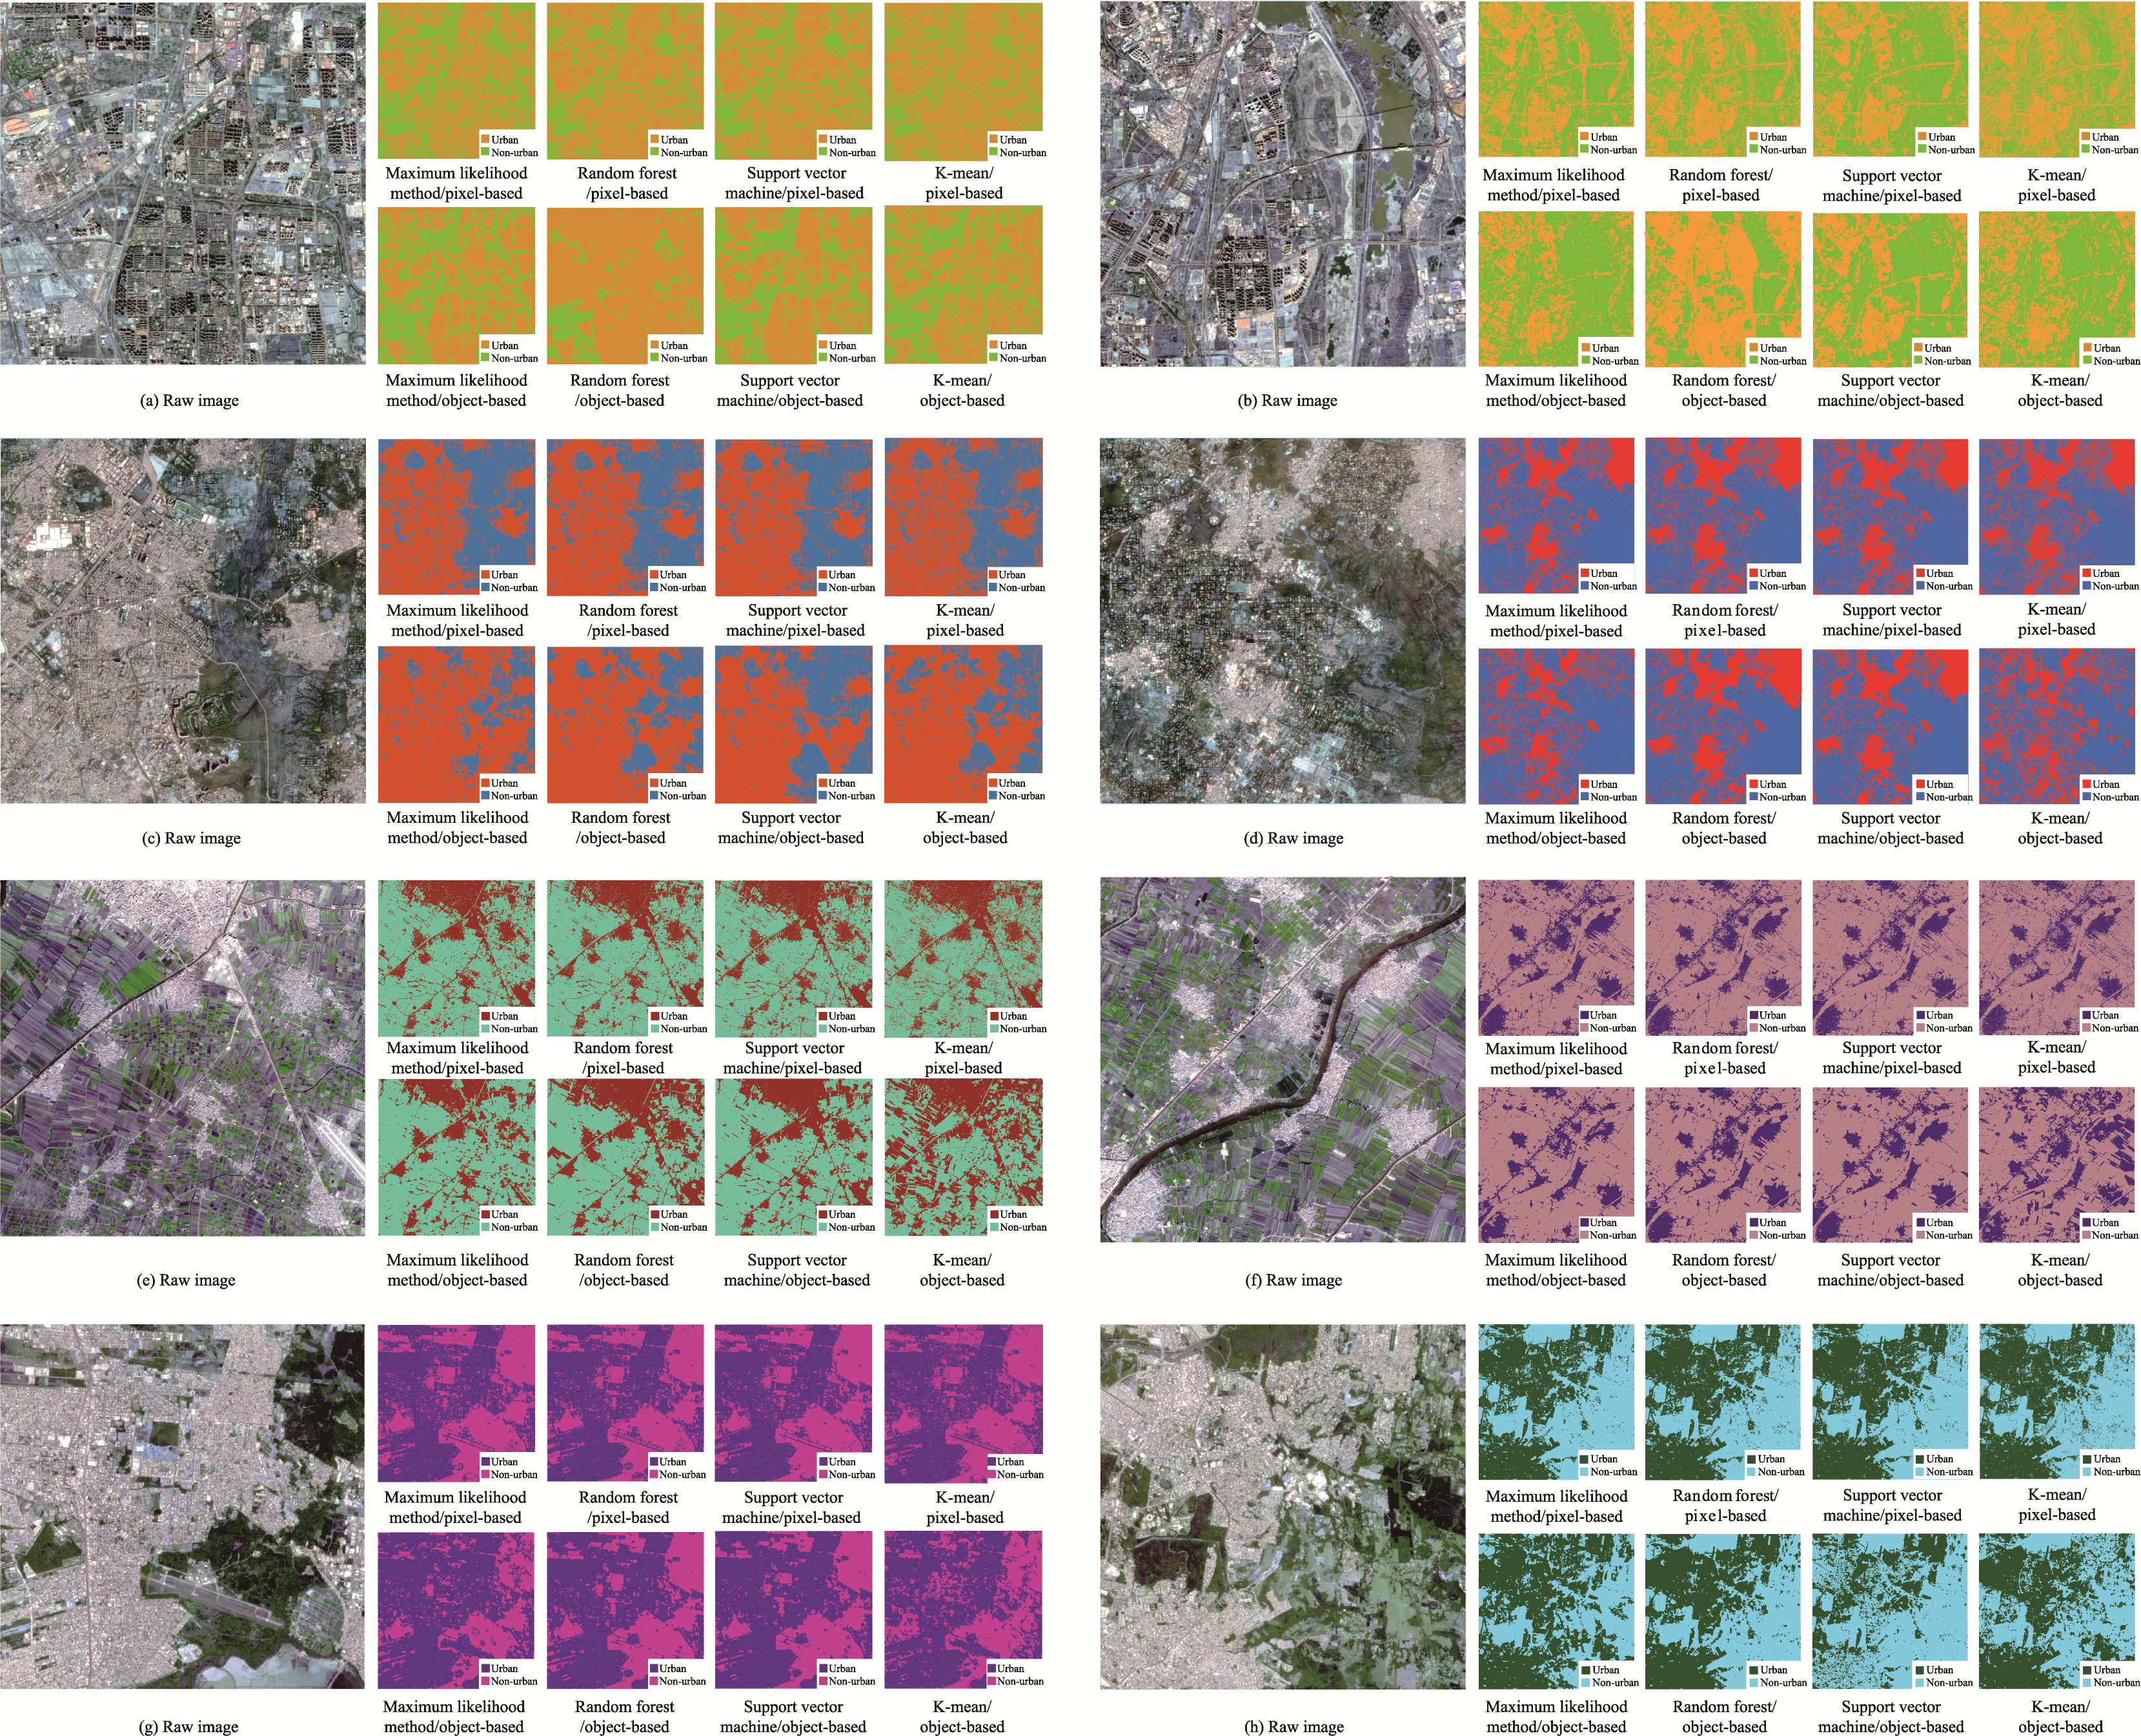
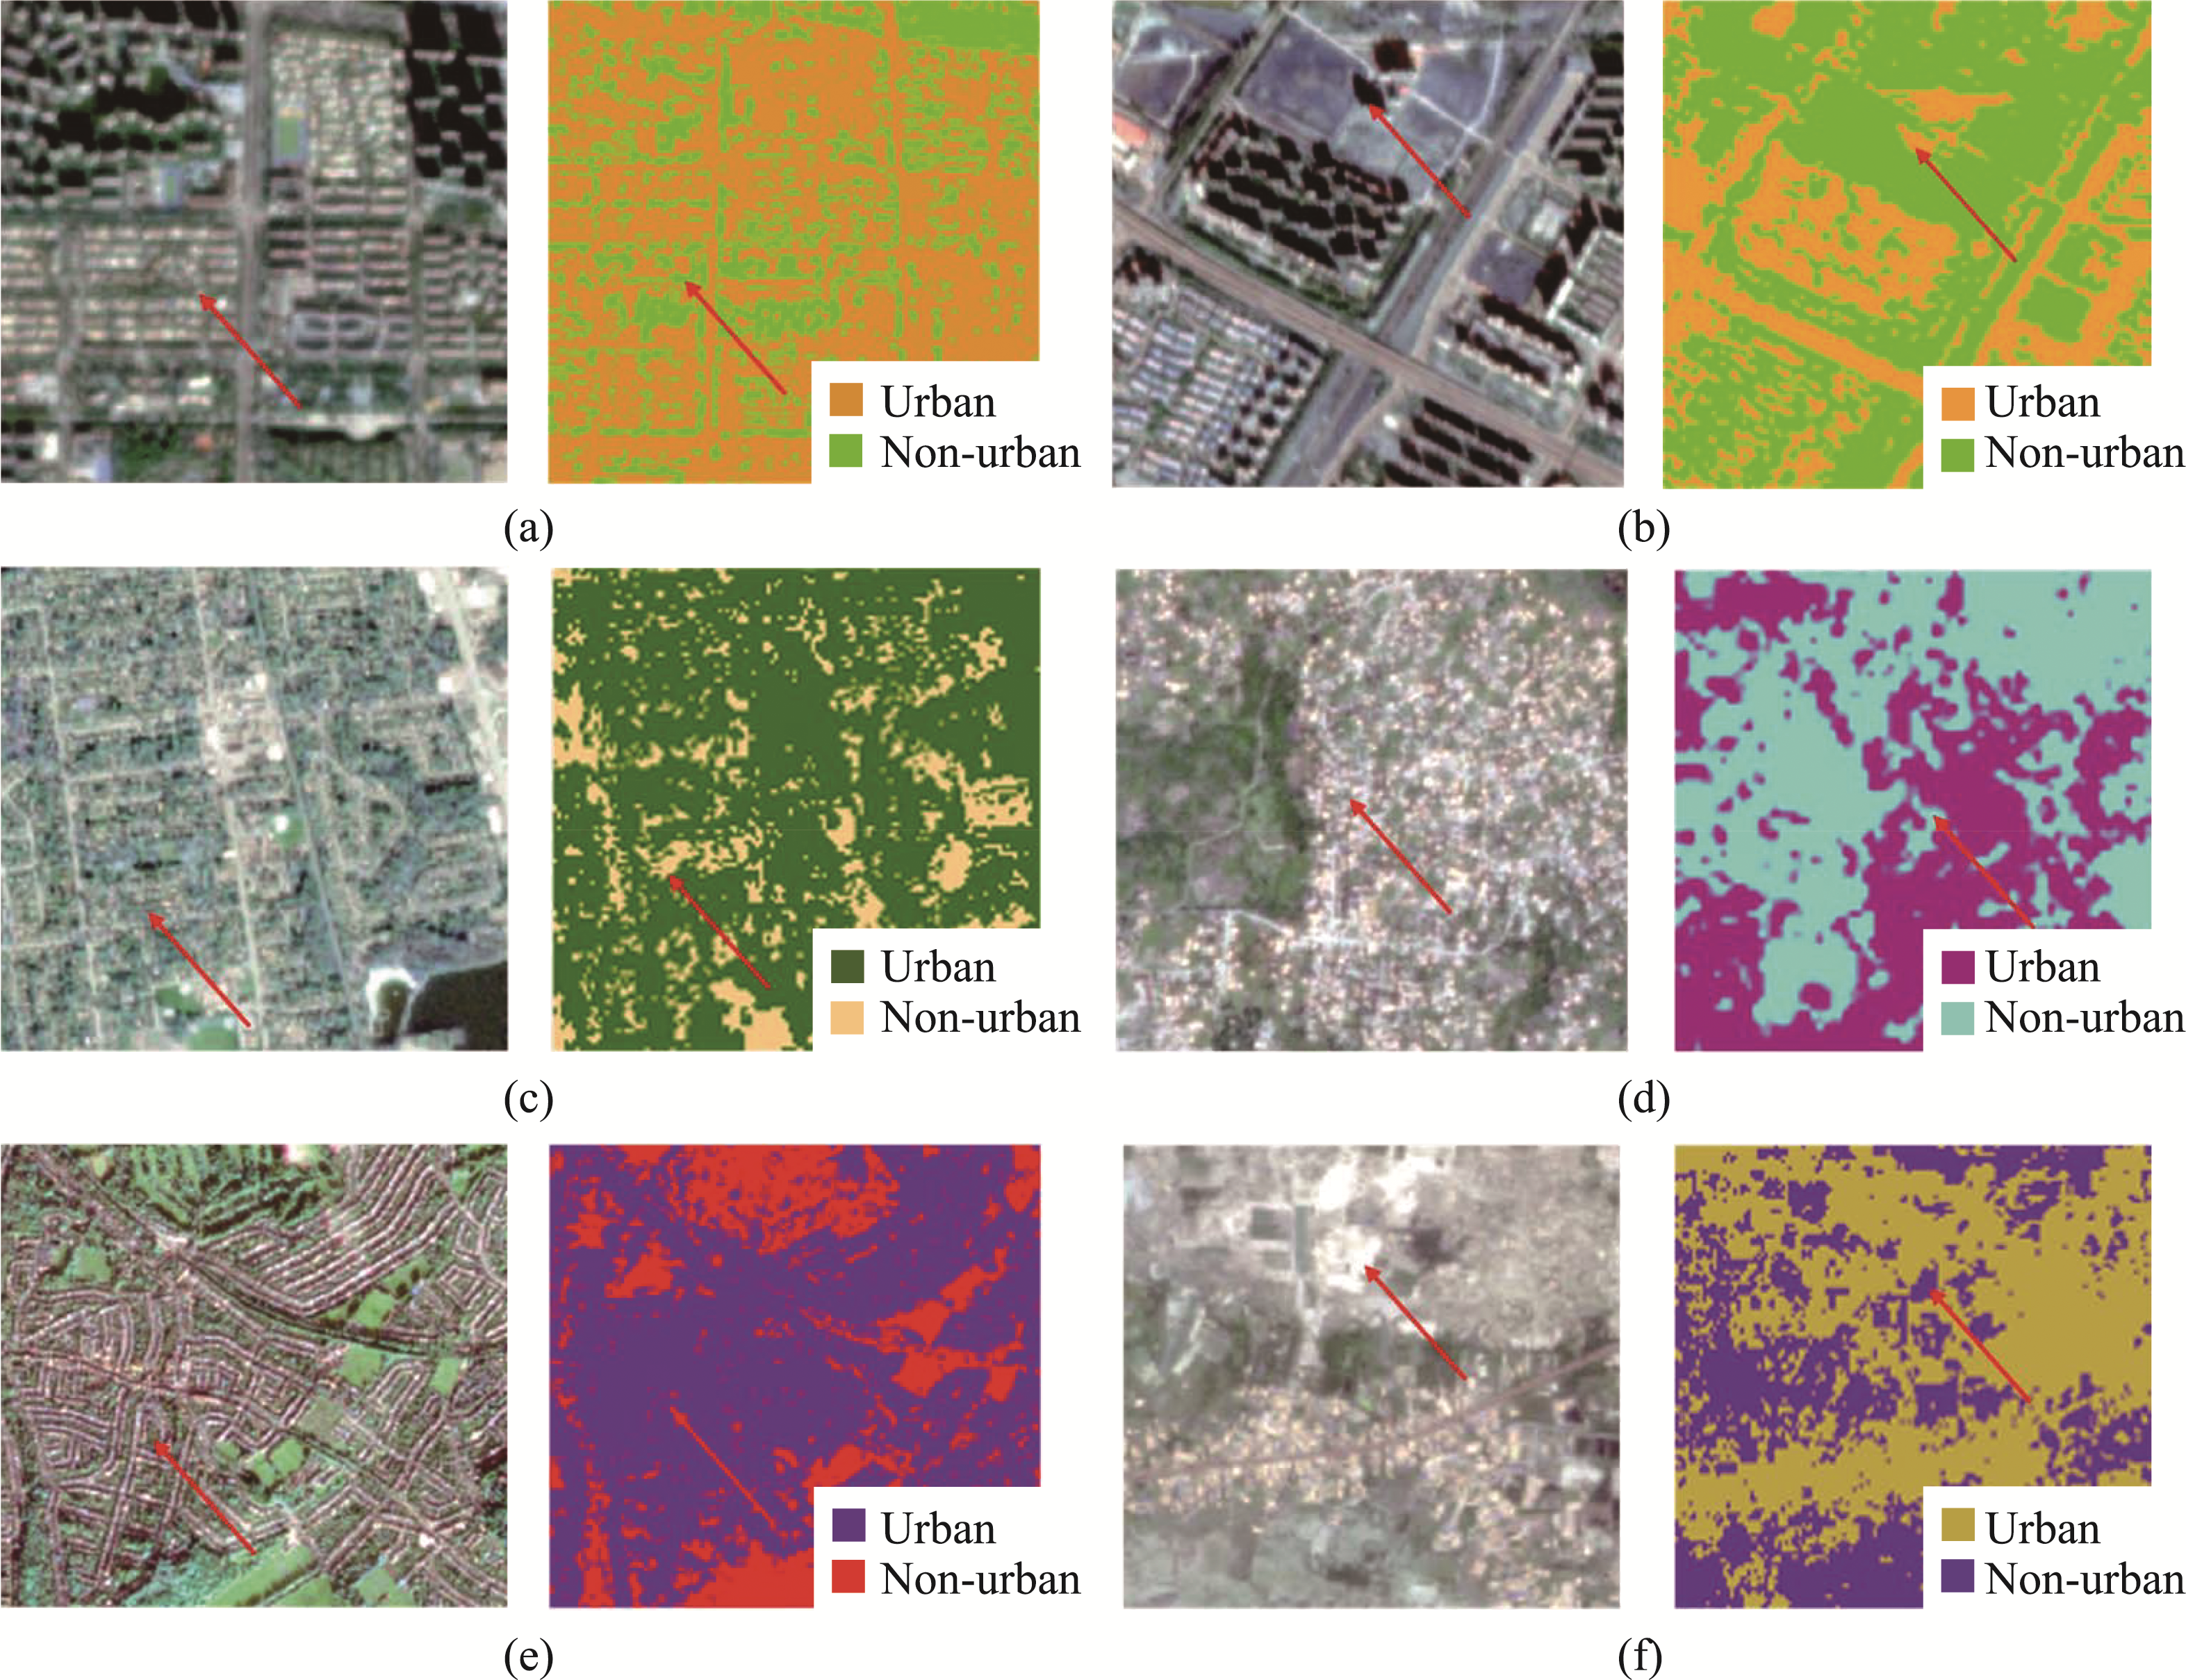
a to h images of UF extraction results based on four traditional algorithms, both pixel-based and object-based. Among them, Image a and b are from Beijing, China, c and d are from New Delhi, India, e and f are from Mansouria, Egypt, and g and h are from Porto Alegre, Brazil.
Figure 11
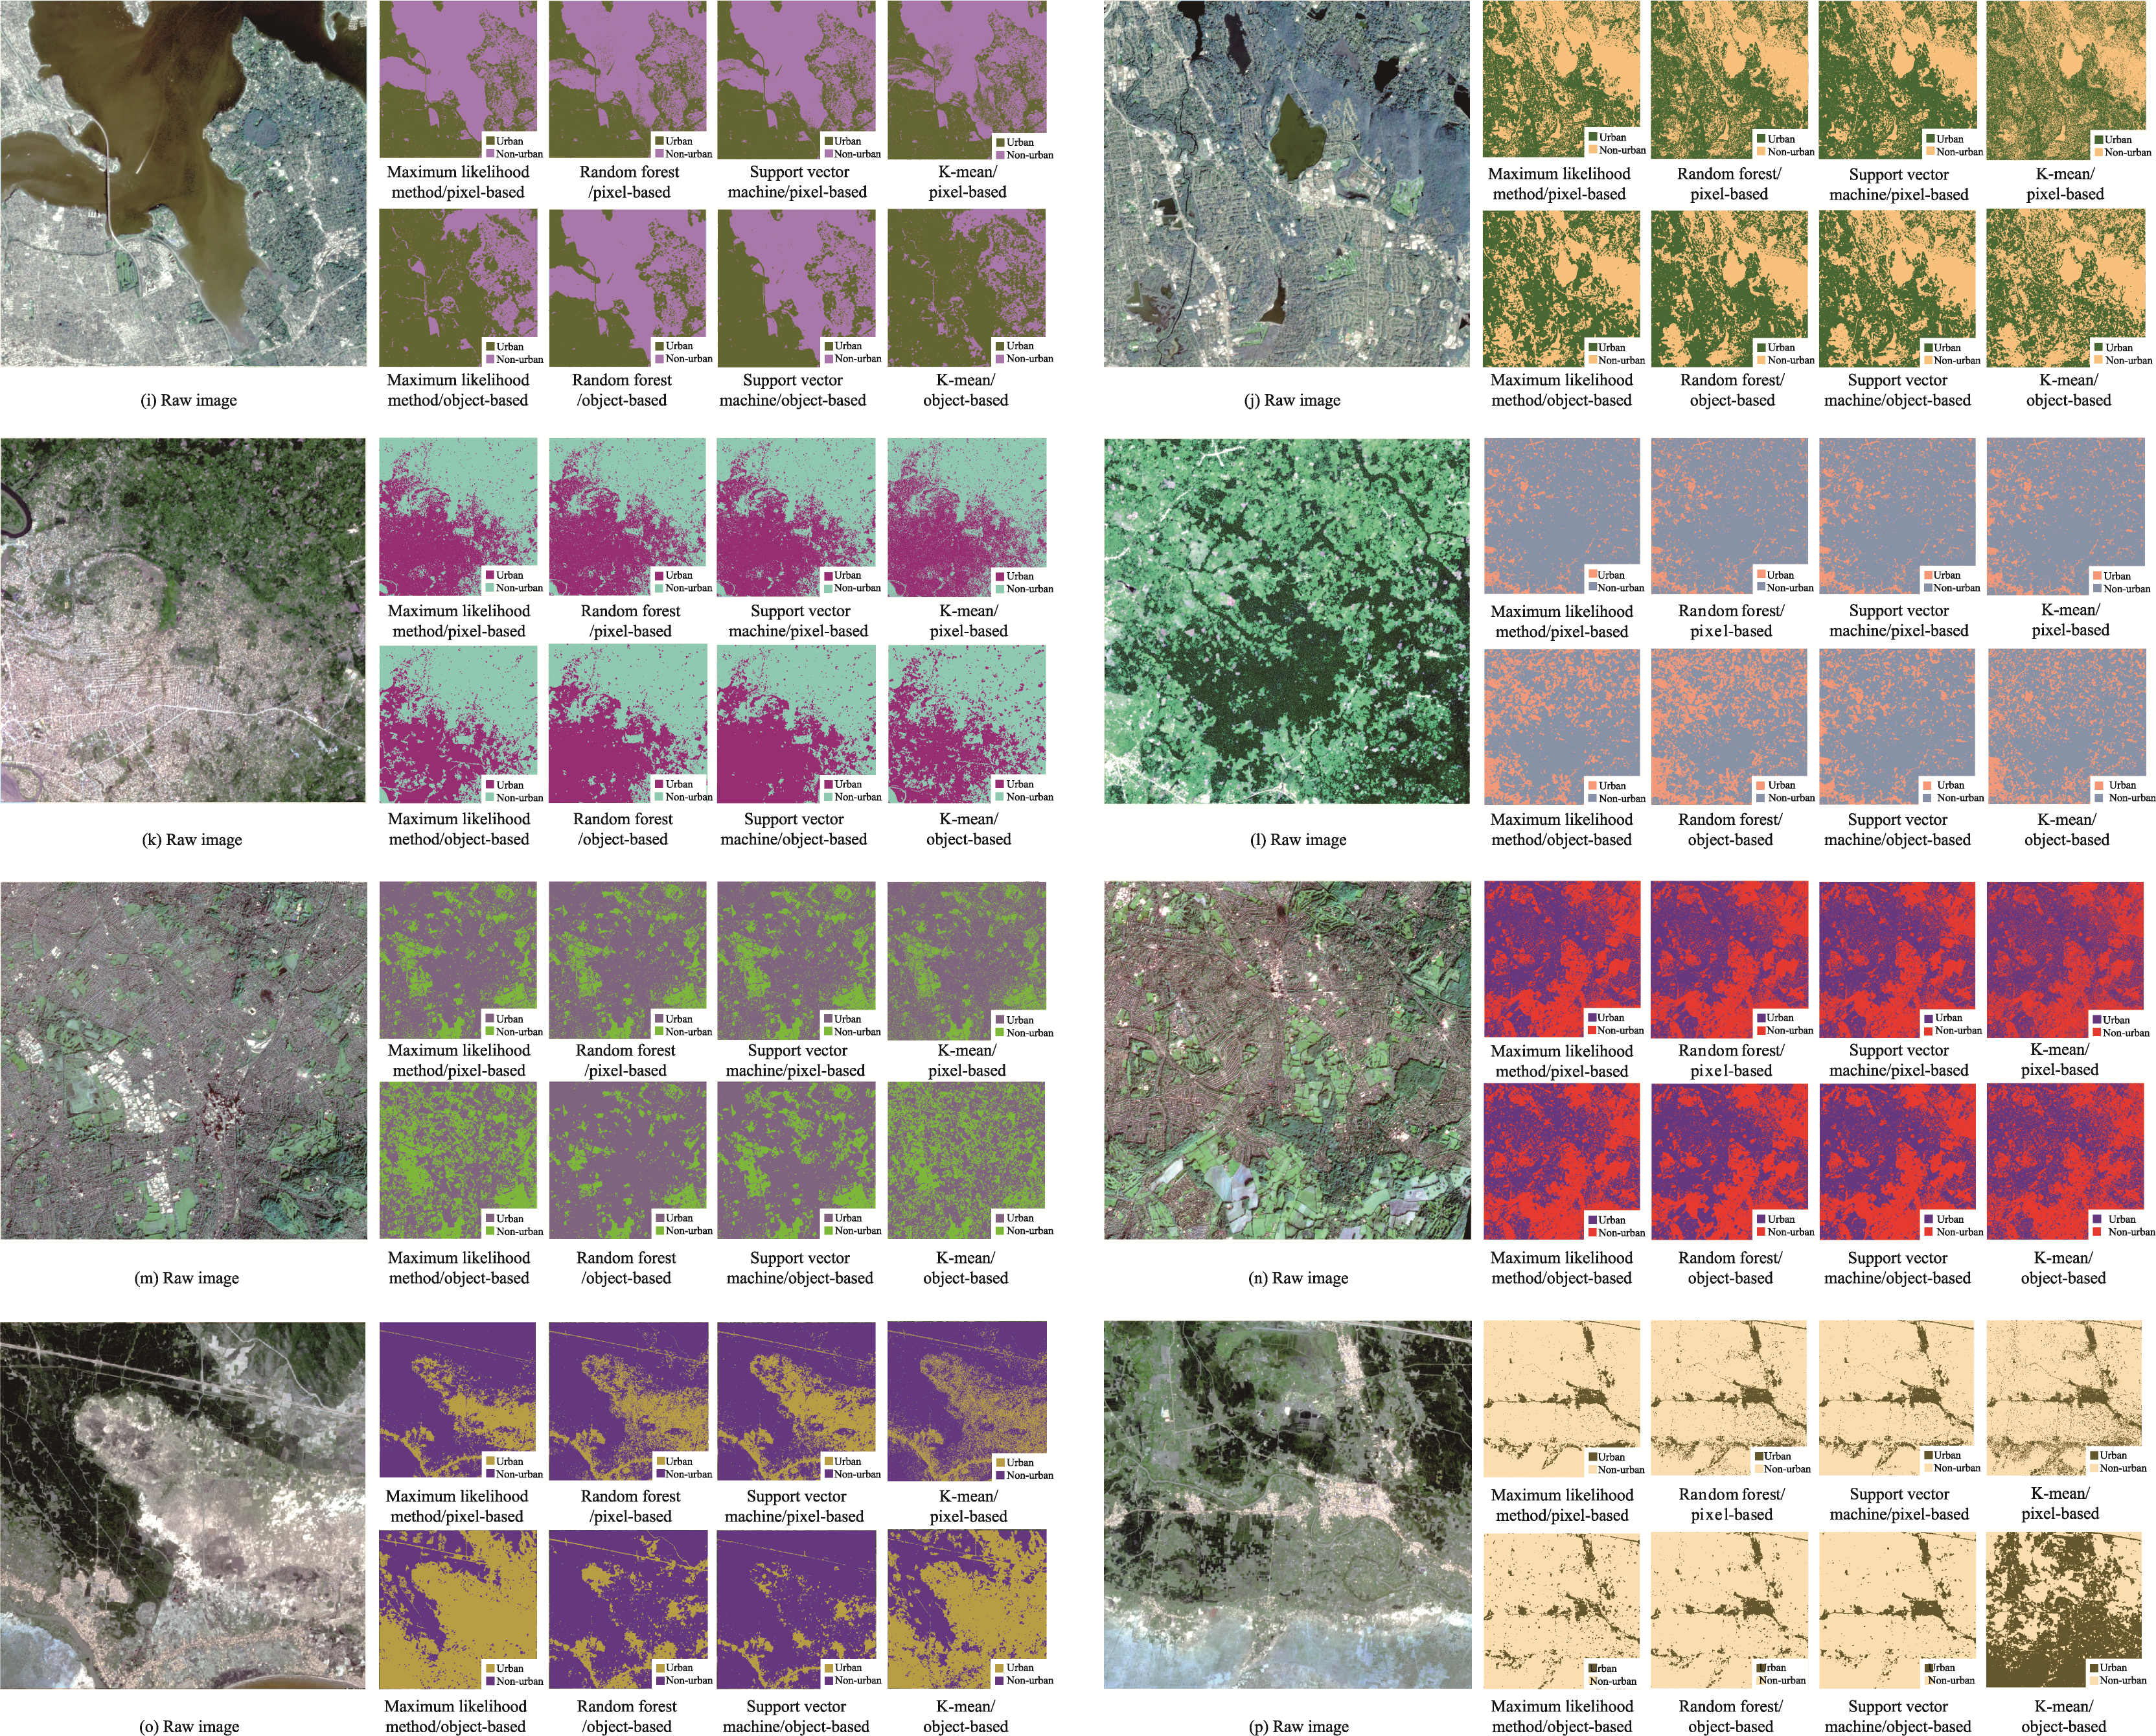
The results of UF extraction based on four traditional algorithms, both pixel-based and object-based, are presented for images i through p. Among them, Image i and j from New York, USA, k and l from Kisangani, Sudan, m and n from London, UK, o and p from Phan Thiet, Vietnam.
Figure 12
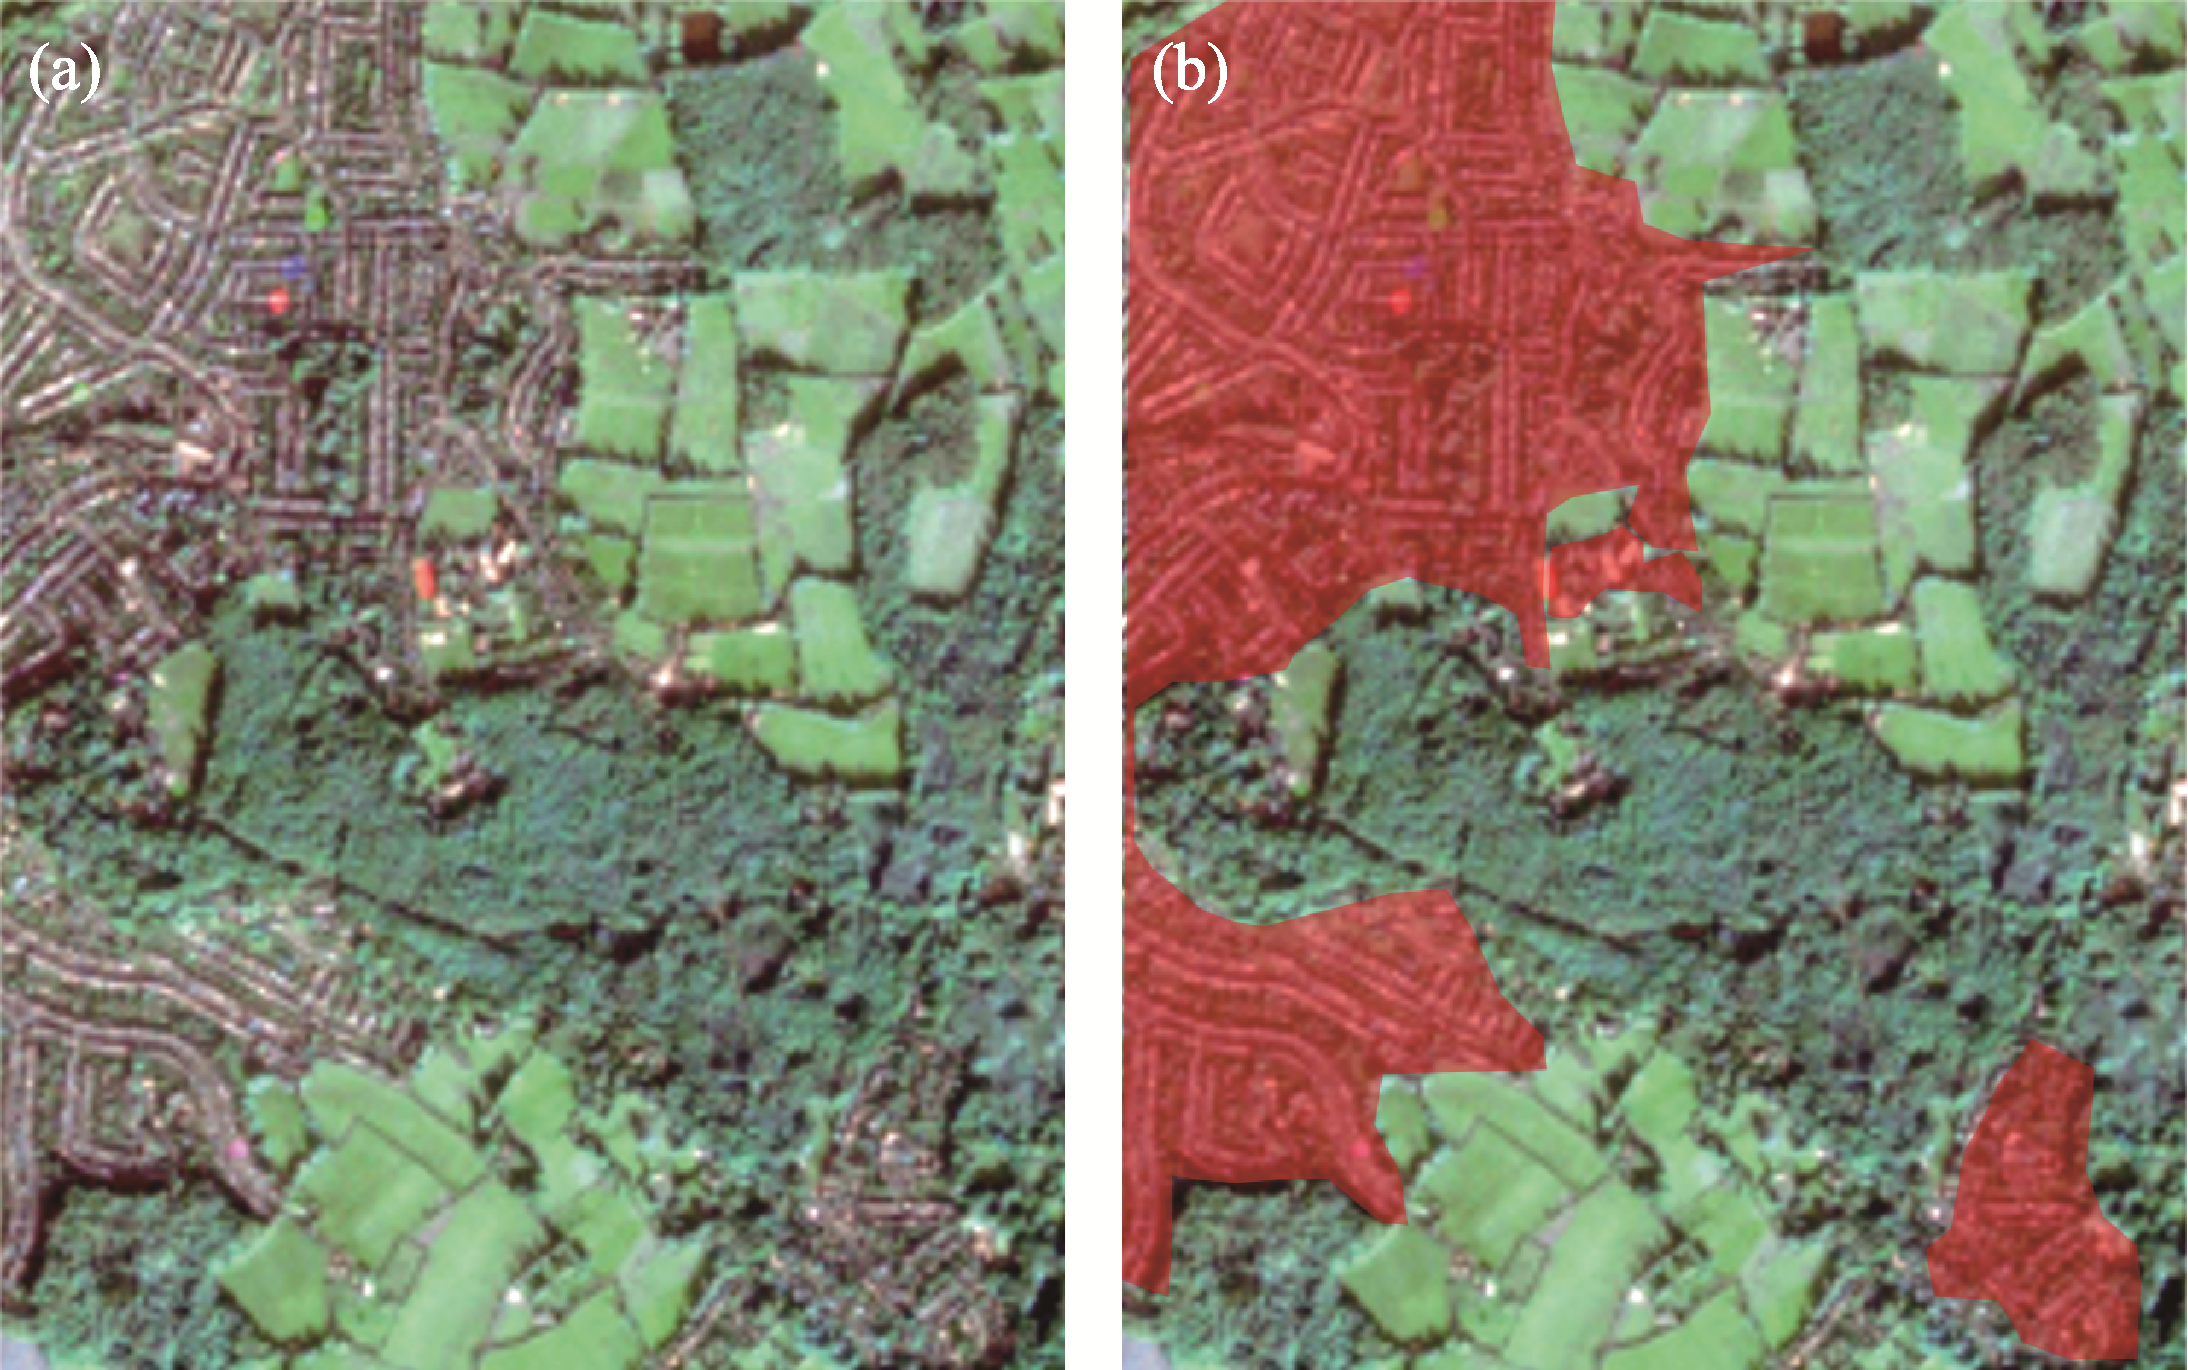
Partial classification misclassification region visualization results (pixel-based)
Figure 13
Object-based Kappa precision numerical graph for UF extraction based on four traditional algorithms
Figure 14
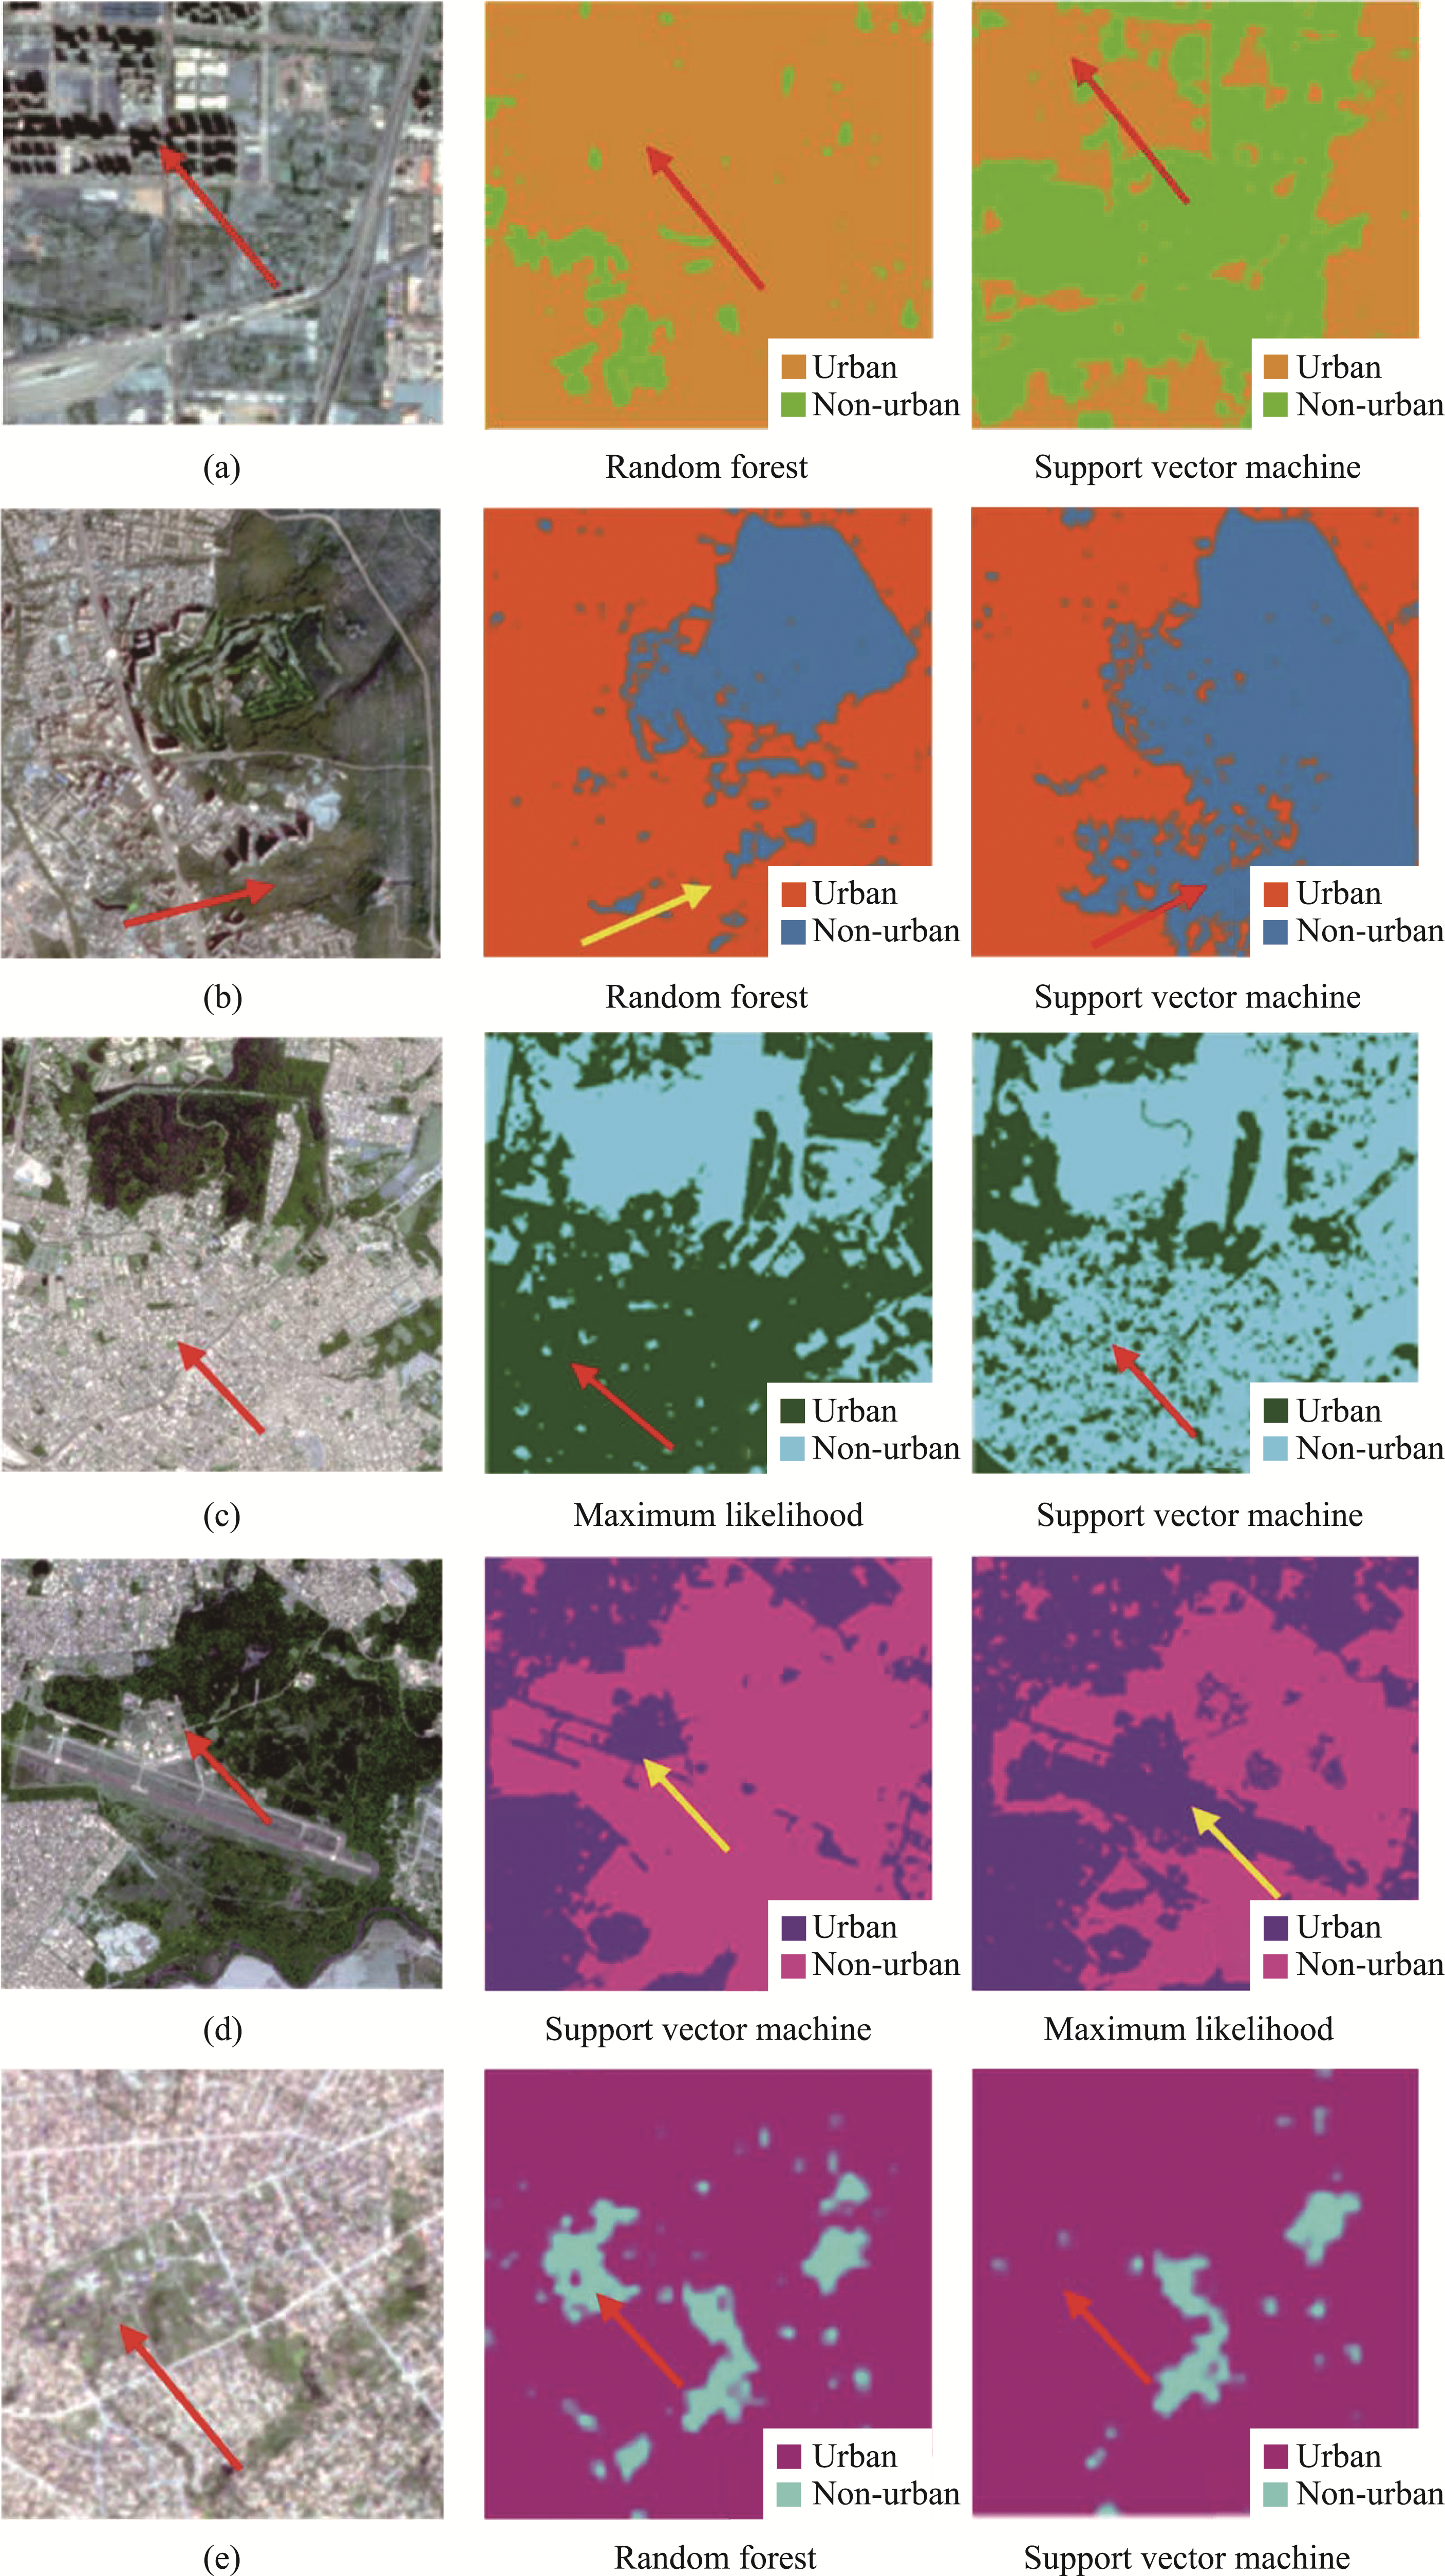
Partial classification misclassification region visualization results (object-based)
Figure 16
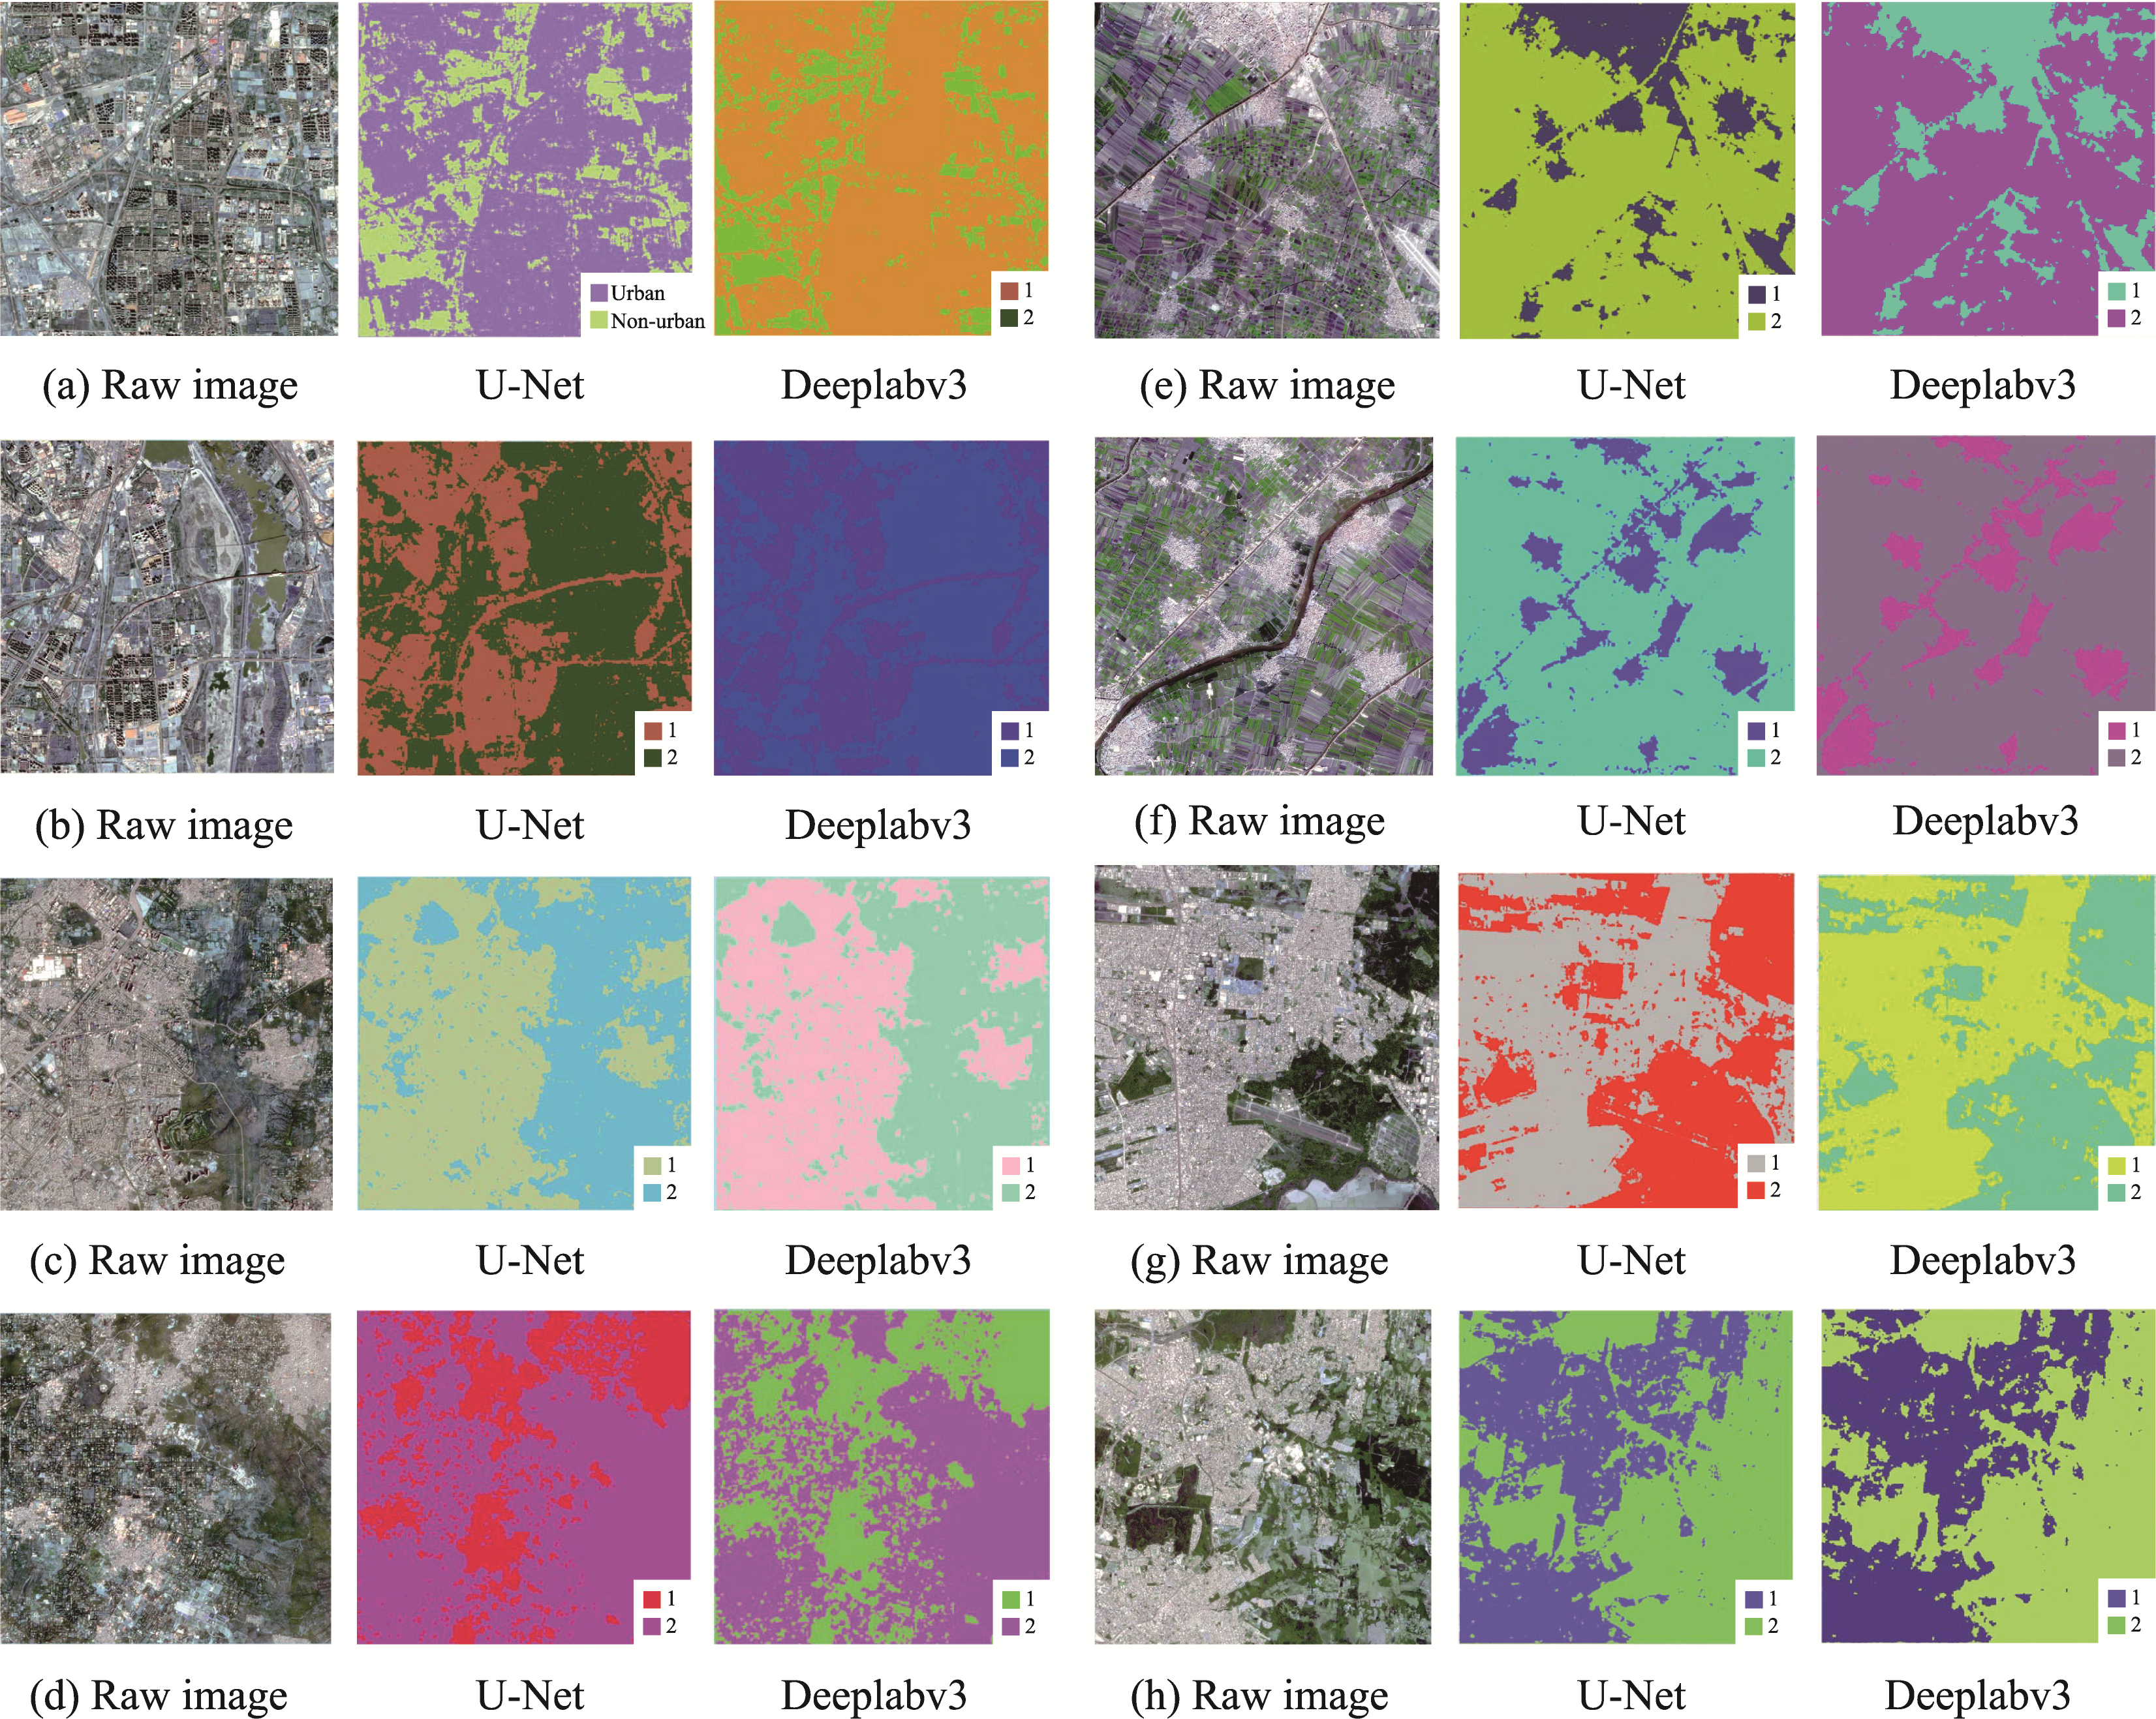
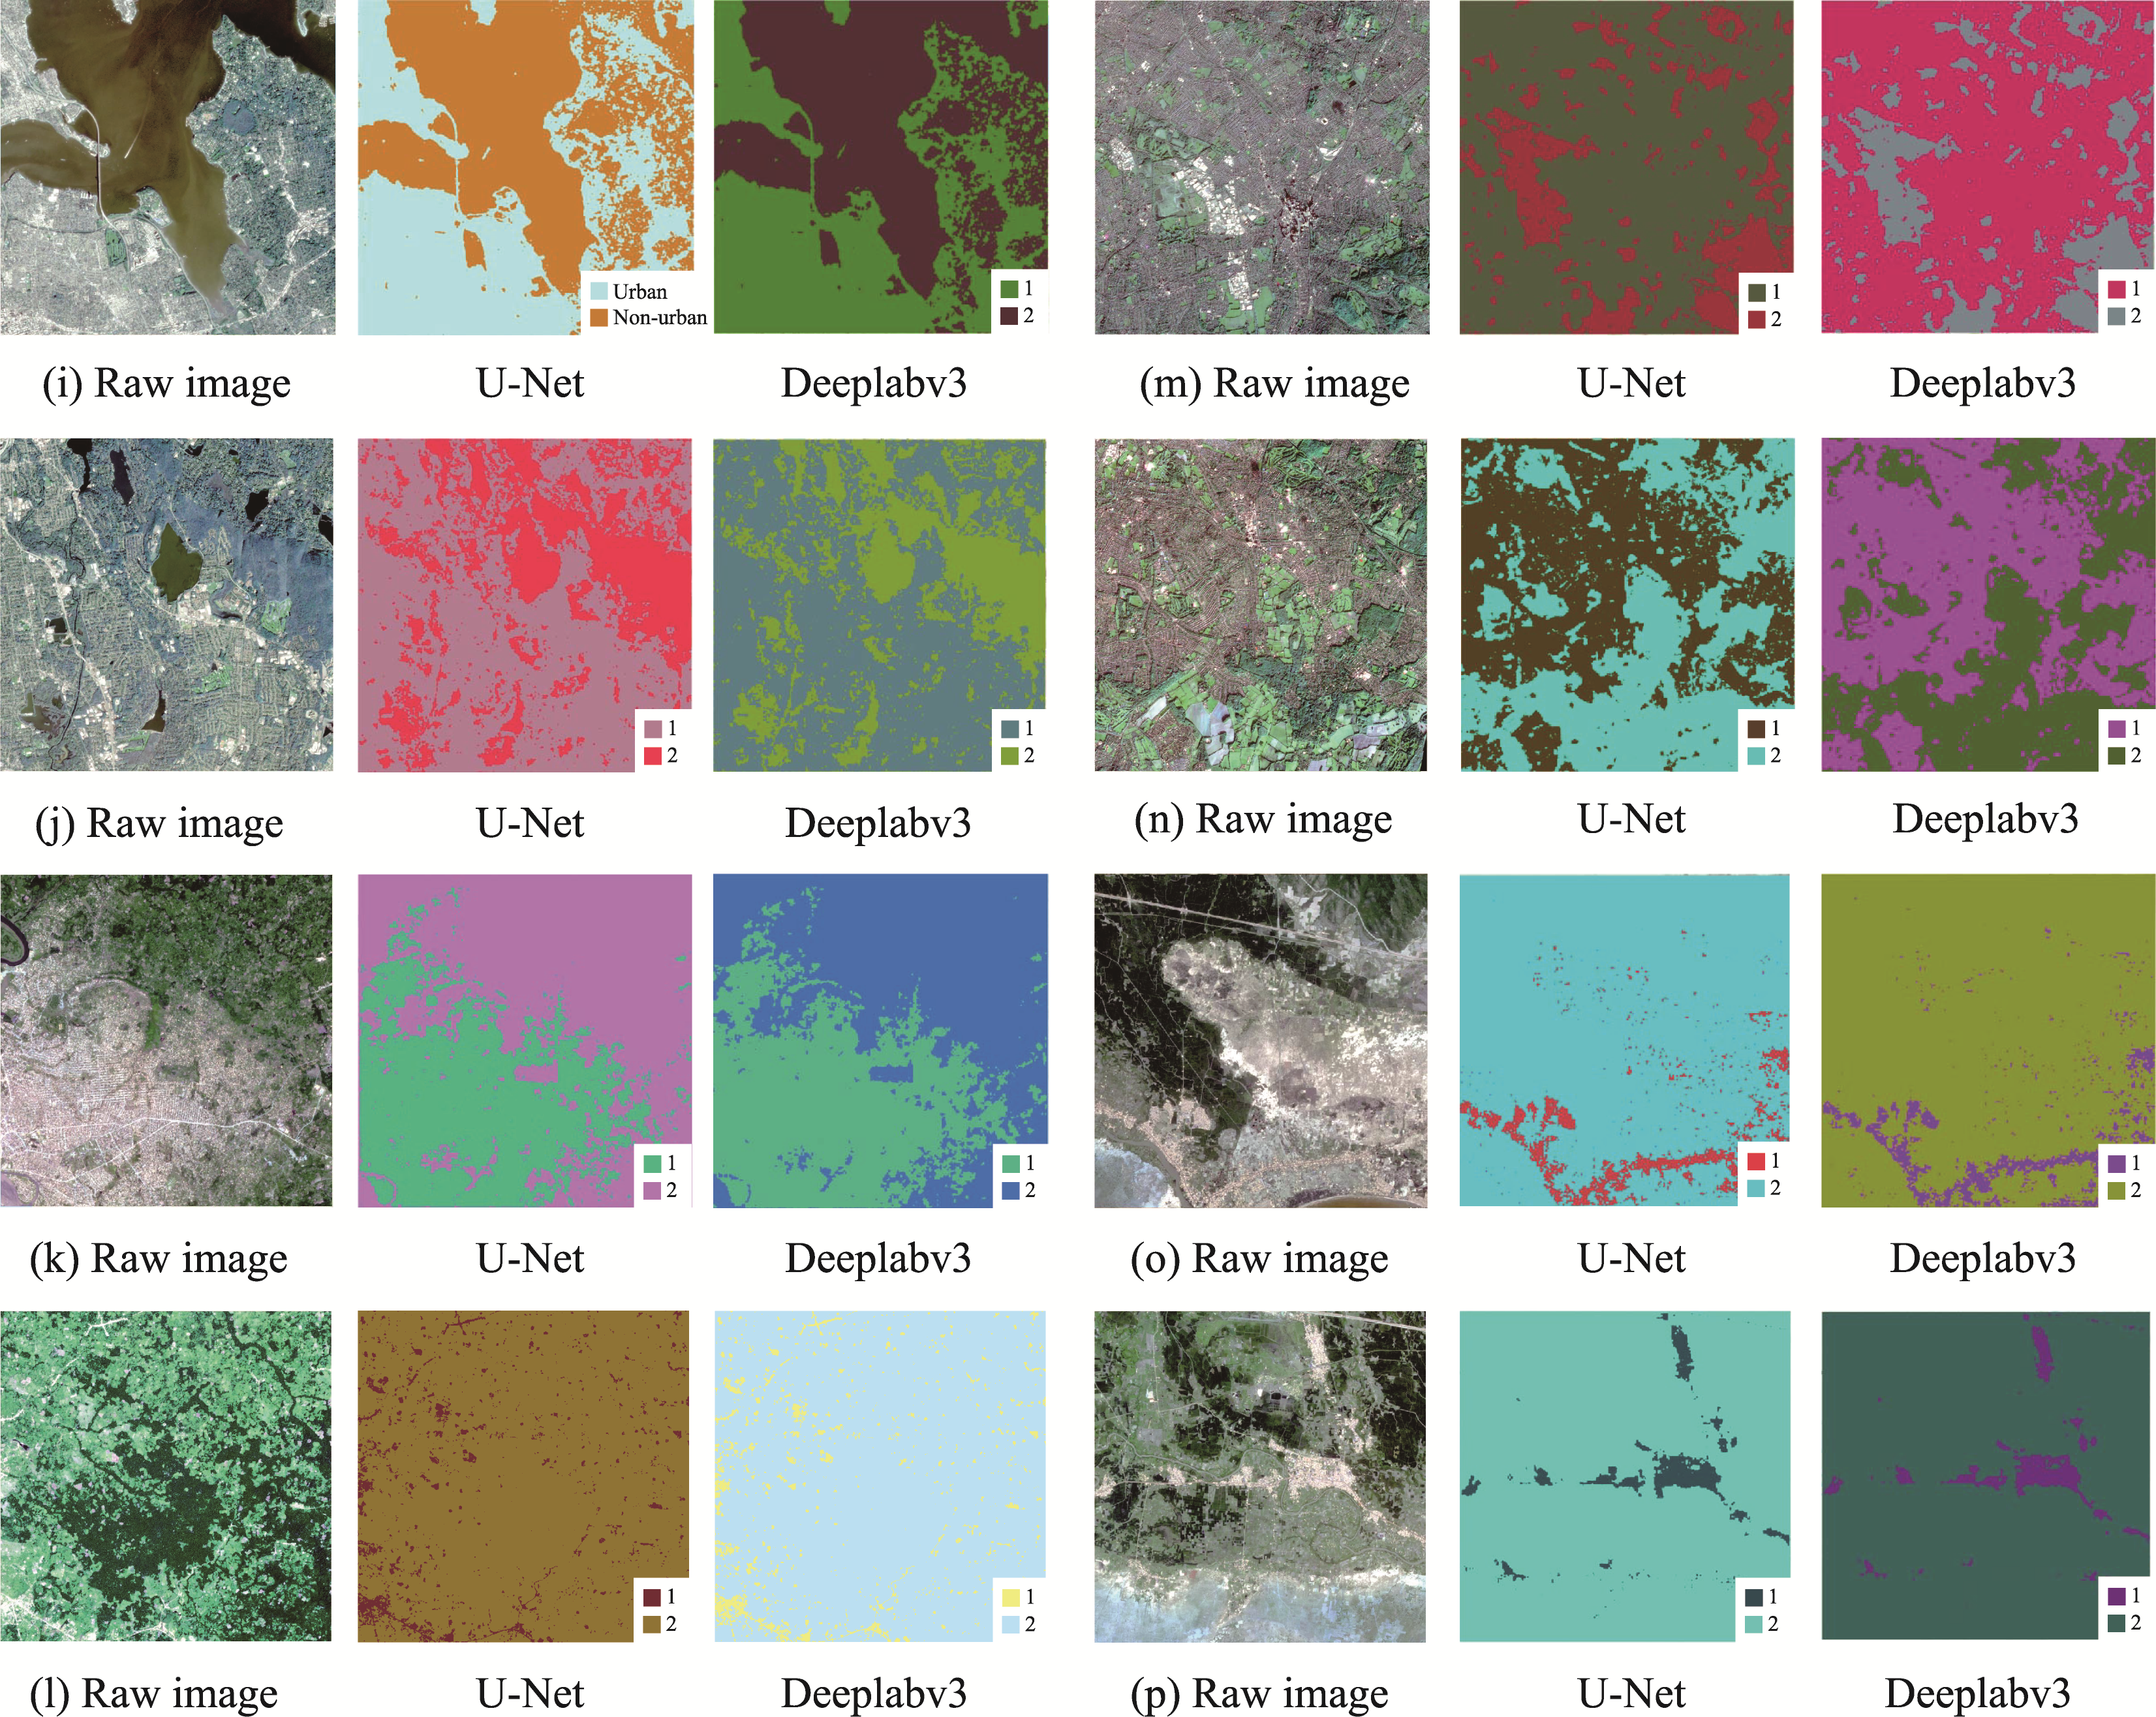
a to h images of UF extraction results based on two deep learning algorithms. Among them, Image a and b are from Beijing, China, c and d are from New Delhi, India, e and f are from Mansouria, Egypt, and g and h are from Porto Alegre, Brazil. In the legend, 1 represents urban areas and 2 represents non-urban areas.
Figure 17
The results of UF extraction based on two deep learning algorithms, are presented for images i through p. Among them, Images i and j are from New York, USA, k and l from Kisangani, Sudan, m and n from London, UK, o and p from Phan Thiet, Vietnam. In the legend, 1 represents urban areas and 2 represents non-urban areas.
Figure 18
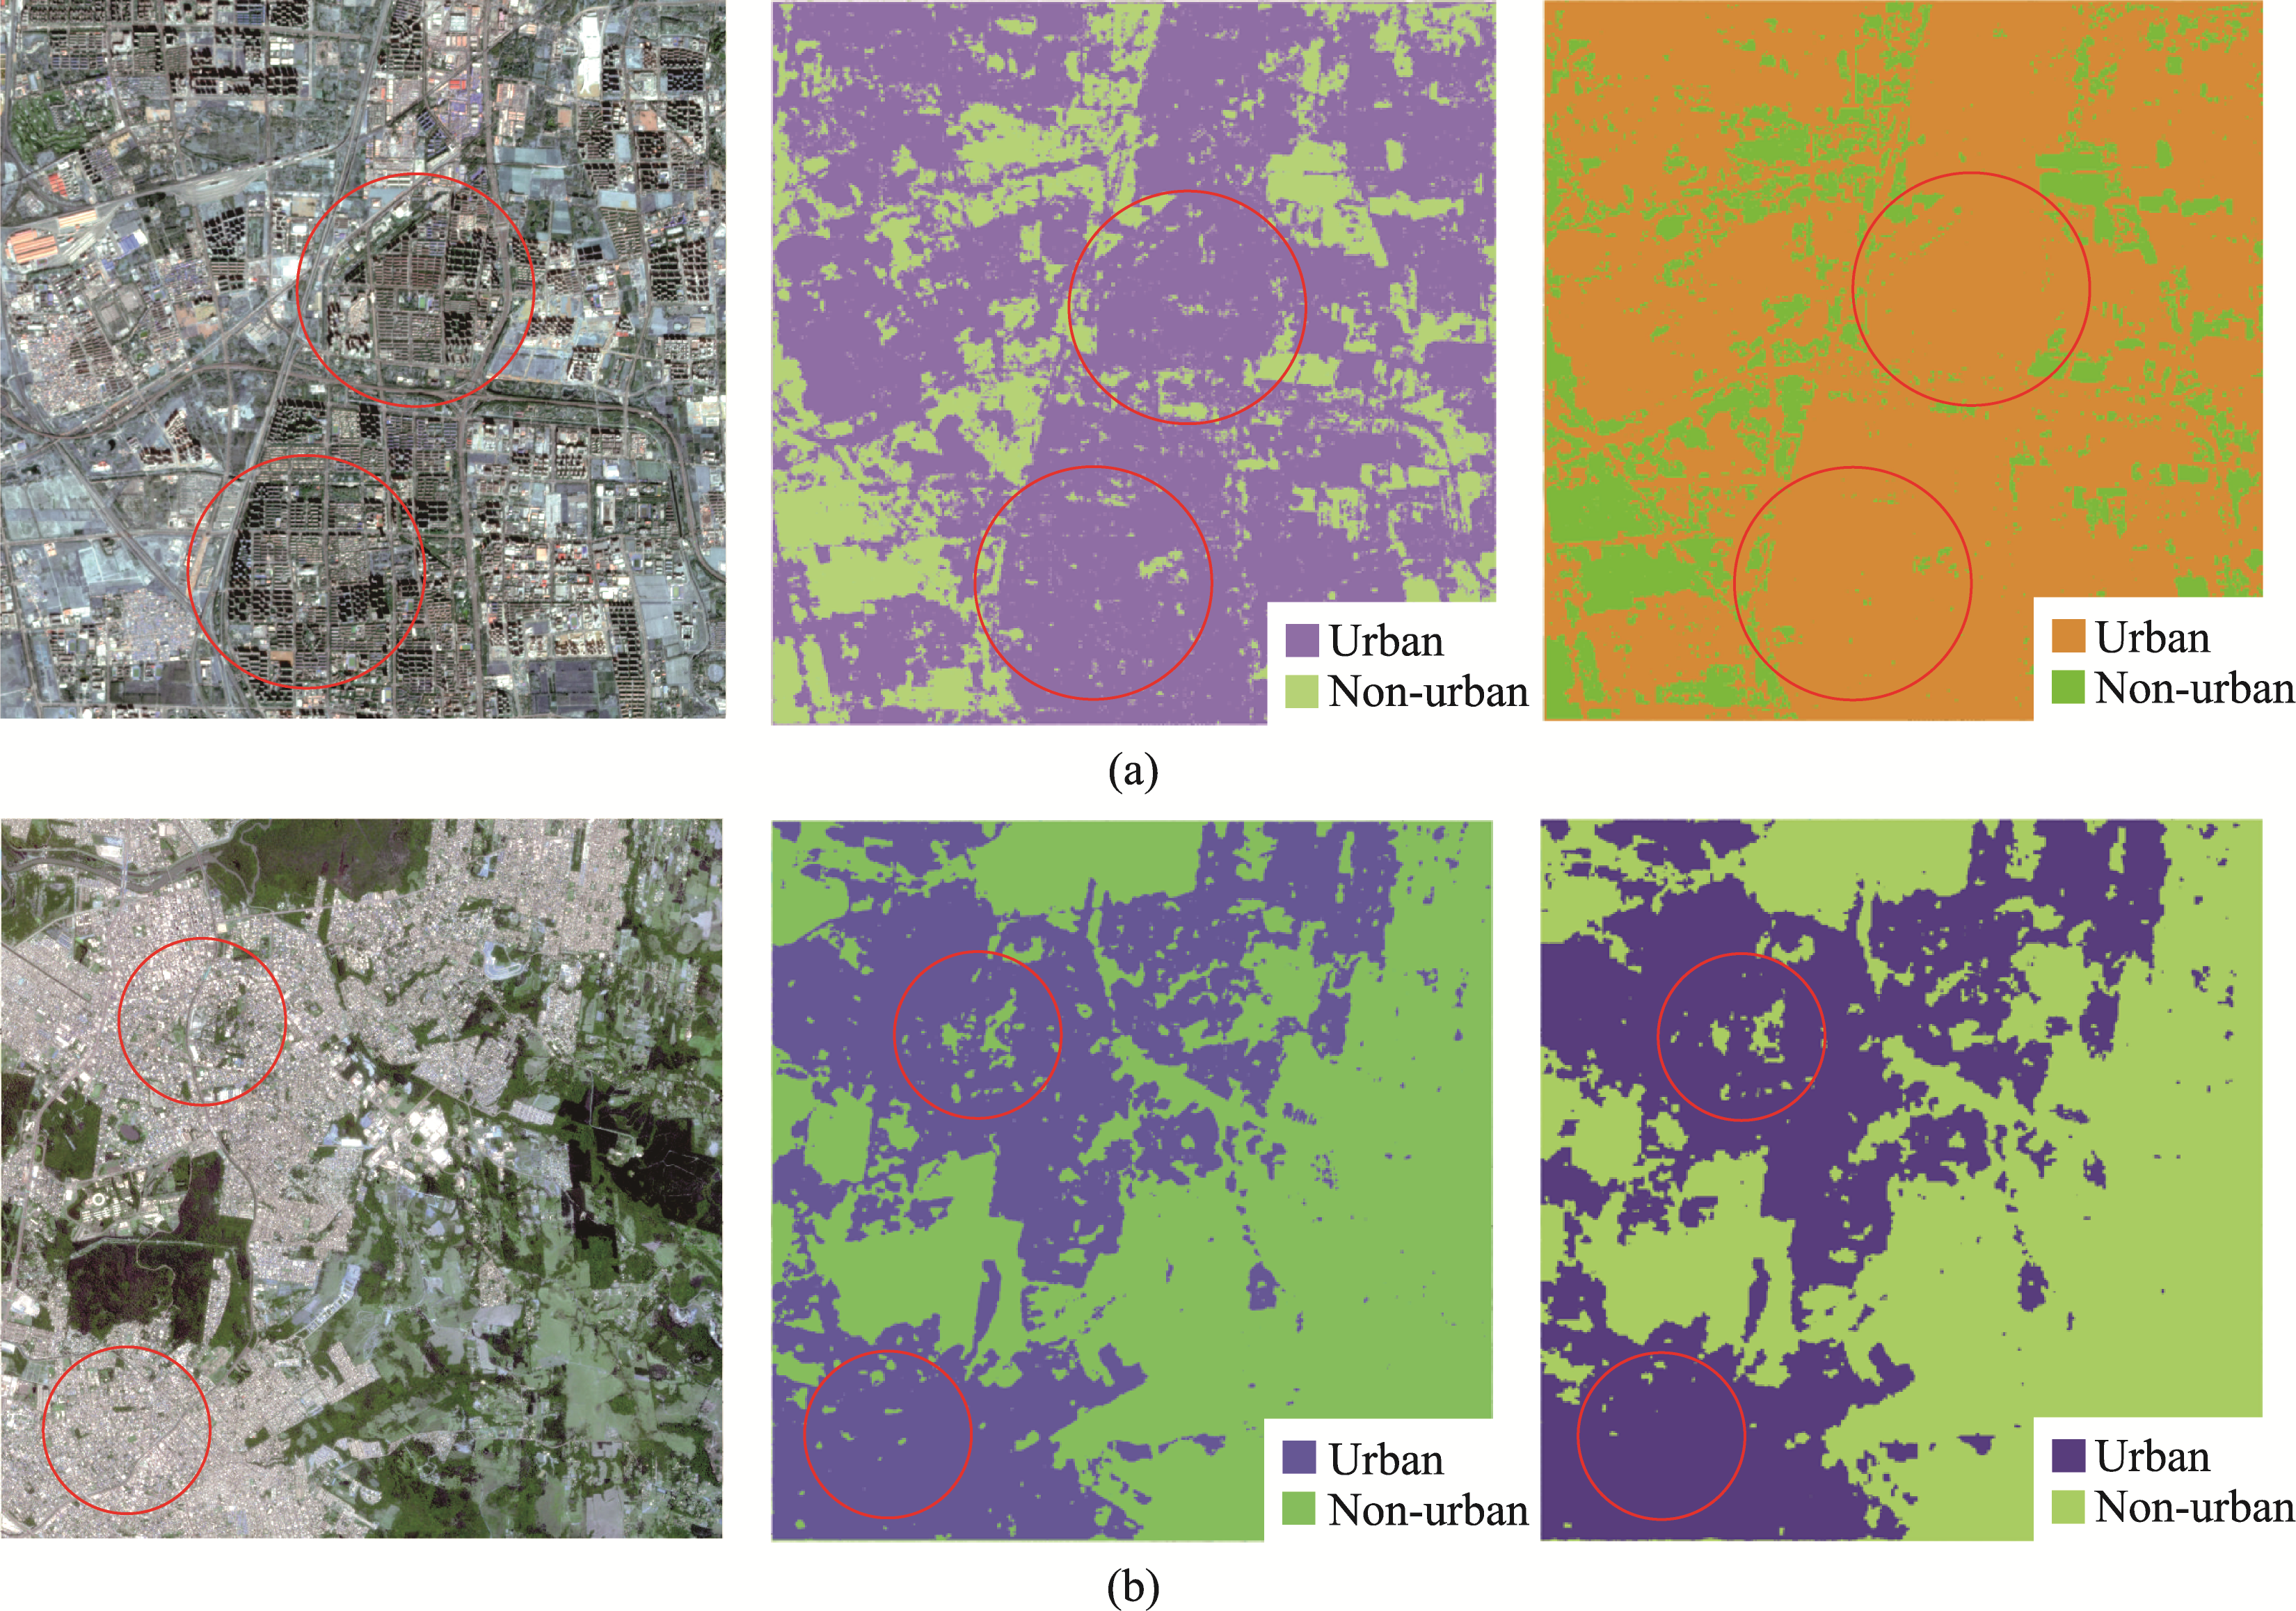
Comparison of UF extraction details between the two deep learning algorithms. Graph a shows that U-Net misclassifies some of the urban shadows, and graph b shows that DeeplabV3 misclassifies some of the smaller inner-city public green spaces. The circle represents the misjudged area.
Table 2
Summary of Kappa precision values for UF extraction based on SAM
Figure 19
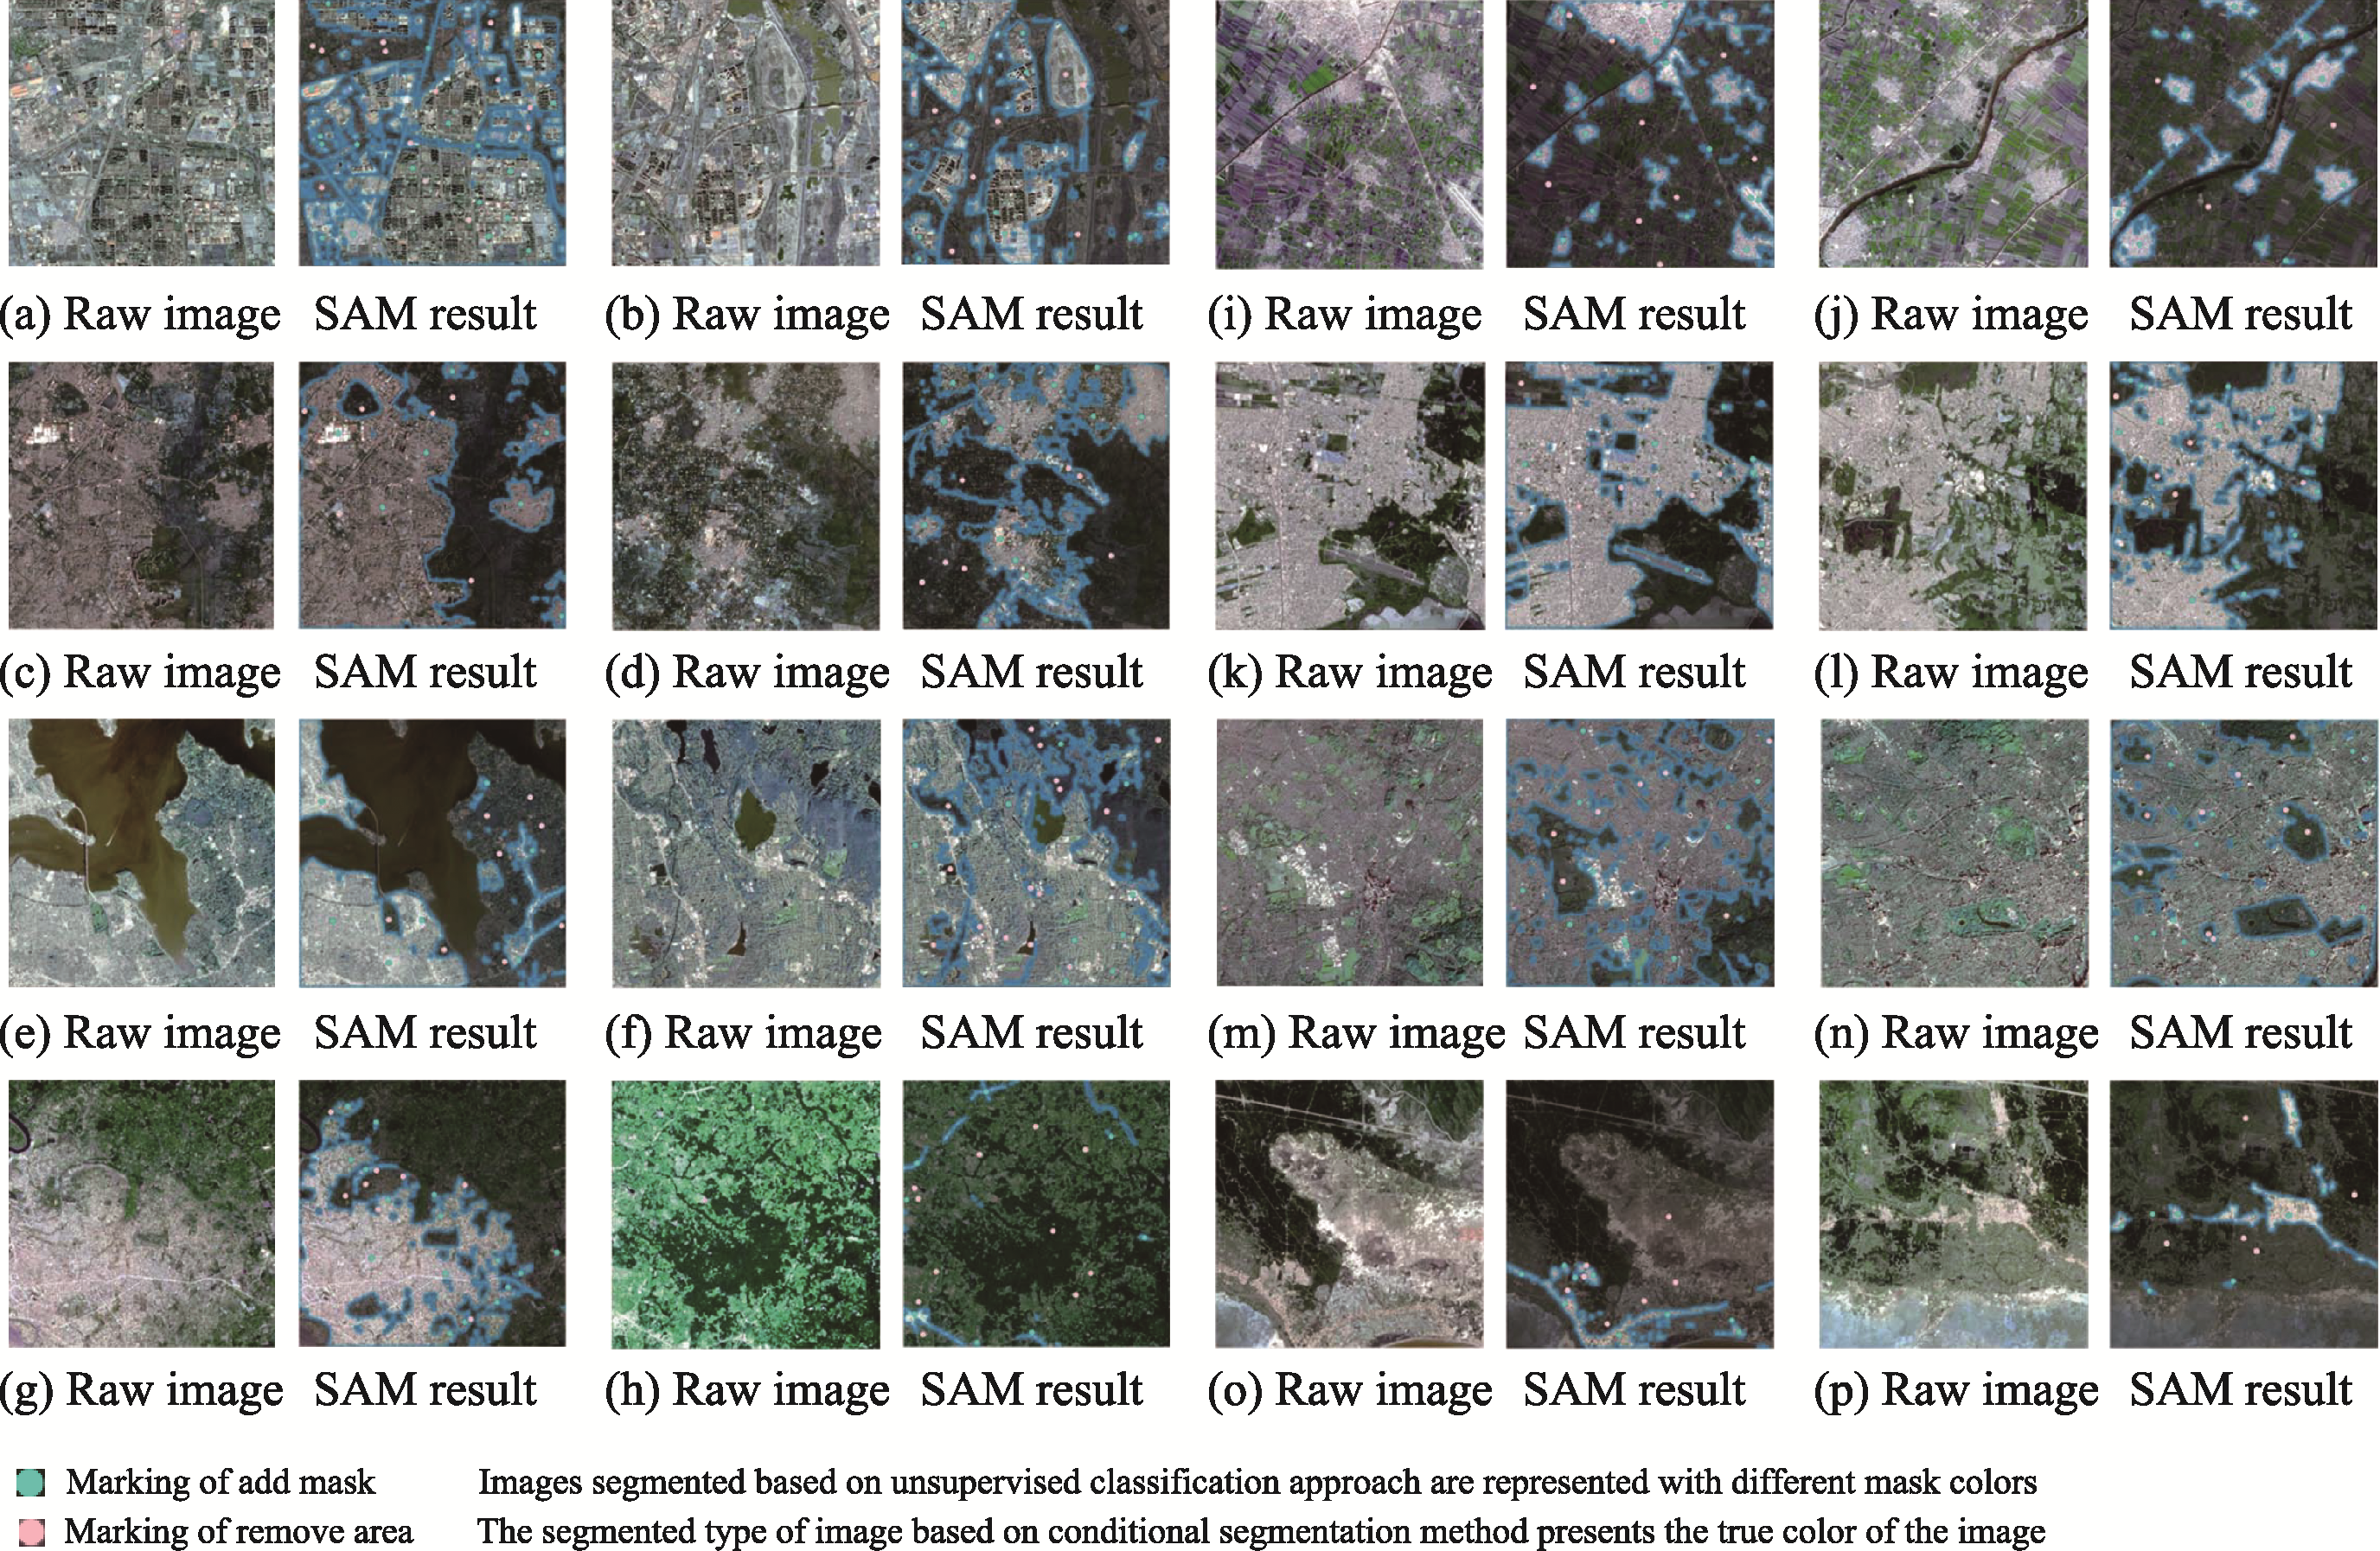
SAM-based UF extraction result diagrams, the extracted urban areas show the original colour that distinguishes them from non-urban areas, with a blue border distinguishing the two types of environments. Among them, Images a and b are from Beijing, China, c and d are from New Delhi, India, e and f are from Mansouria, Egypt, and g and h are from Porto Alegre, Brazil. In the legend, i and j from New York, USA, k and l from Kisangani, Sudan, m and n from London, UK, o and p from Phan Thiet, Vietnam.
Table 3
A detailed comparative analysis of the different segmentation methods