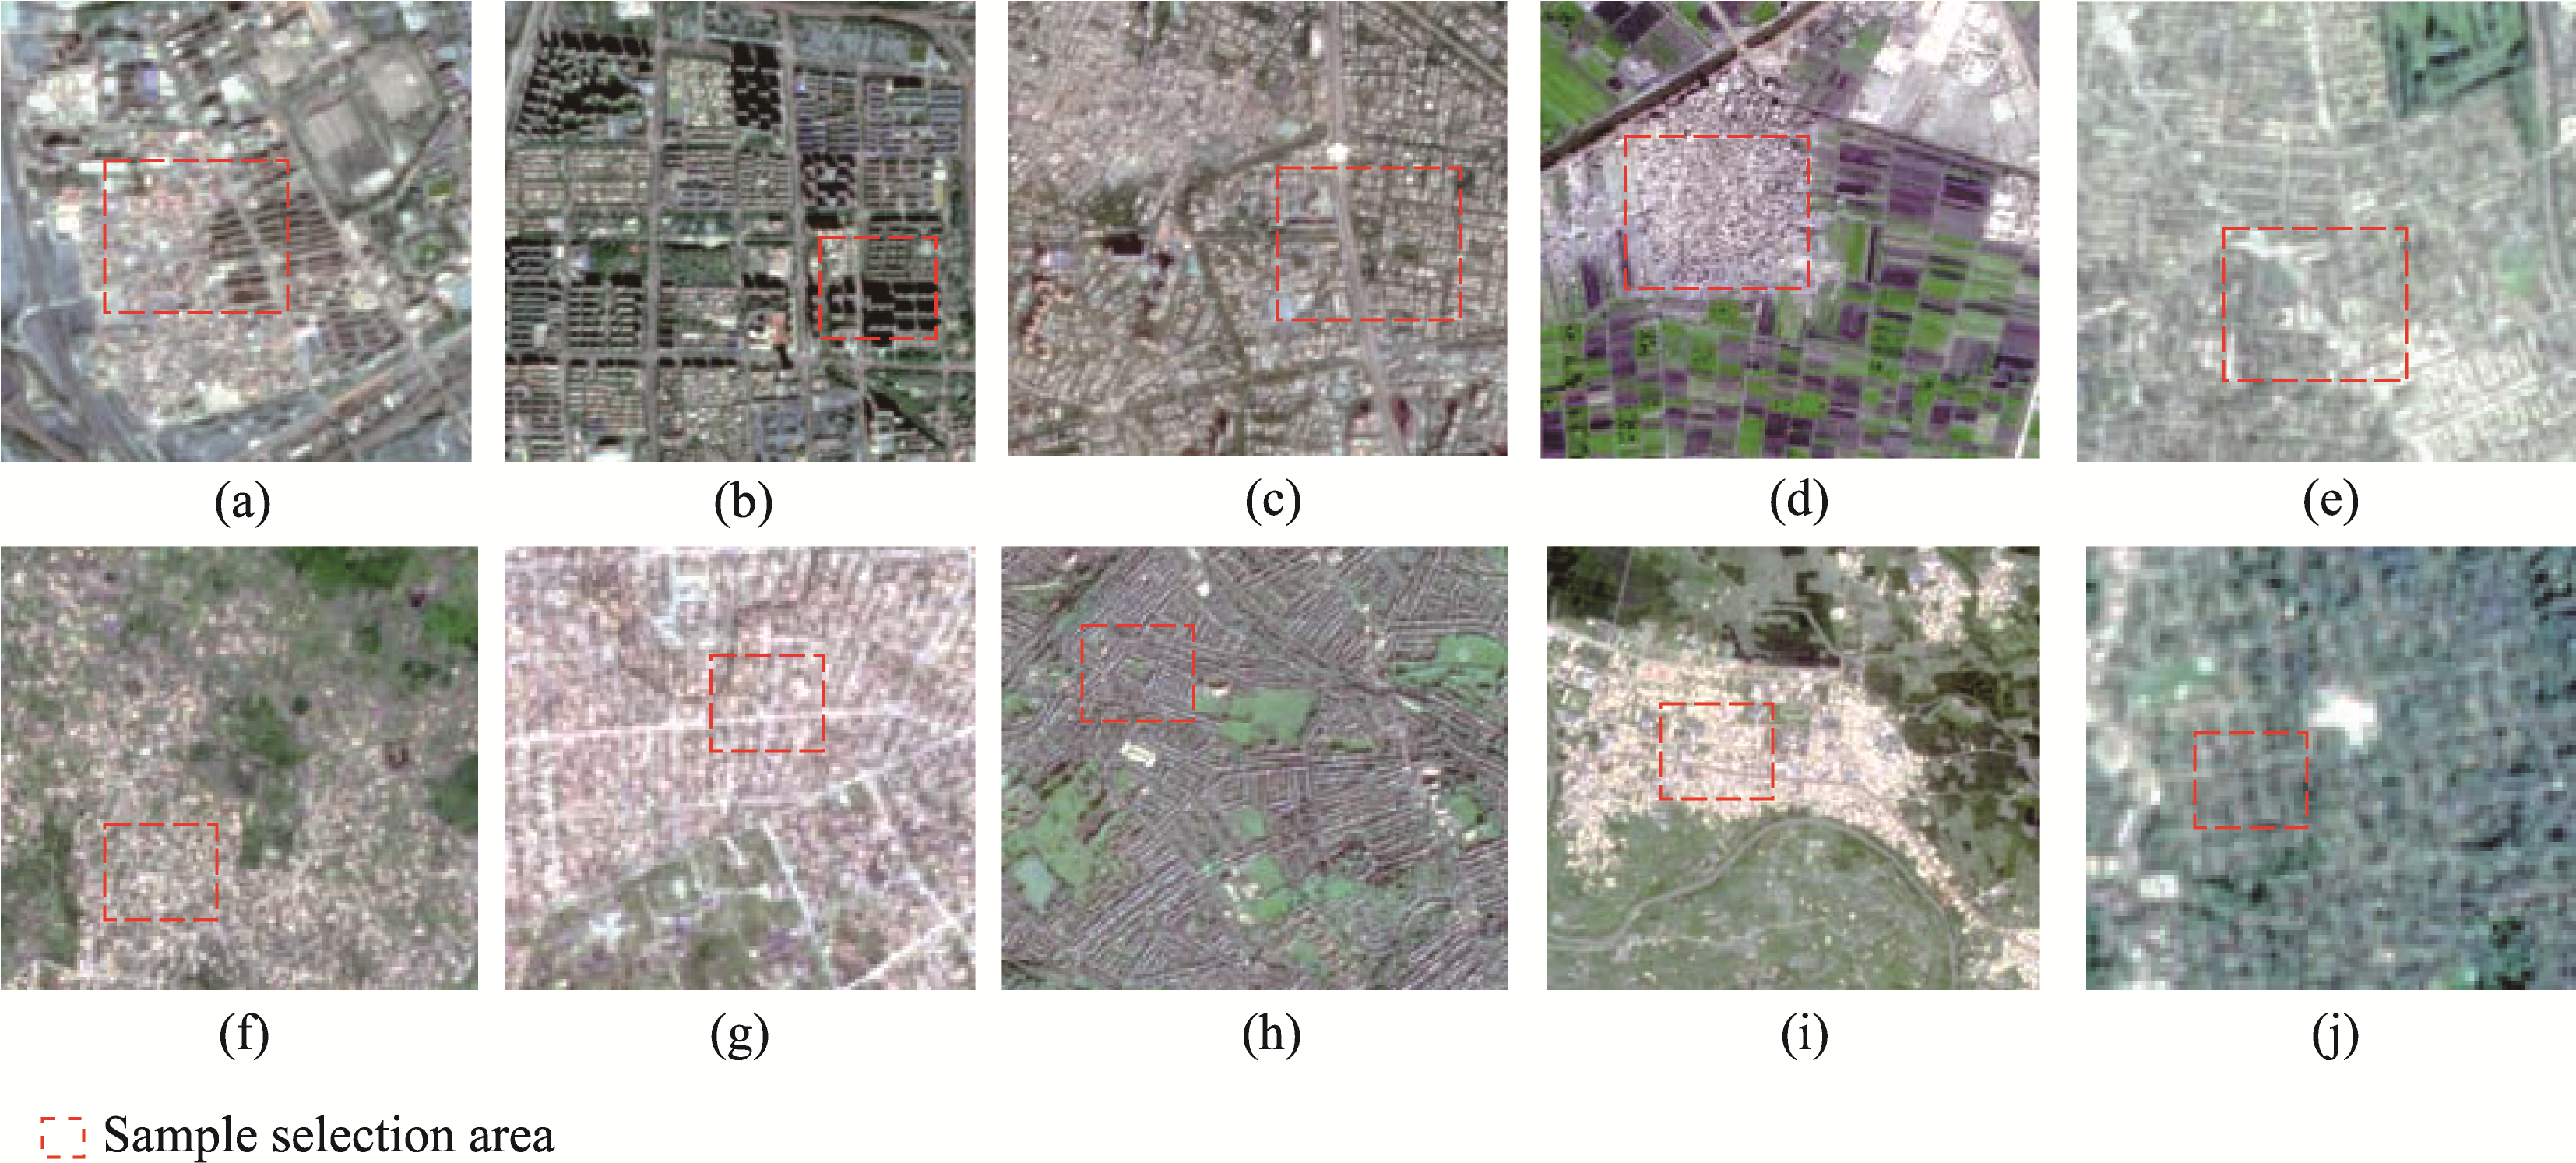
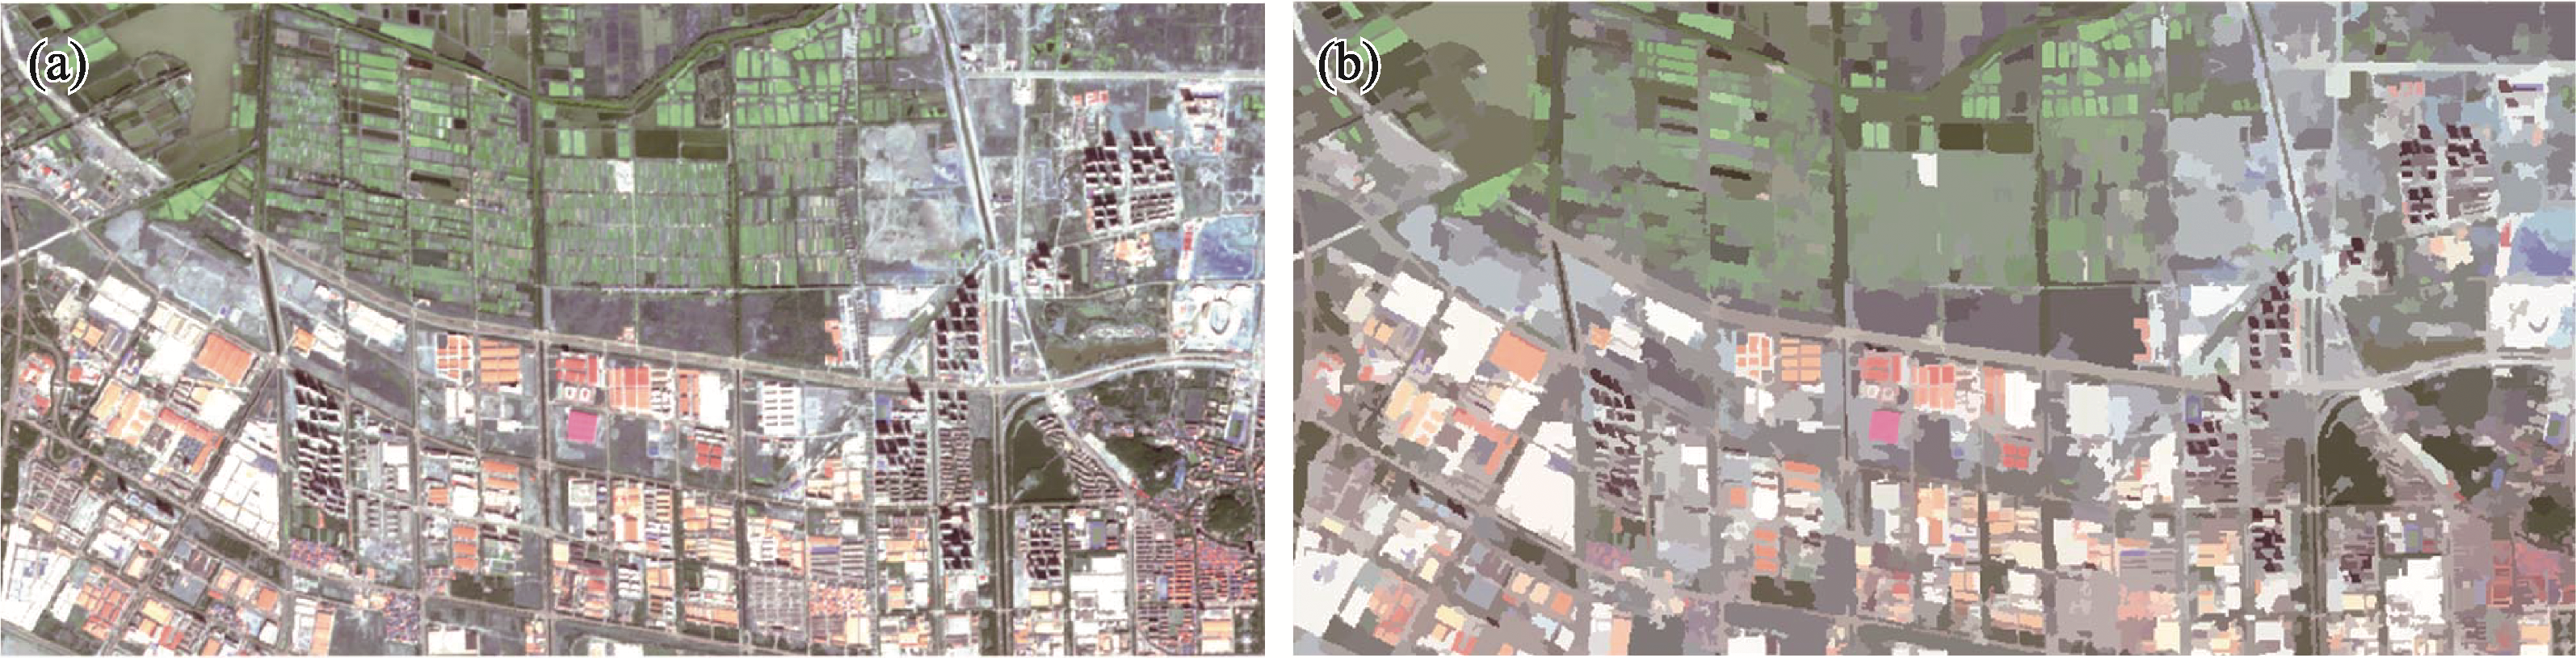
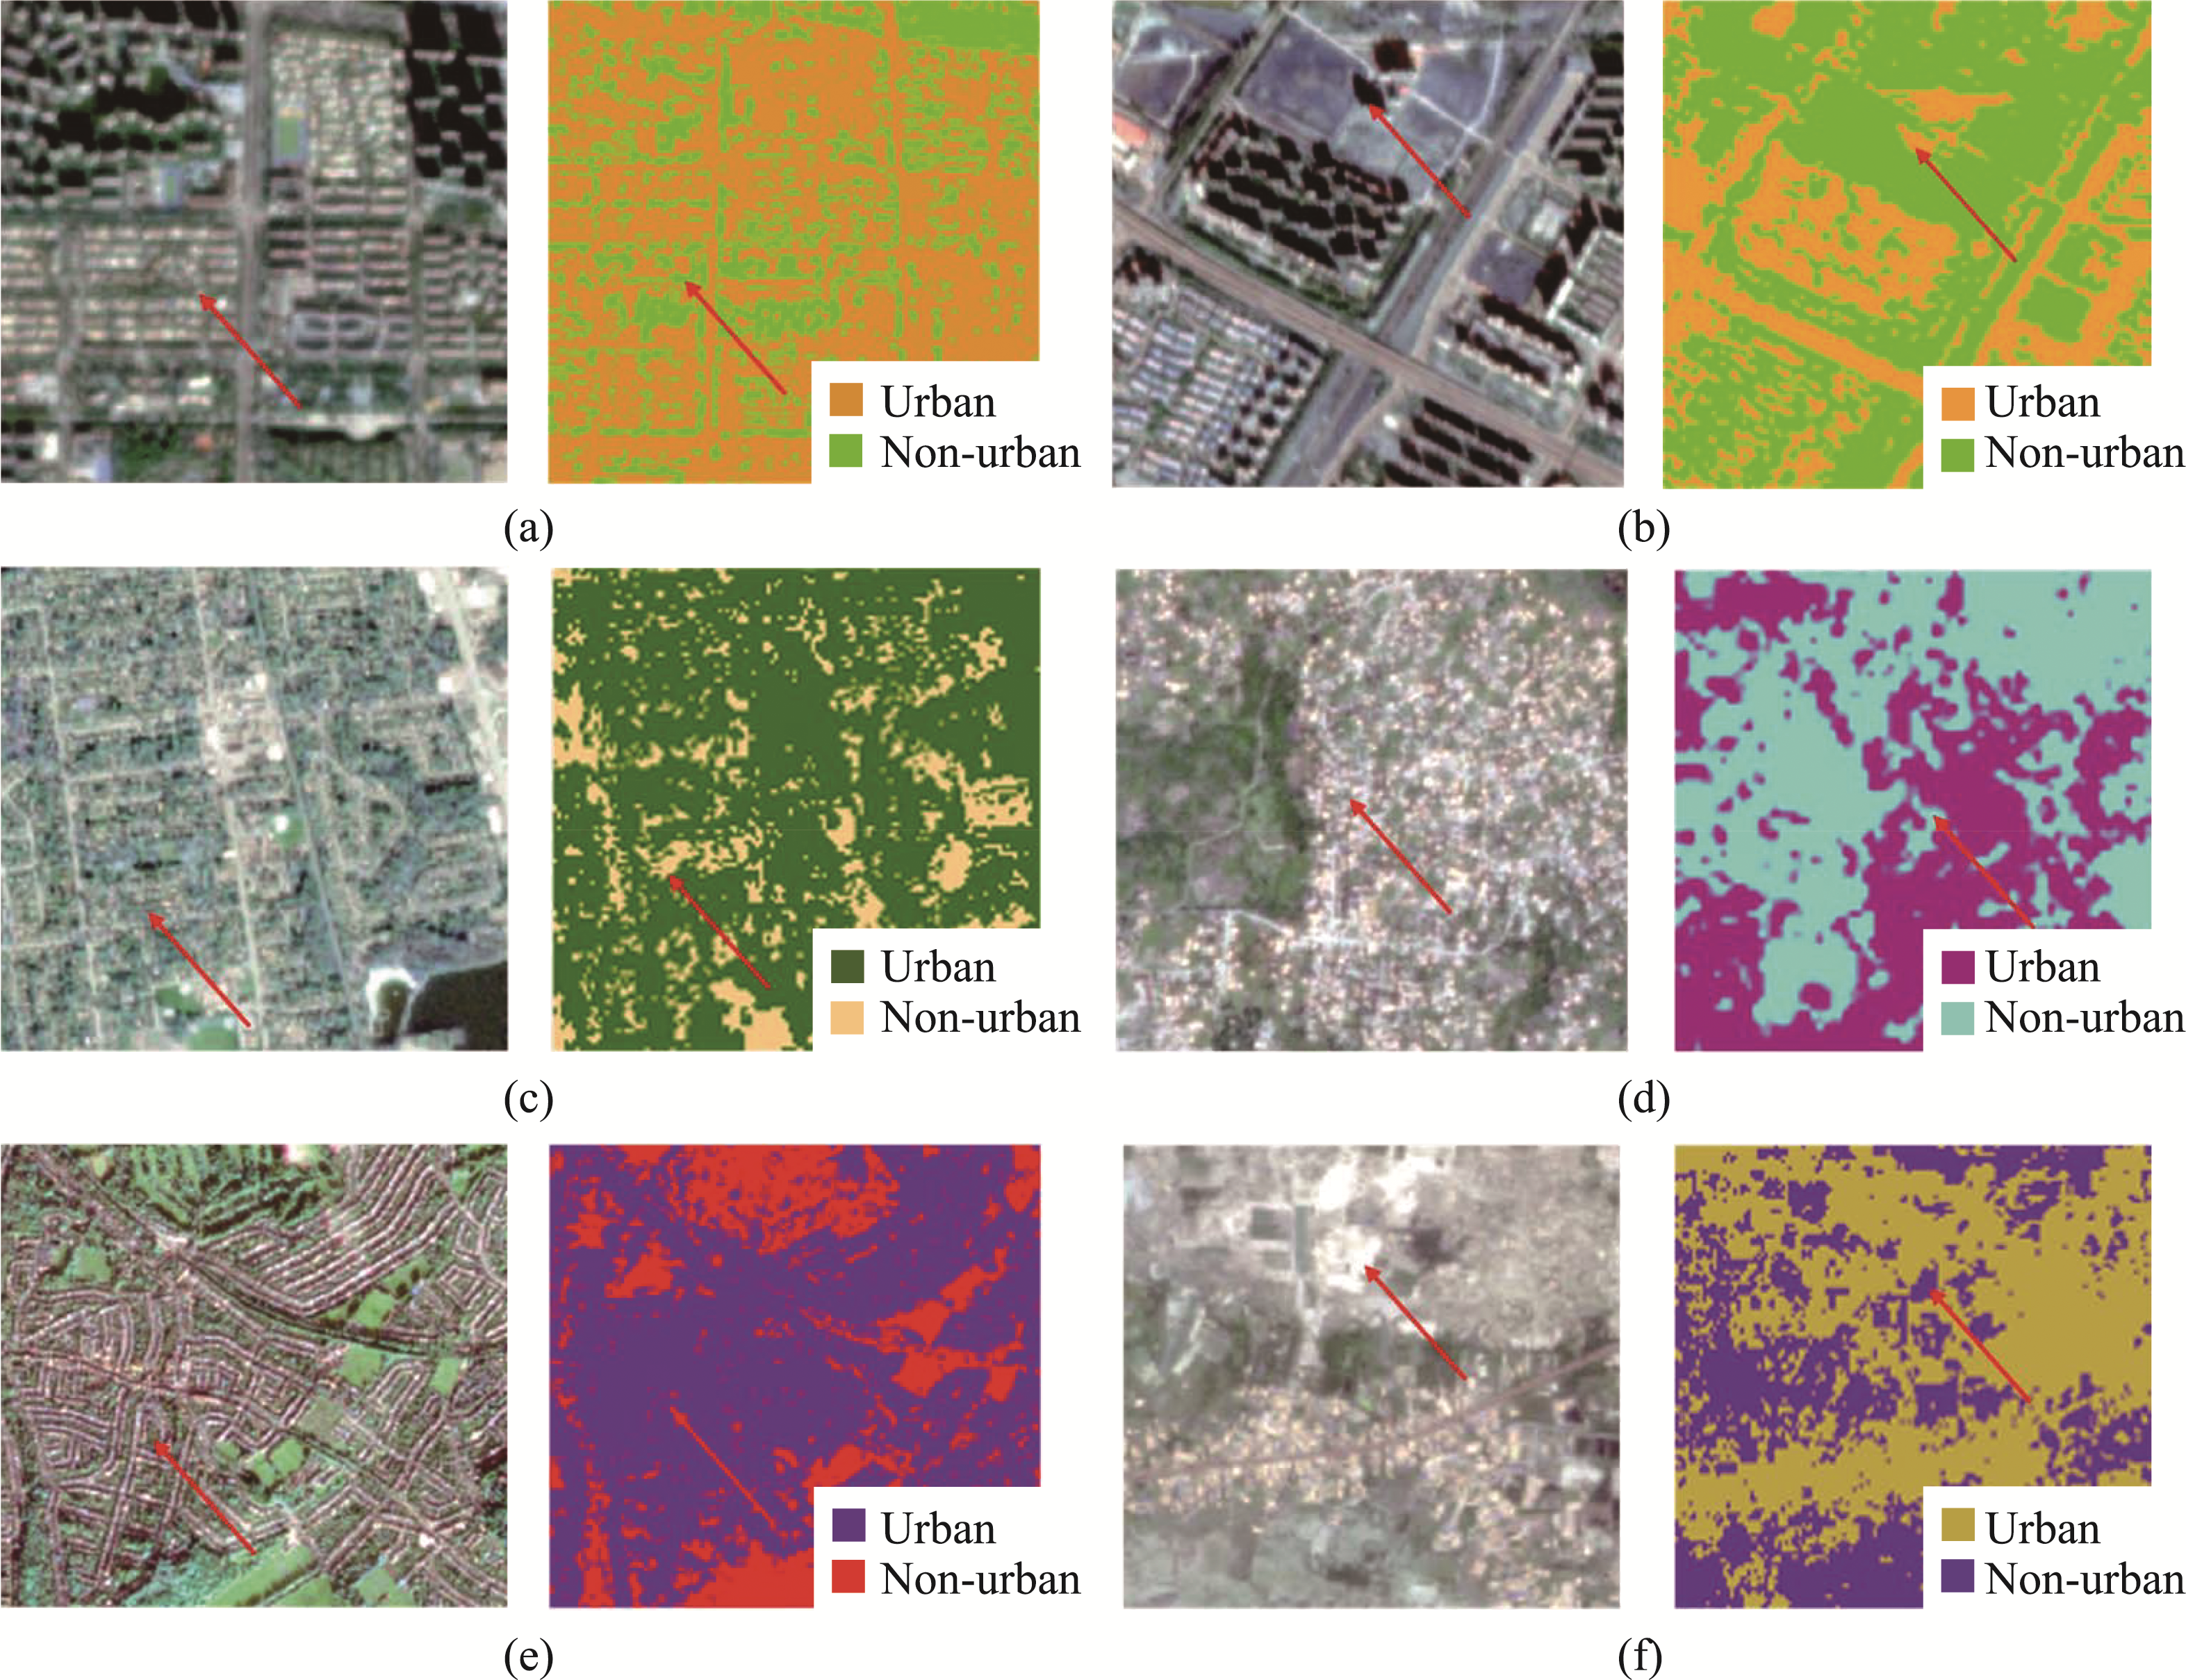
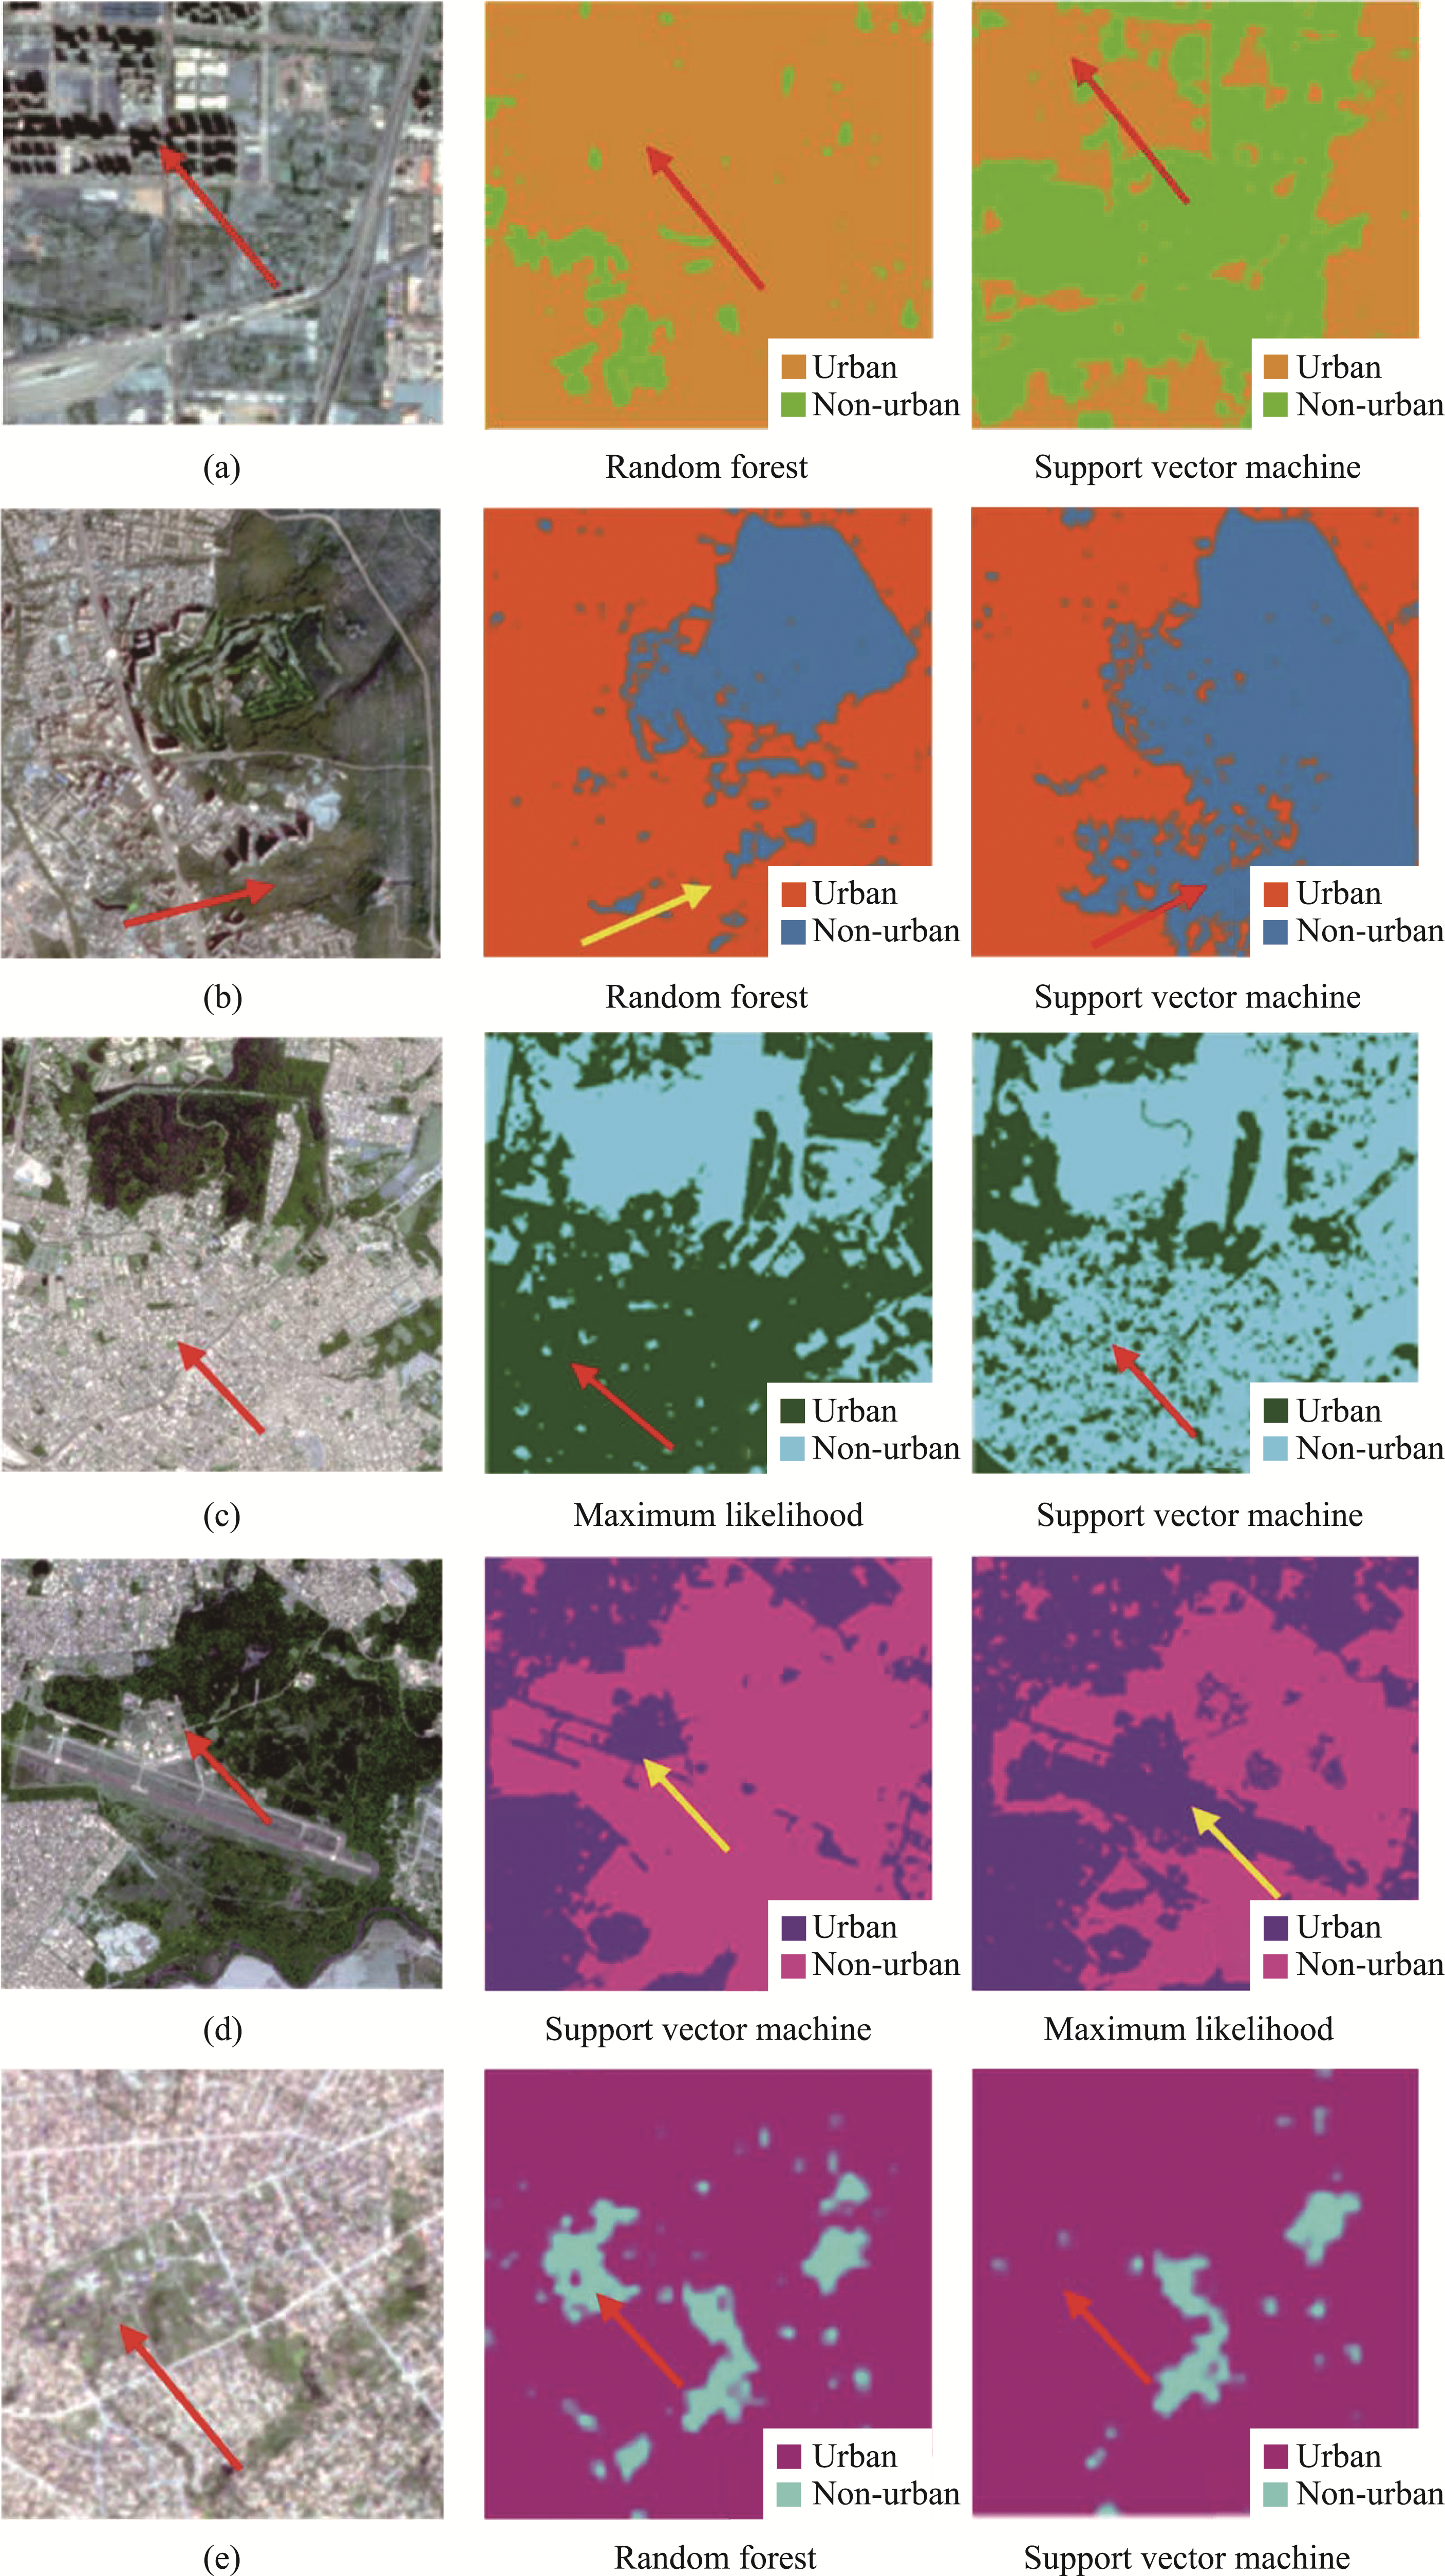
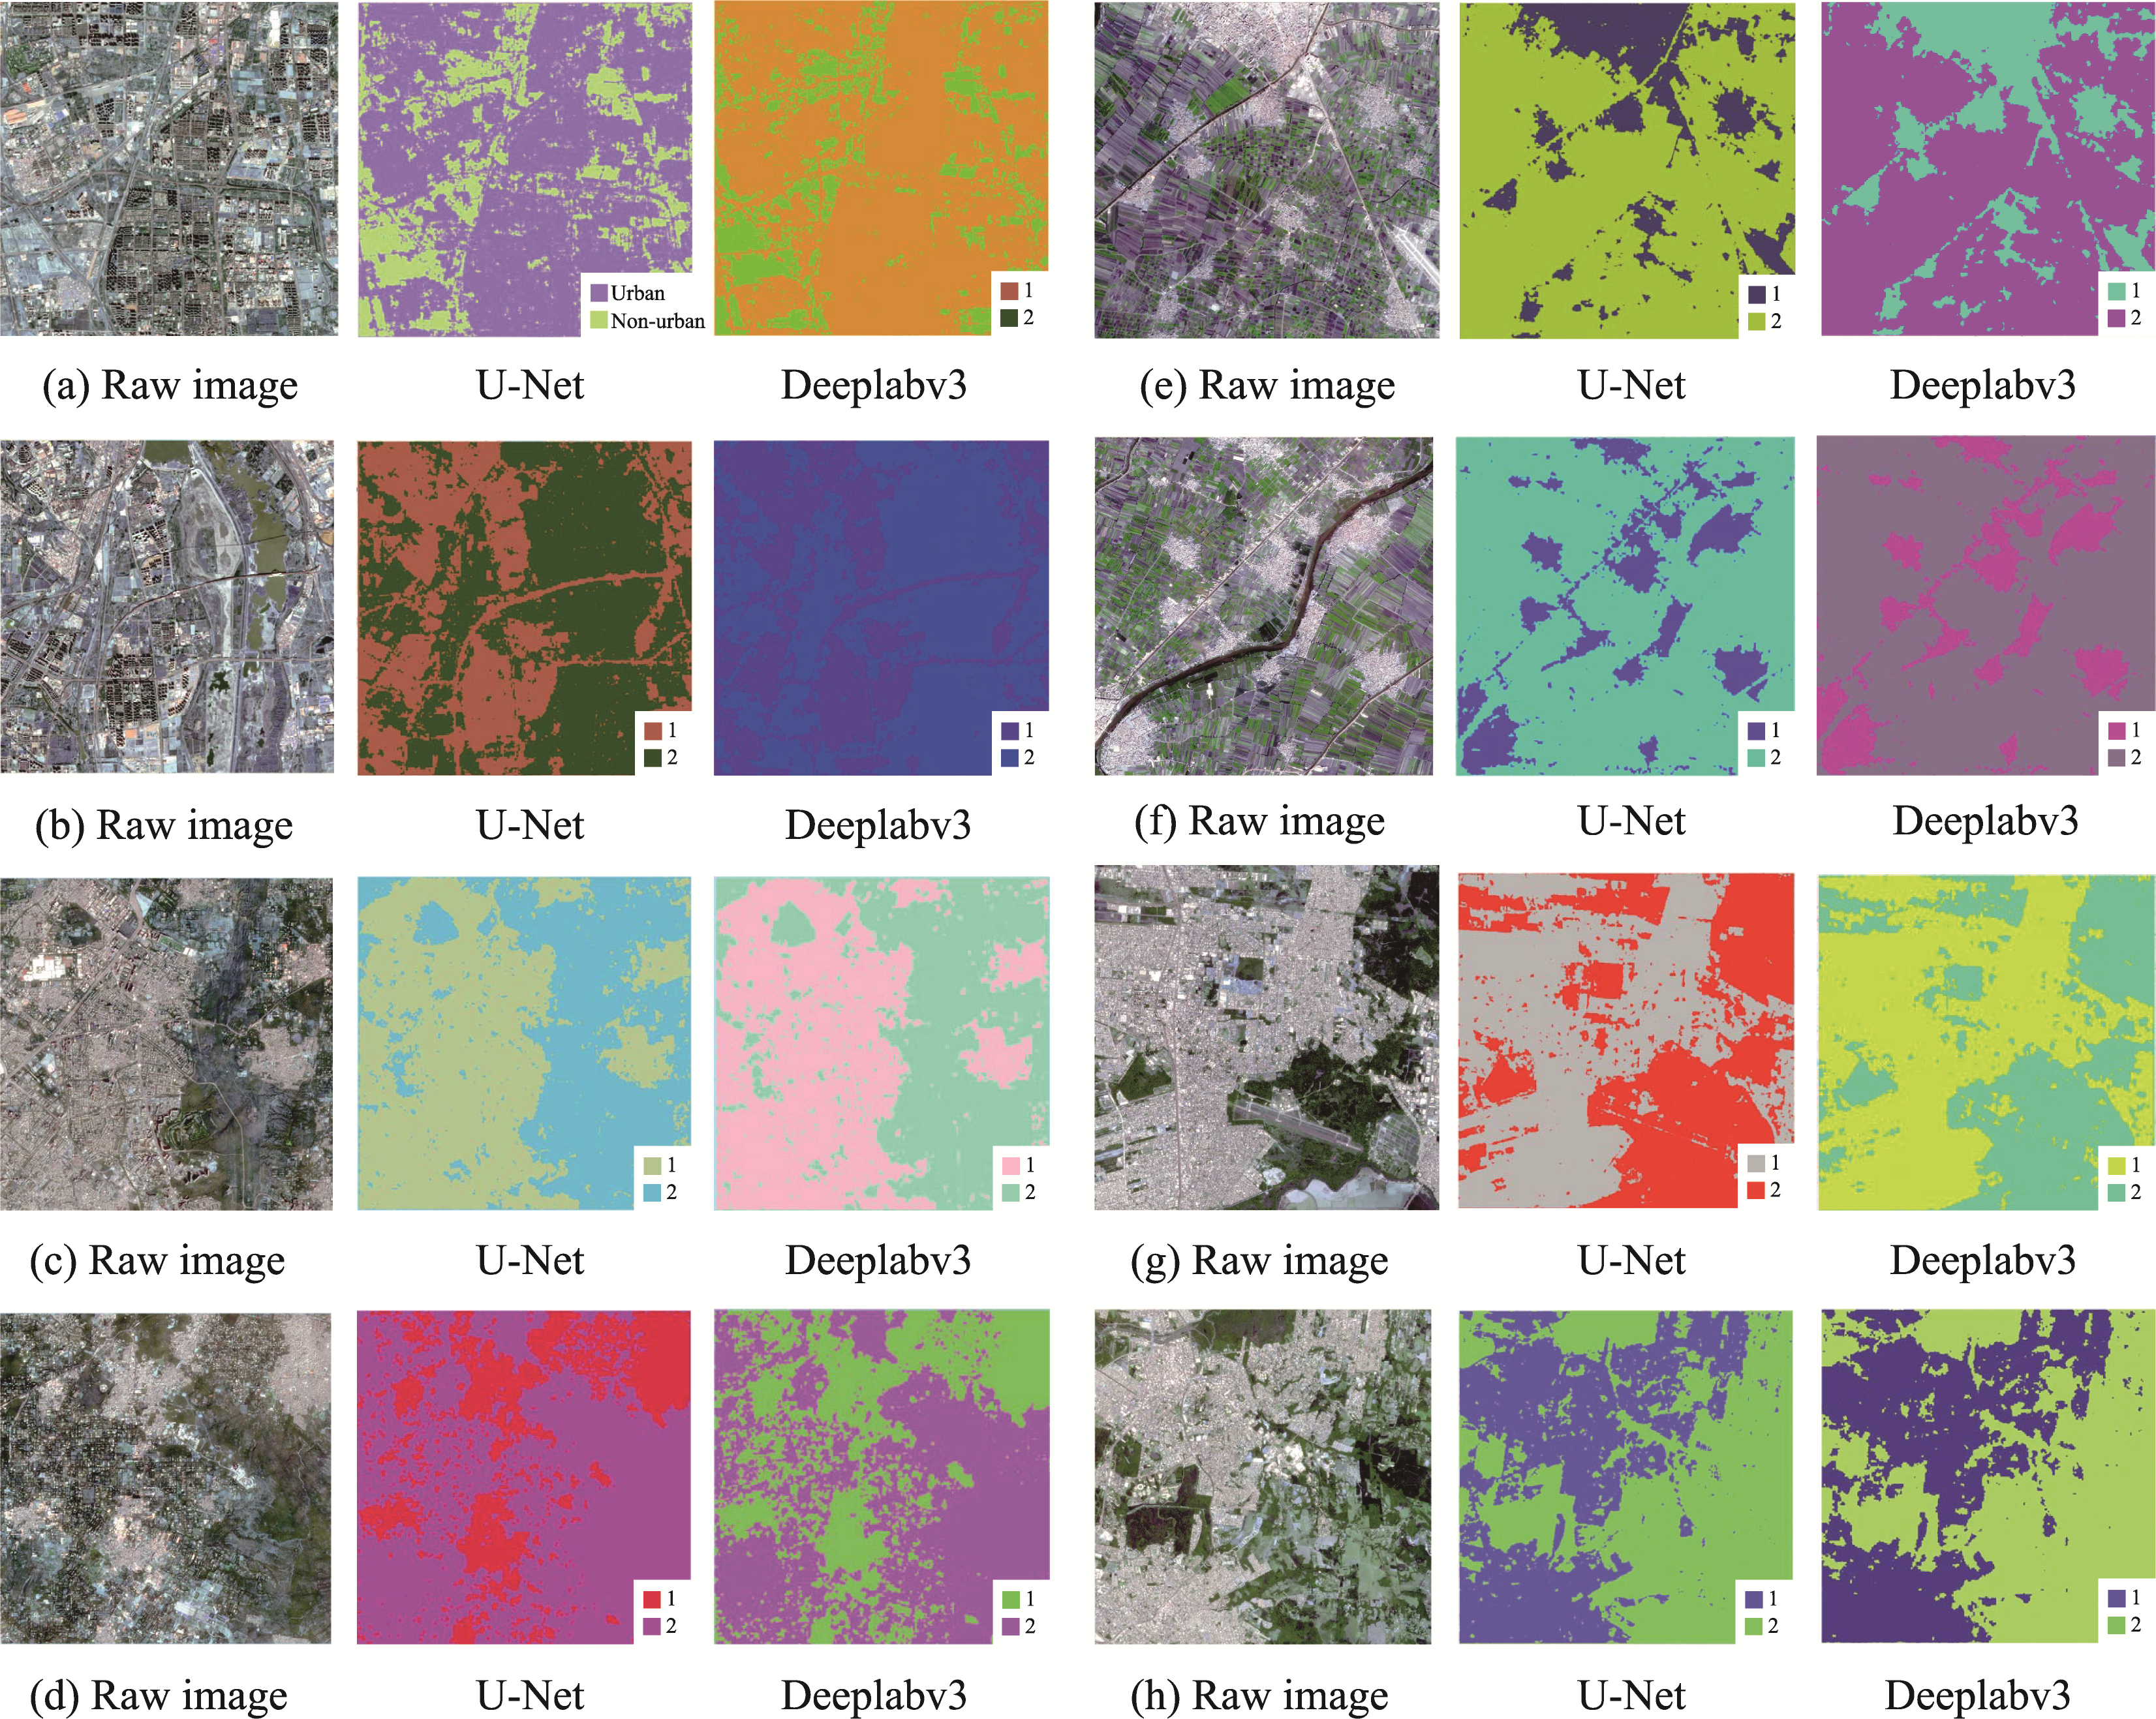
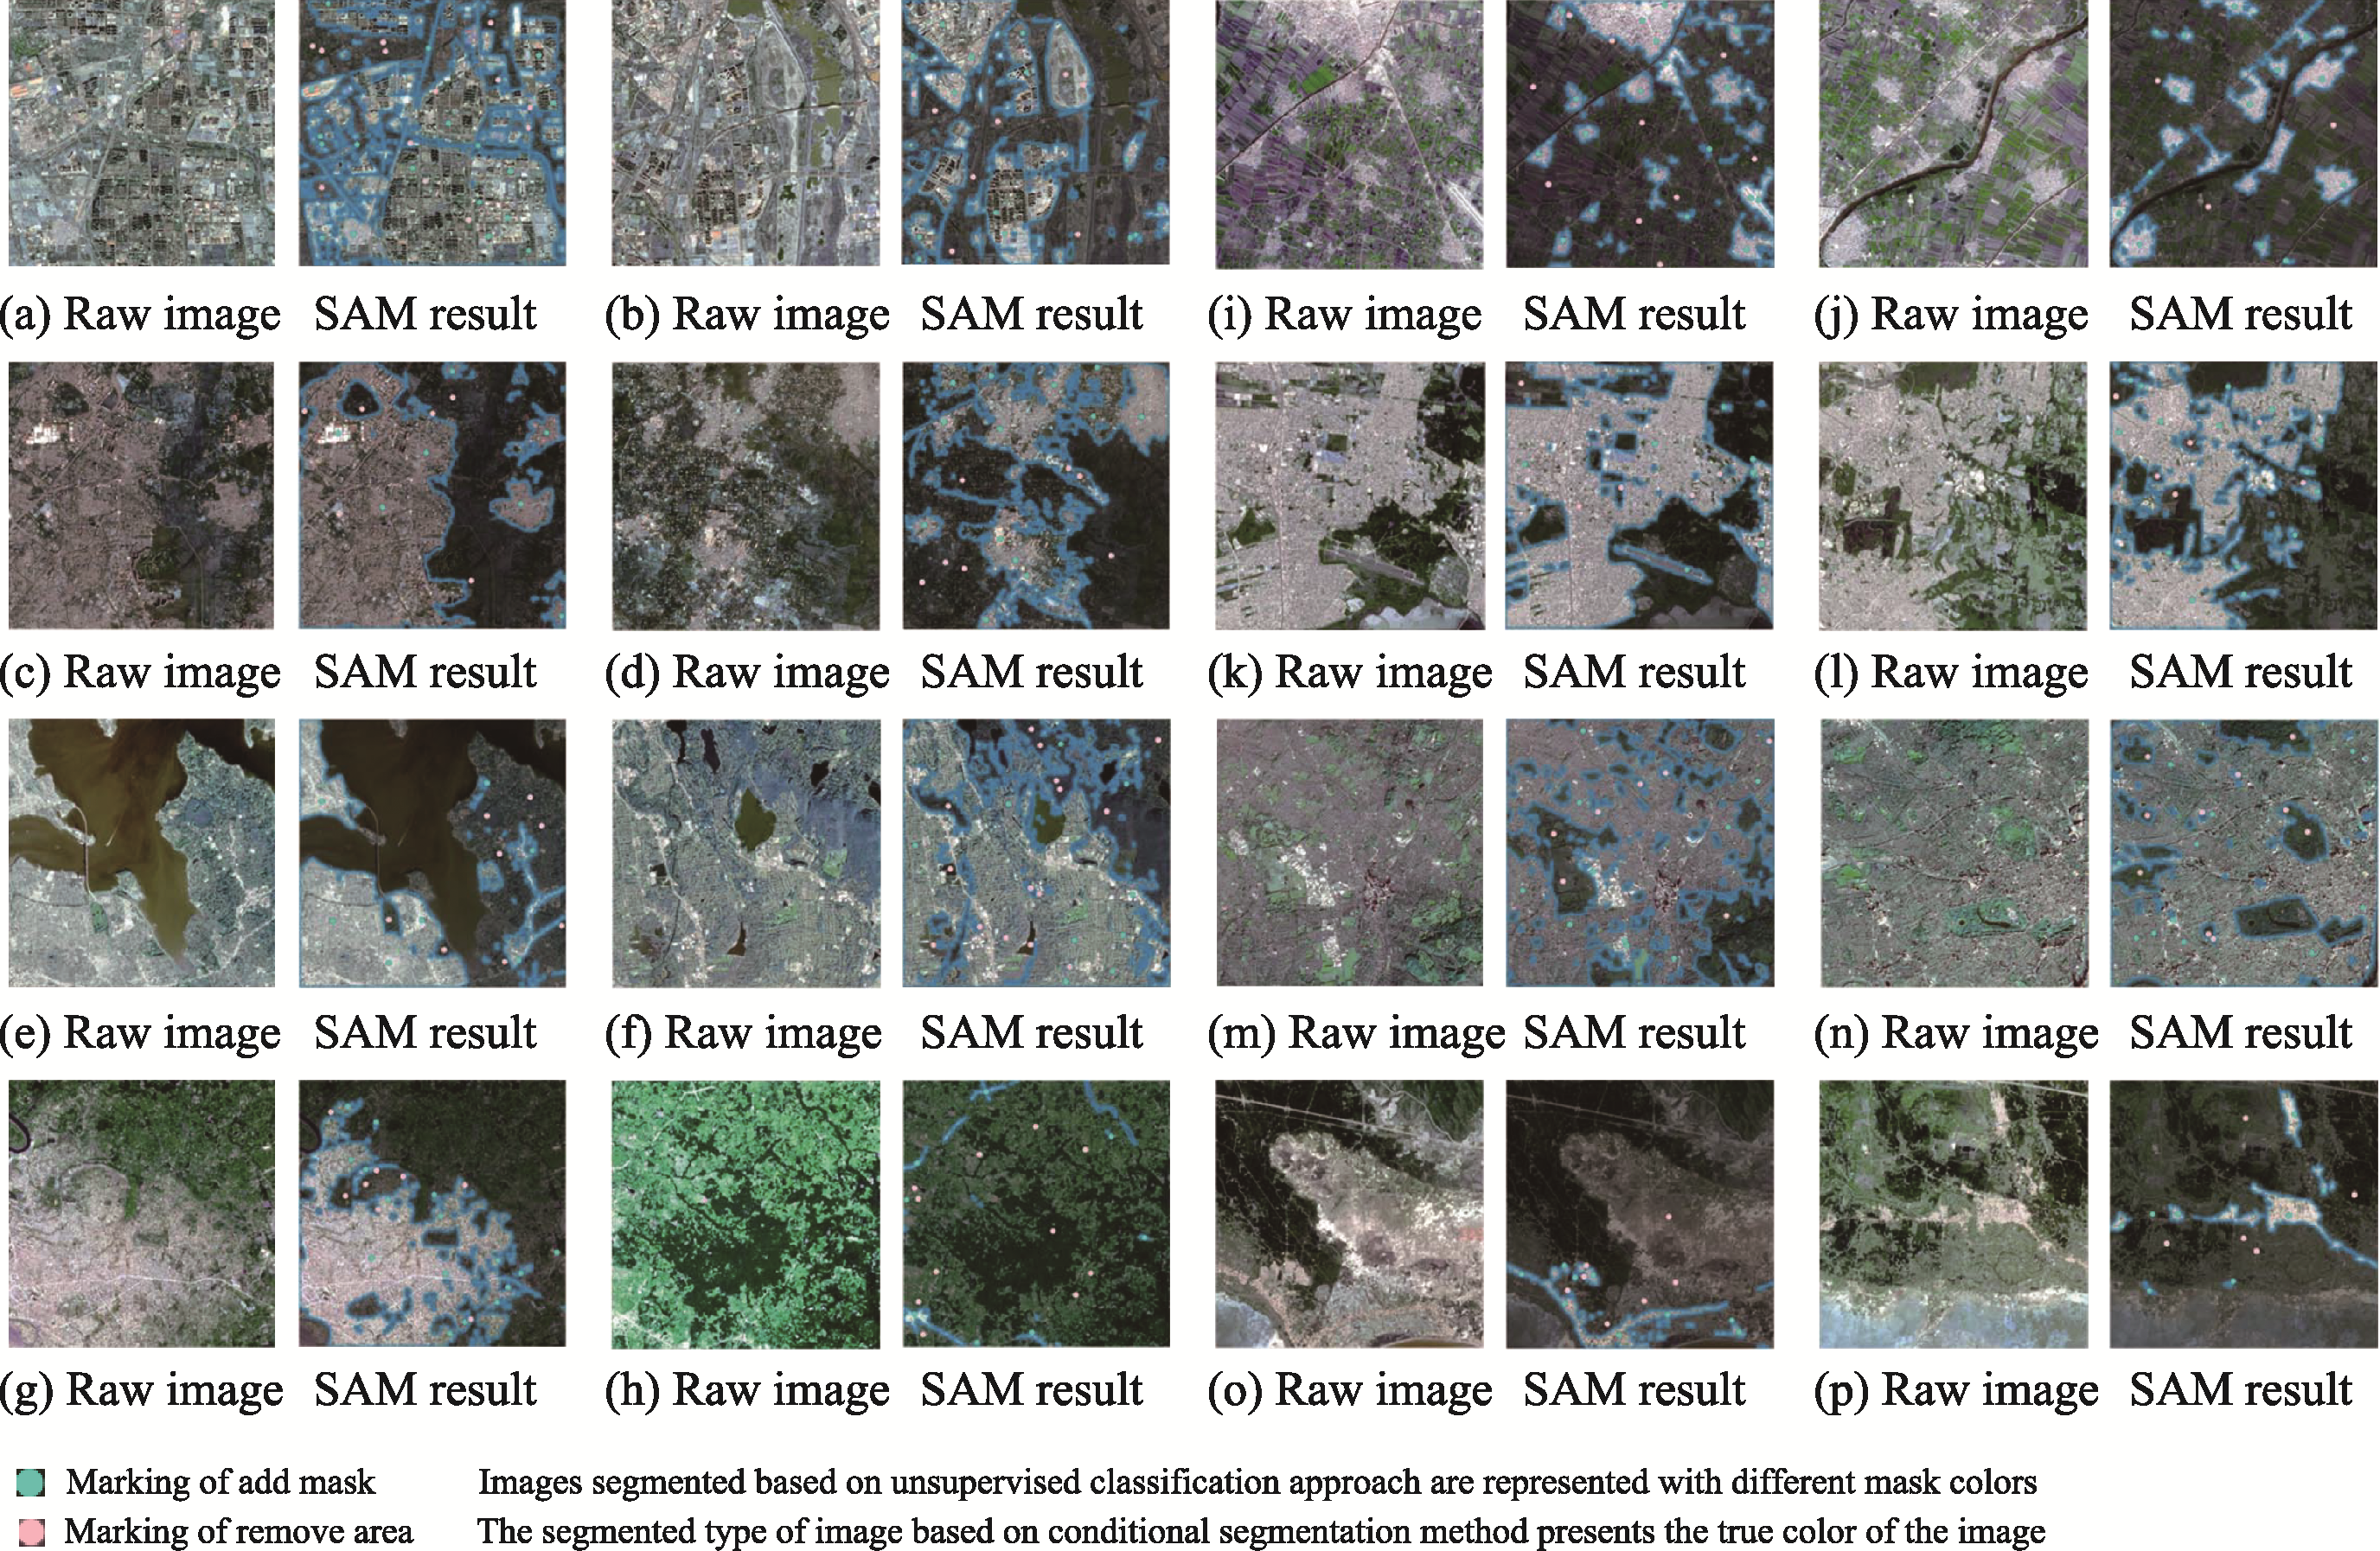
Figure 4 Illustration of an example of sample selection for UF extraction (a-j represent the layout of different cities and the selection of samples. a and b correspond to Beijing, c to New Delhi, d to Mansouria, e to Porto Alegre, f and g to Kisangani, h and i to London, and j to New York.)
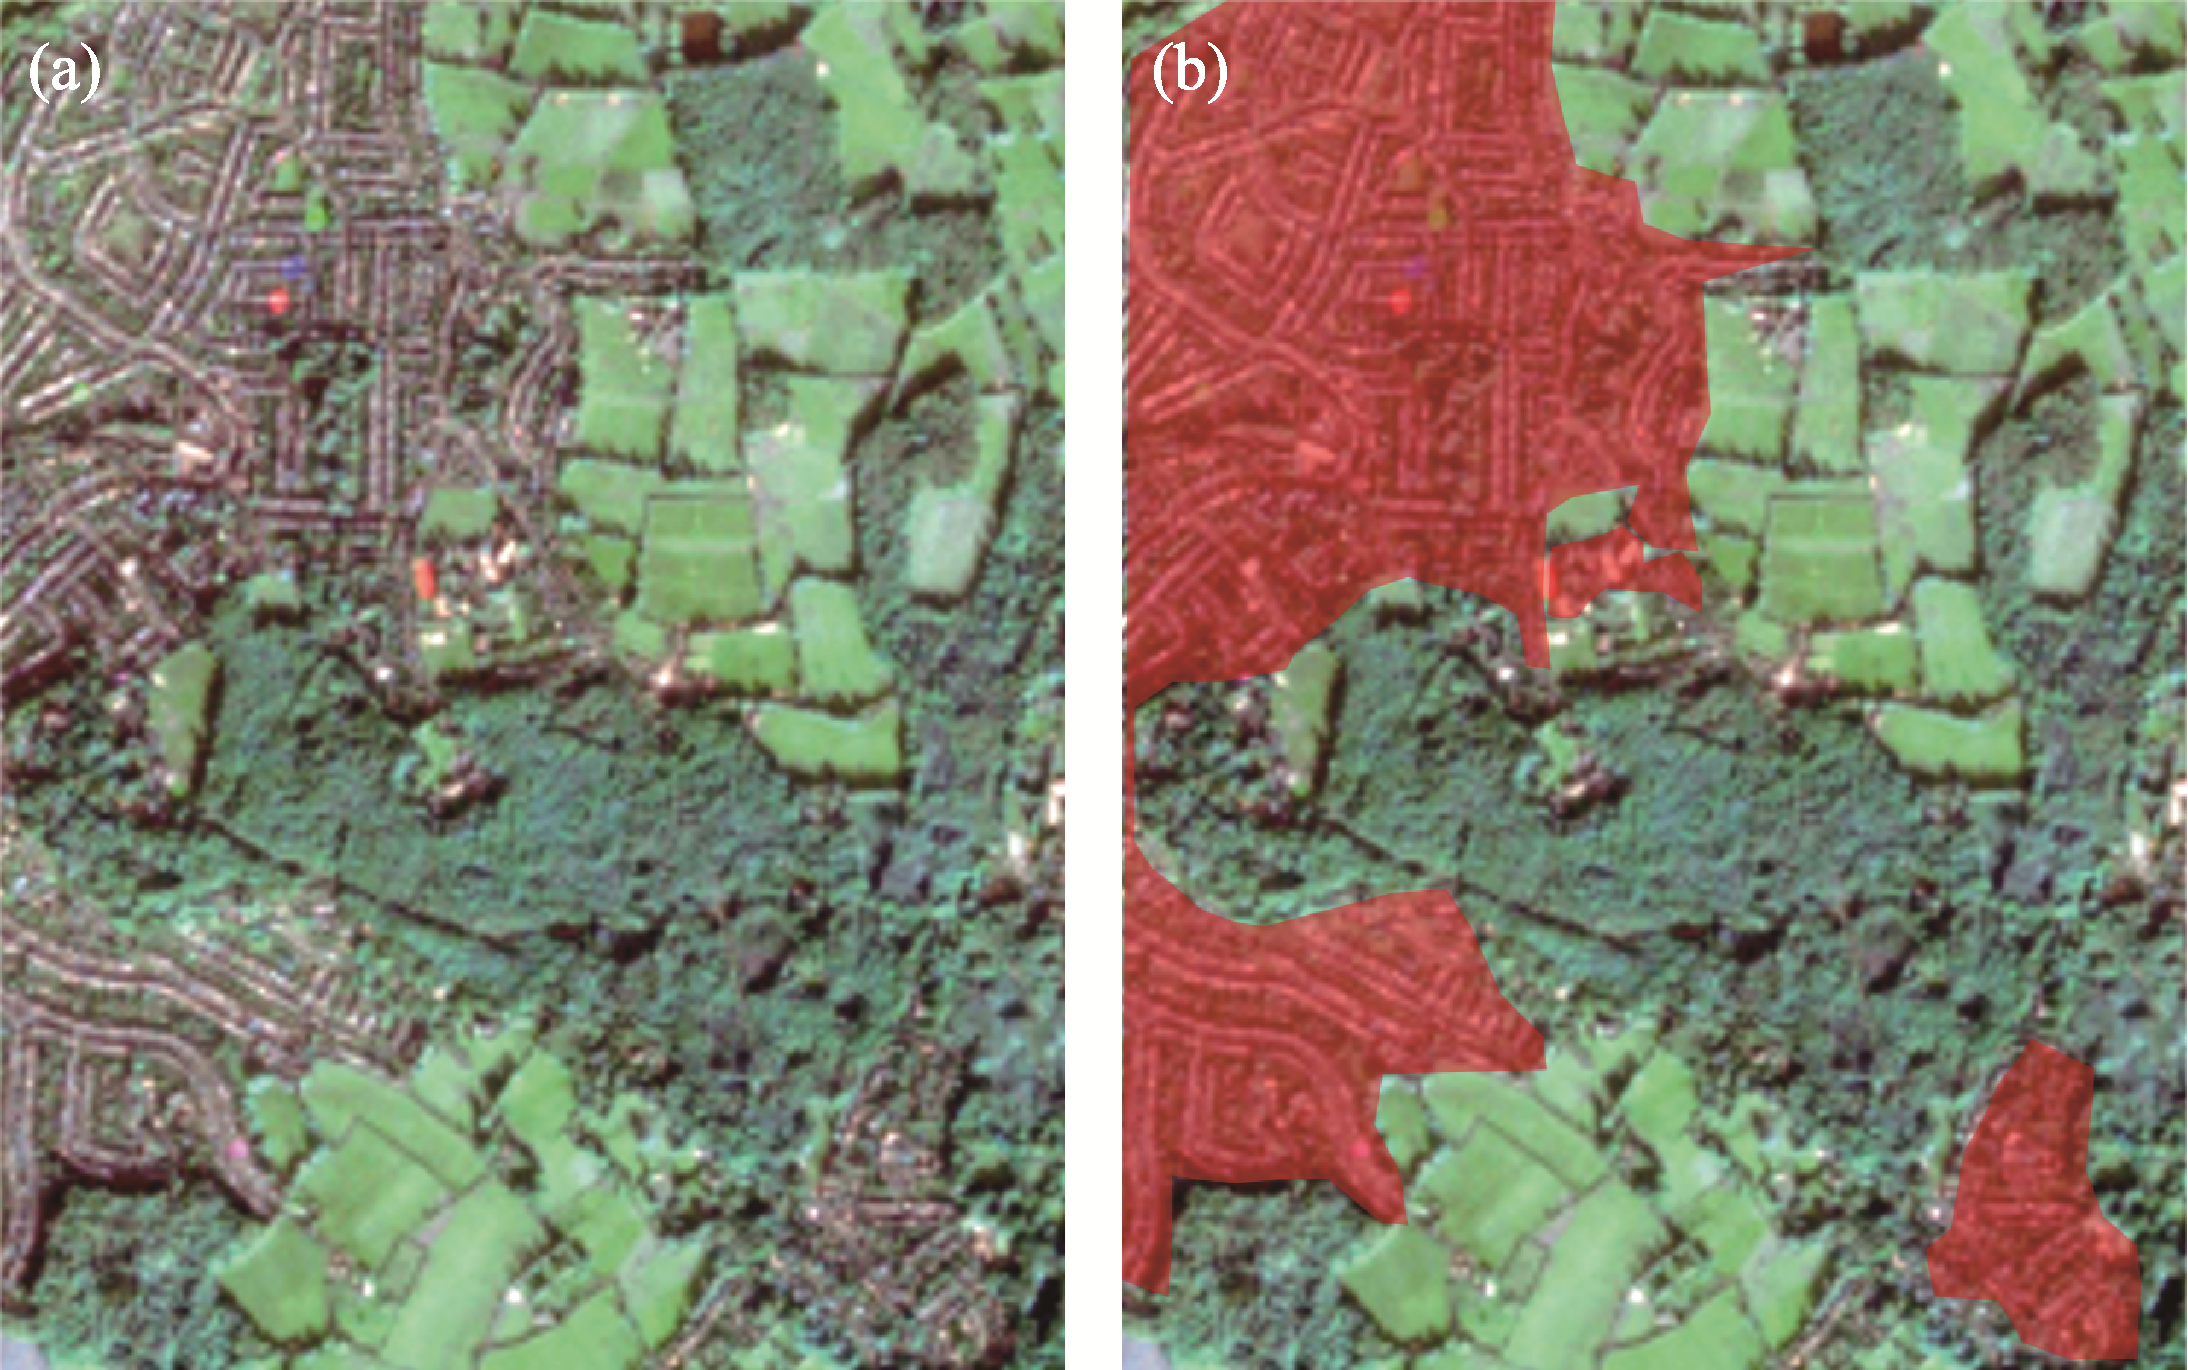
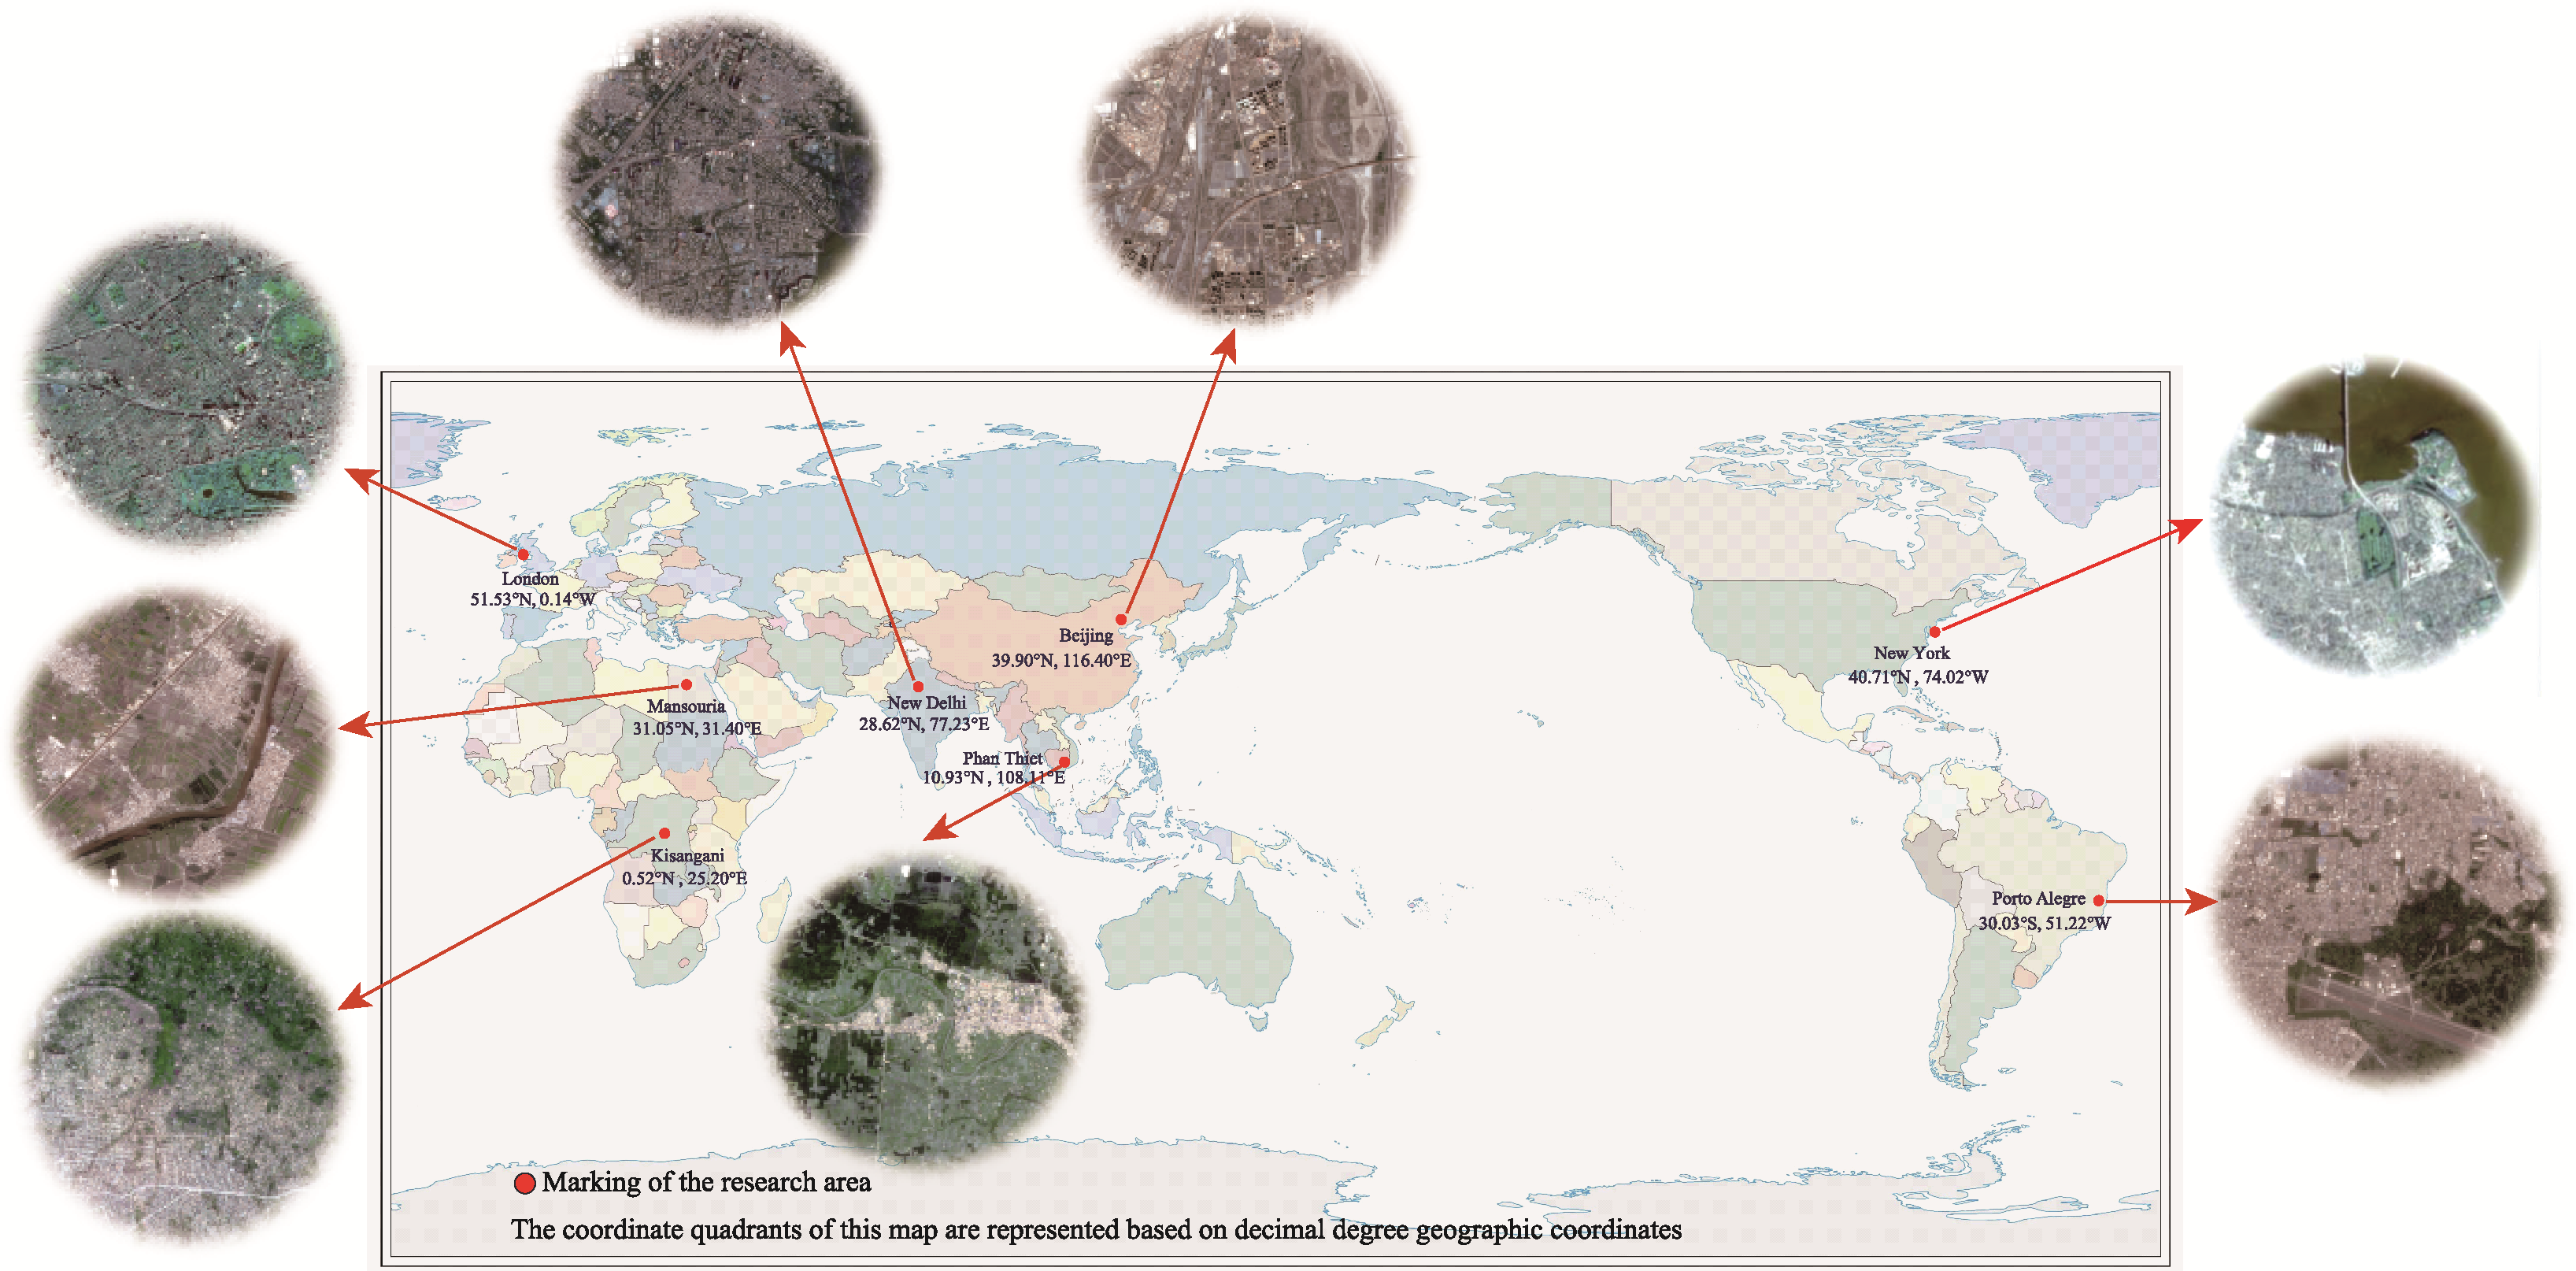
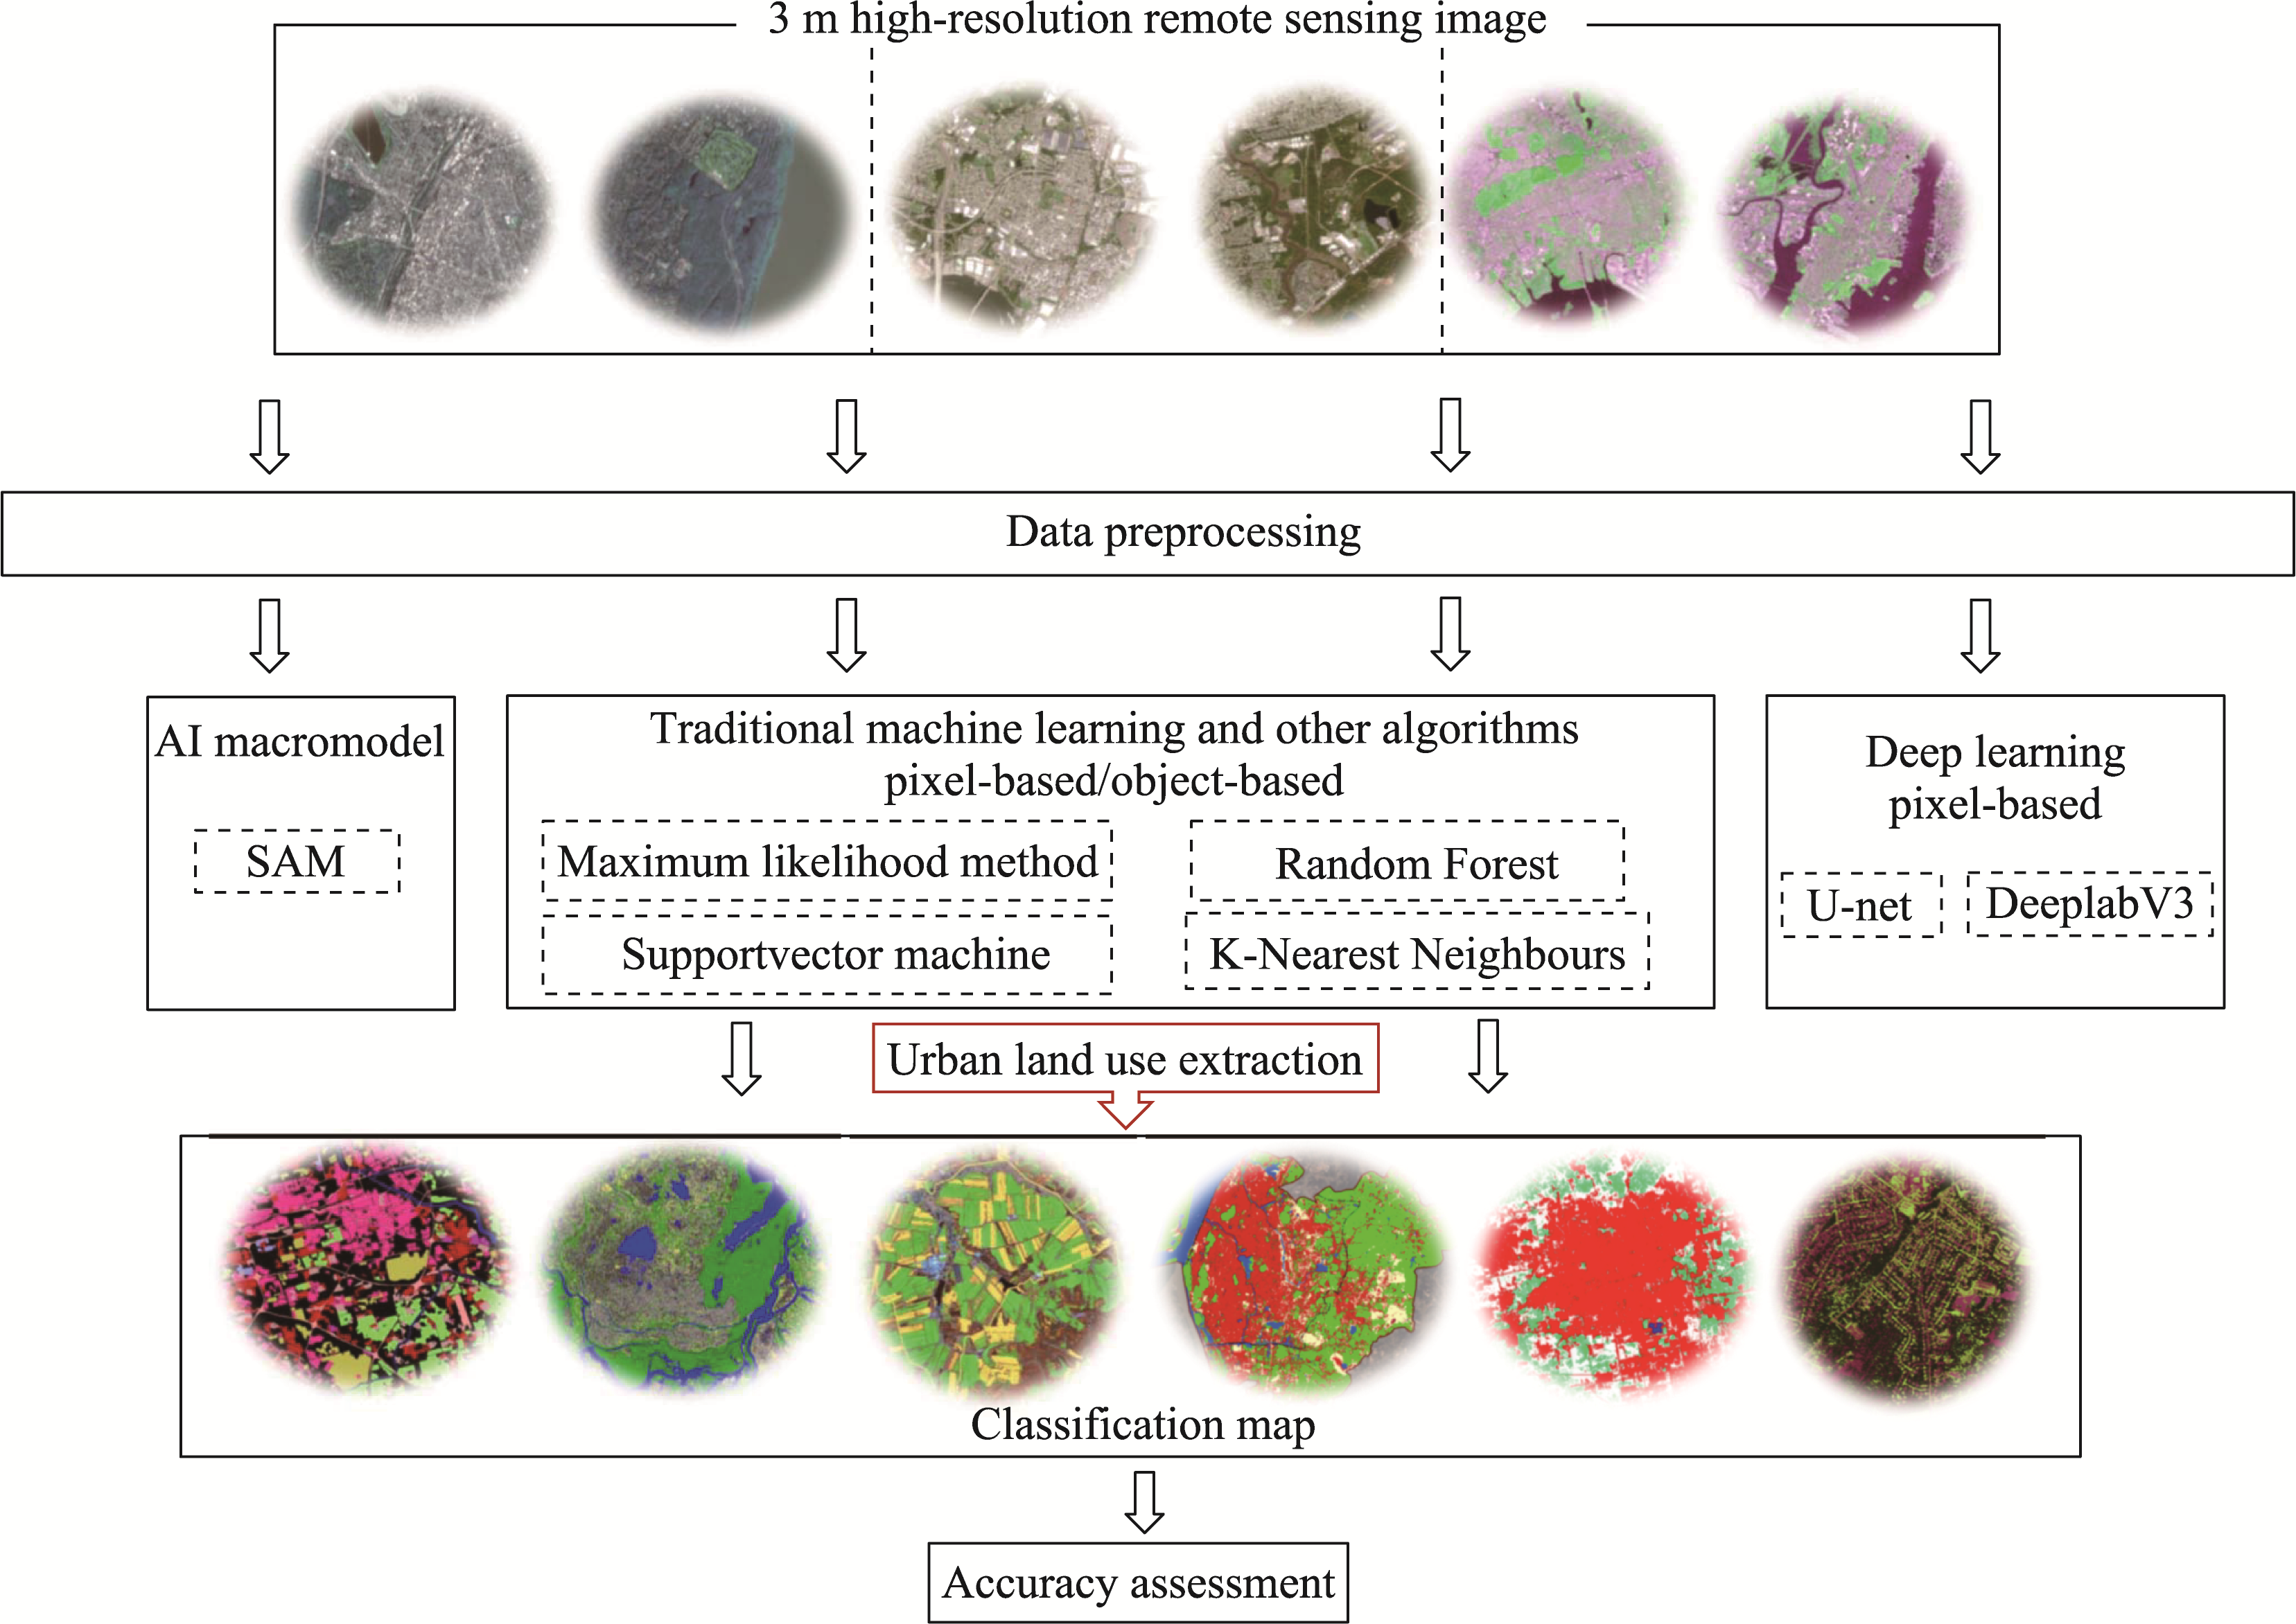
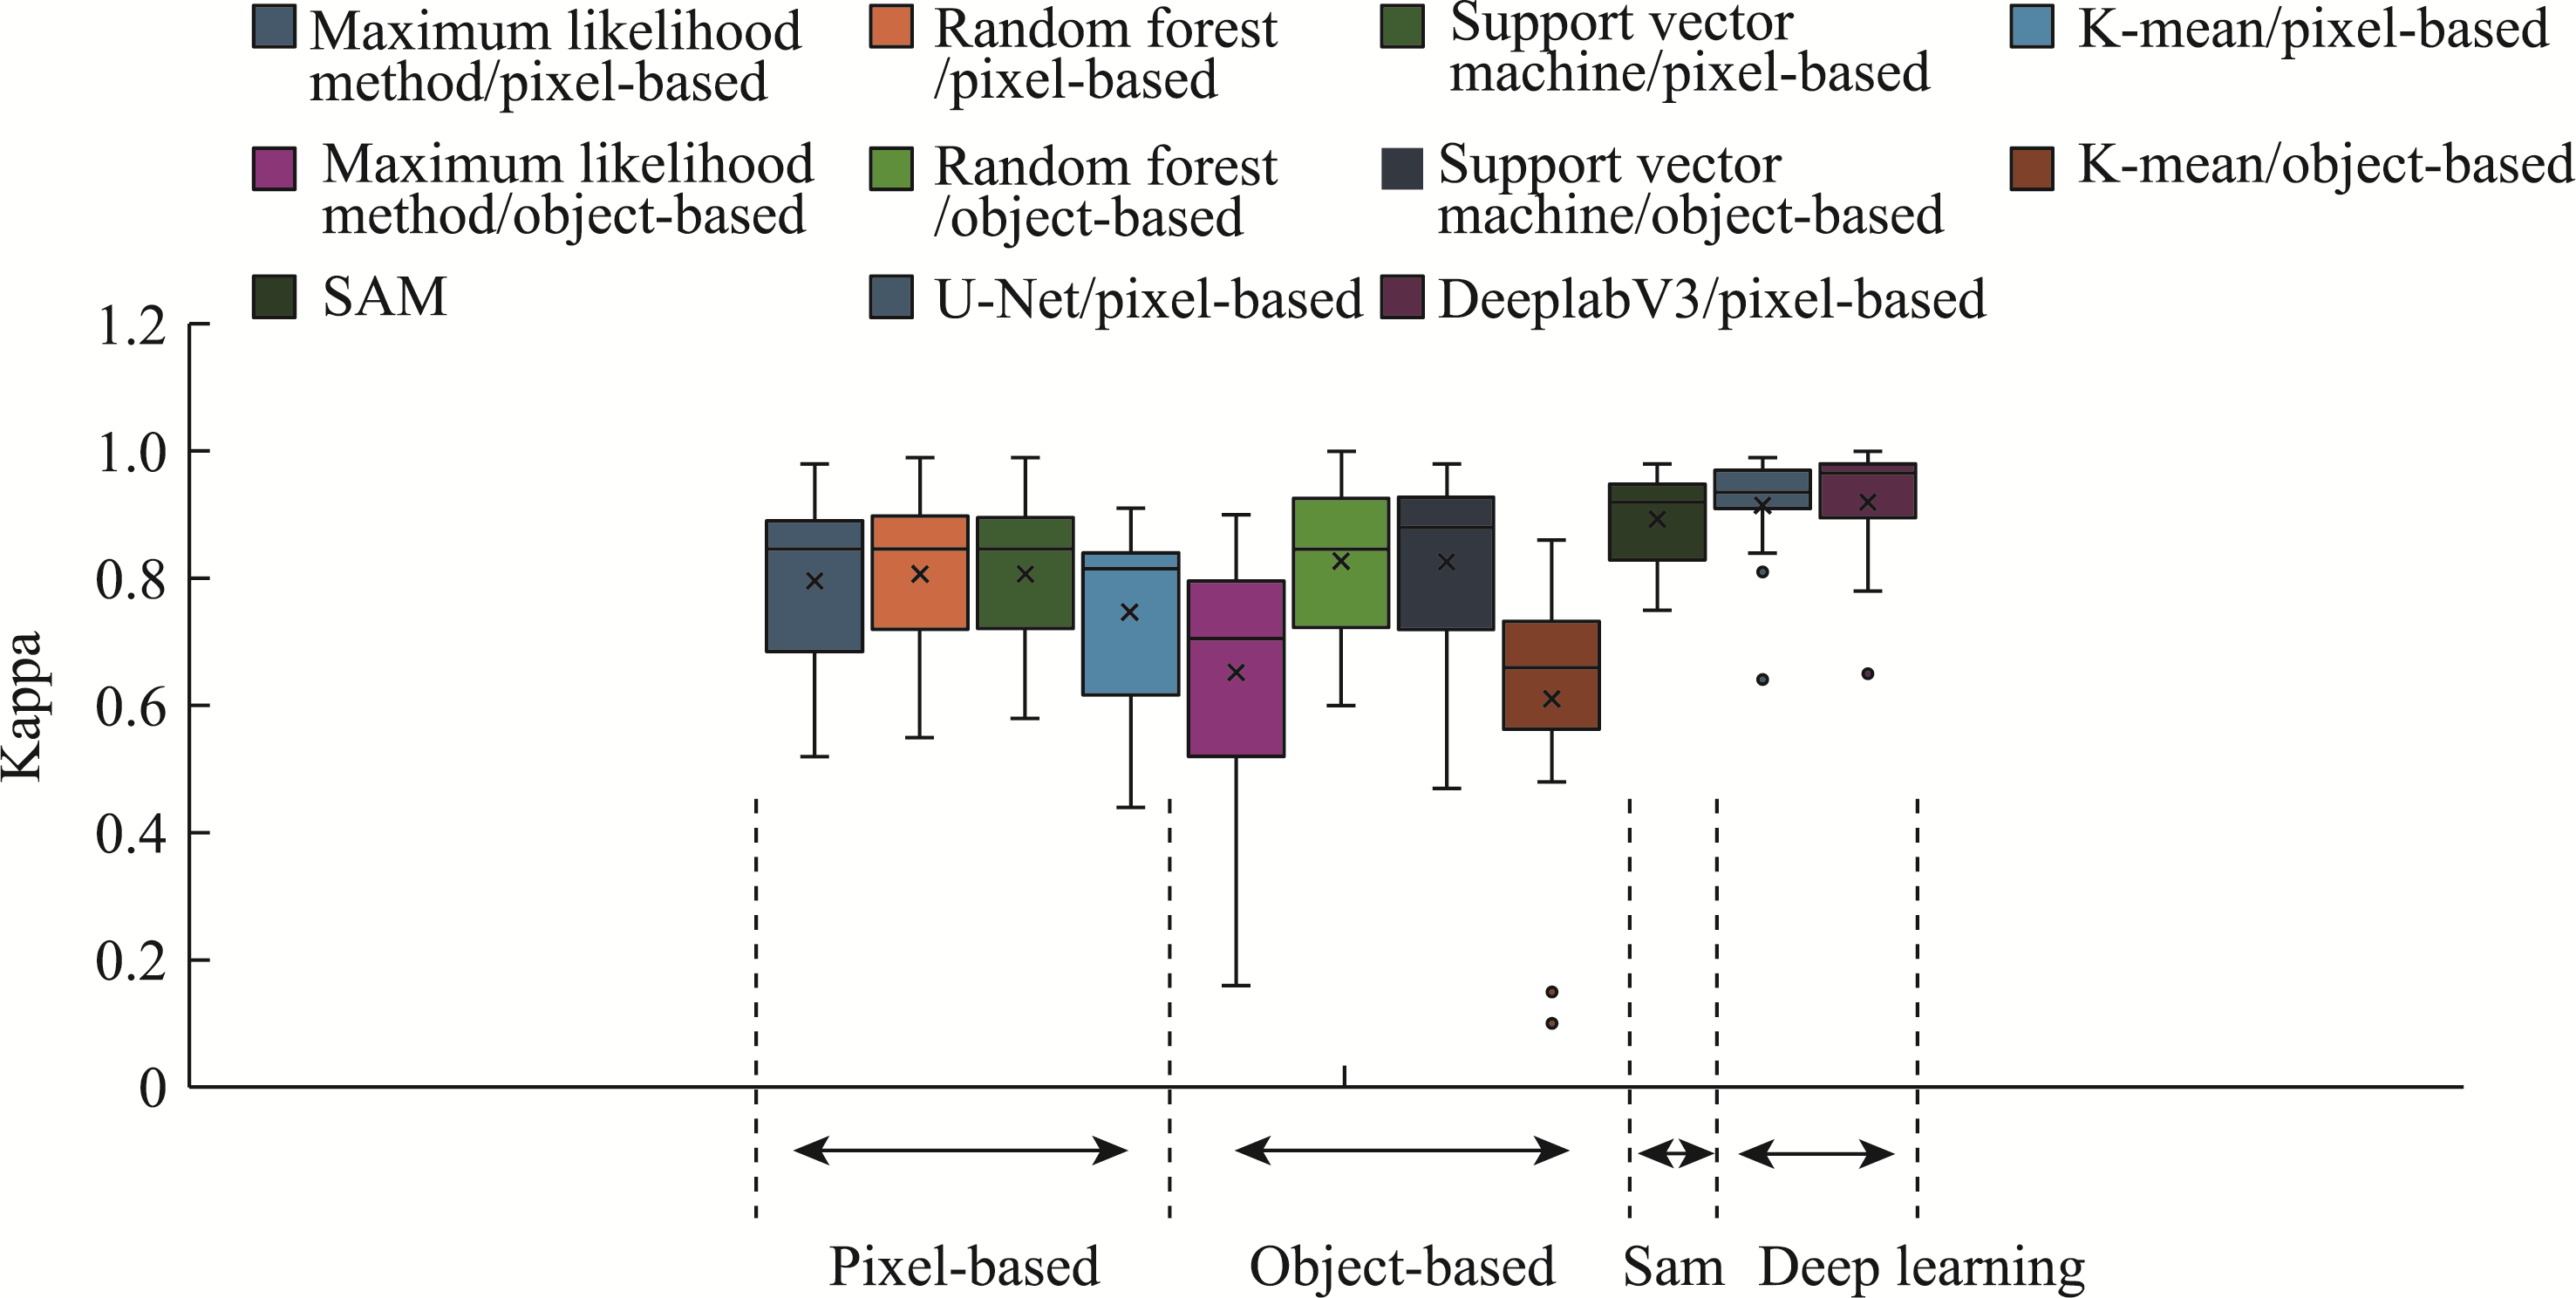
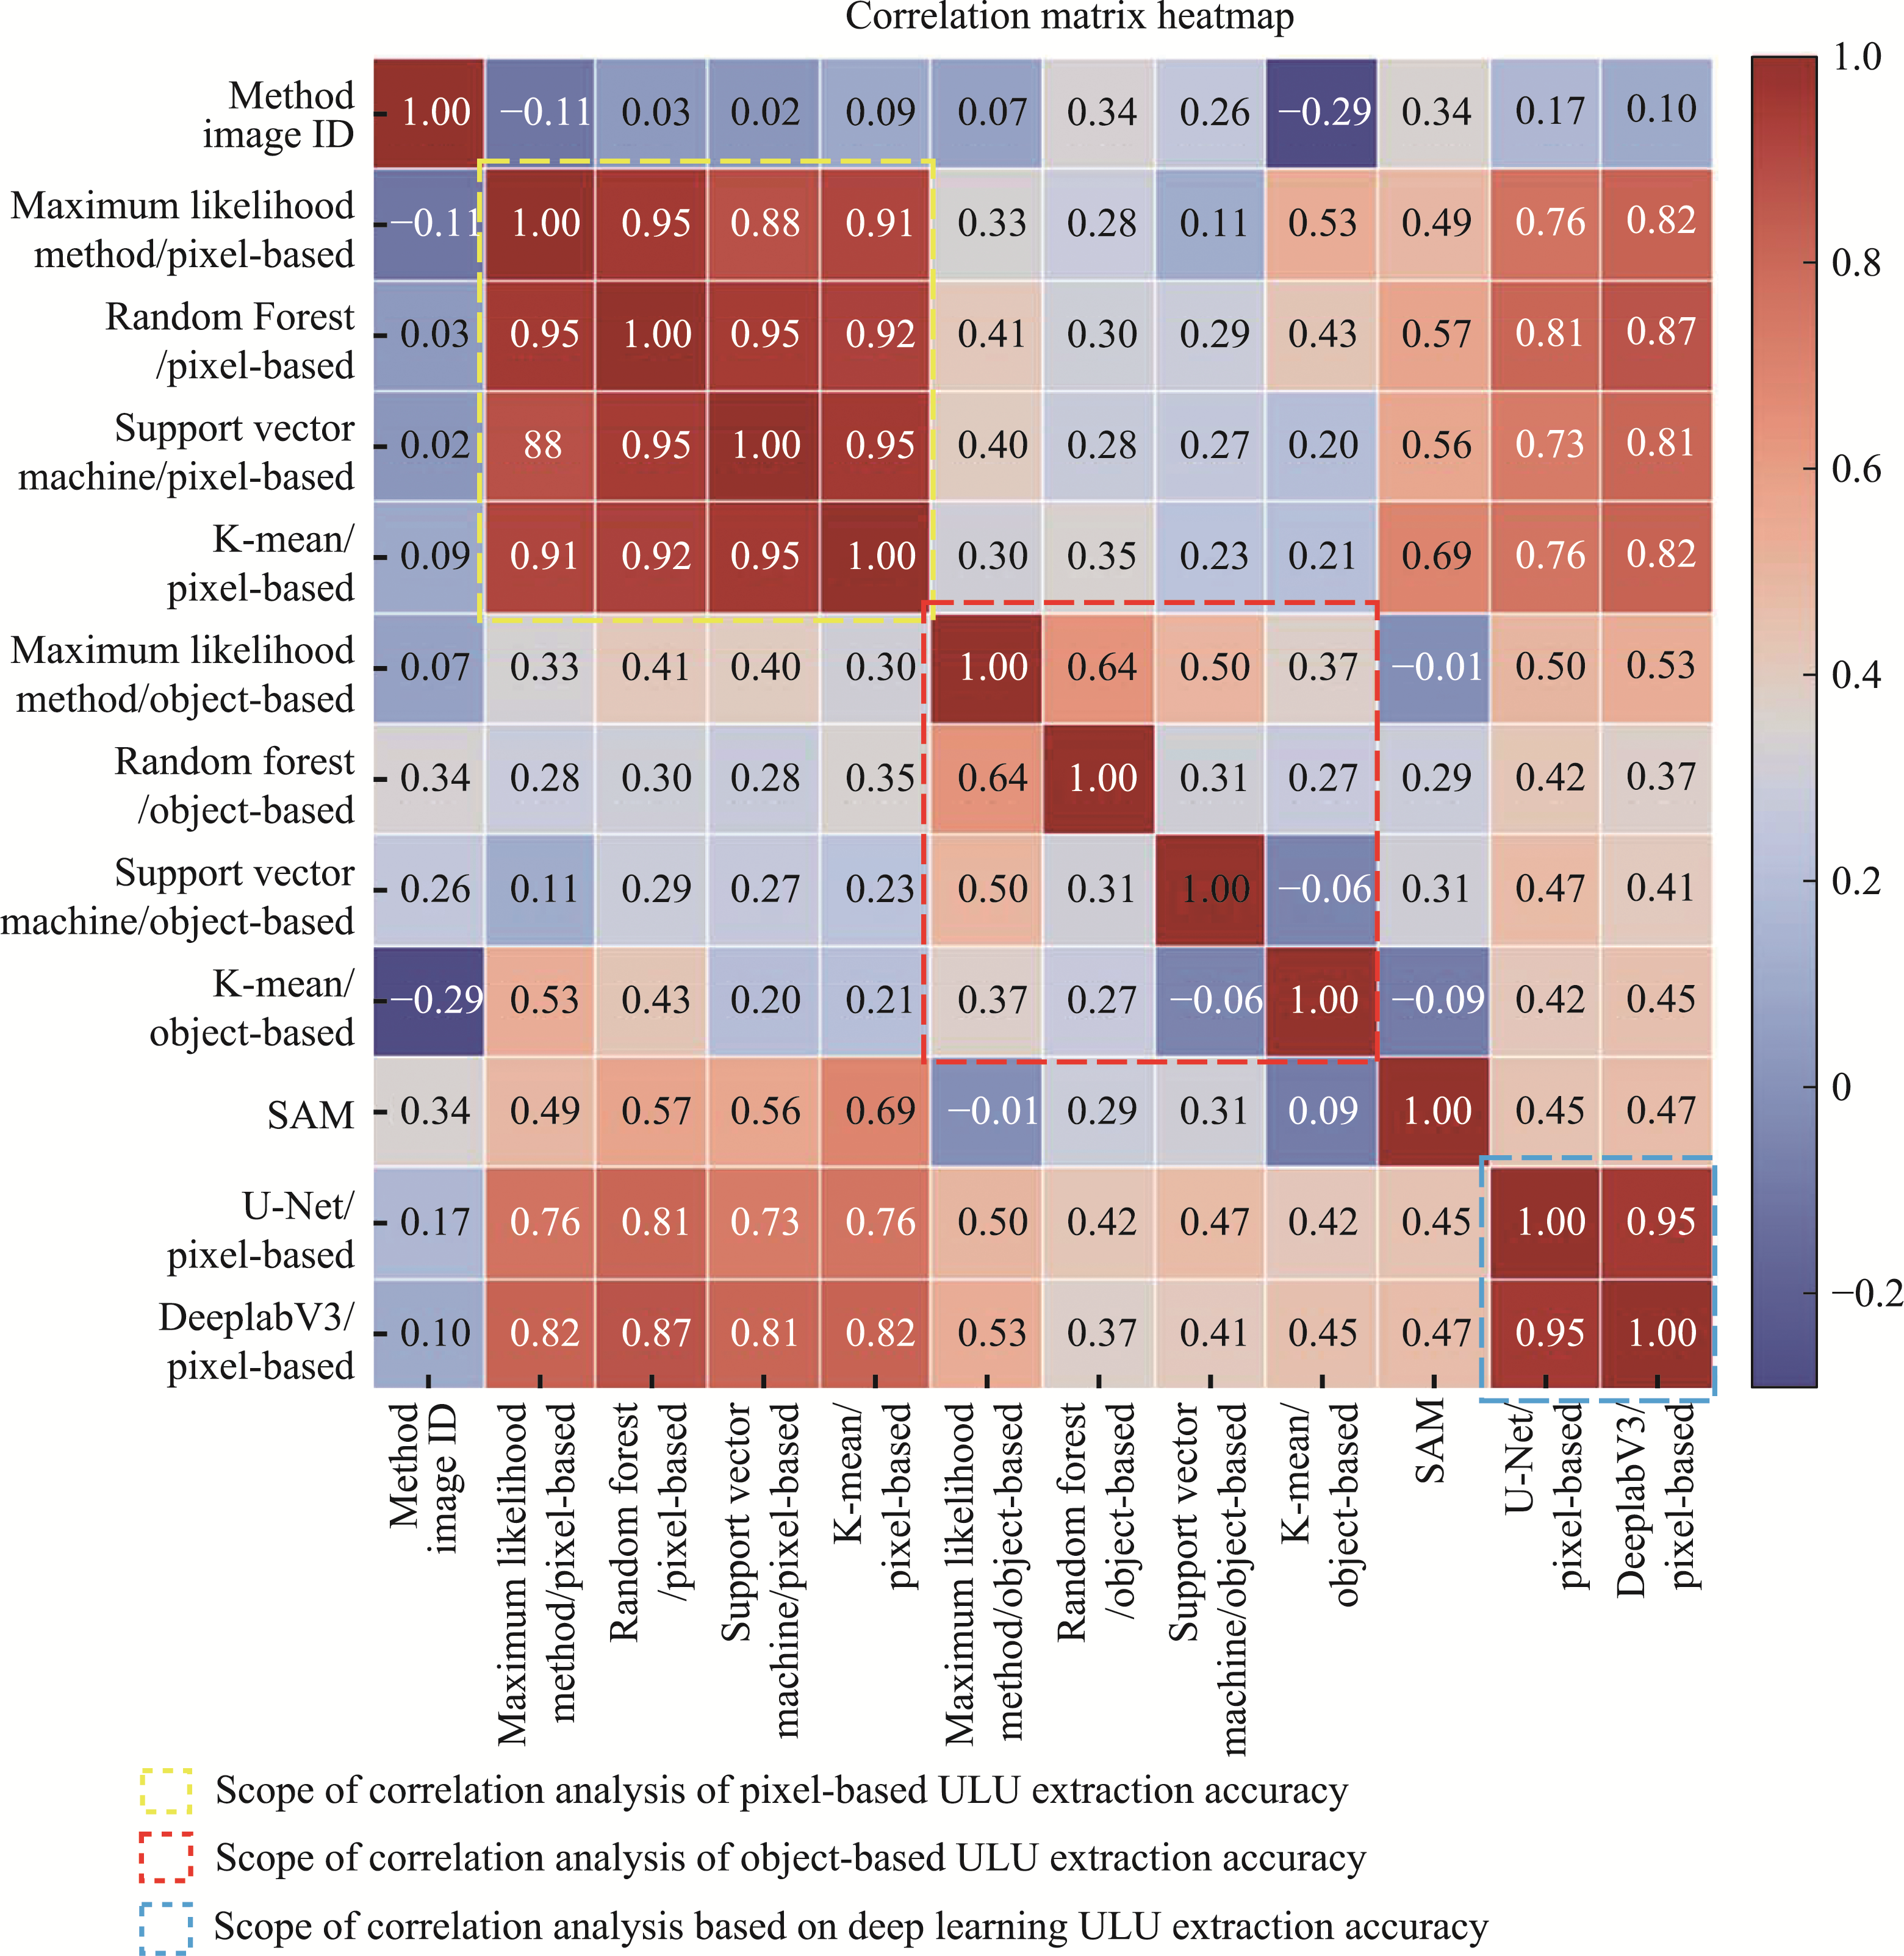
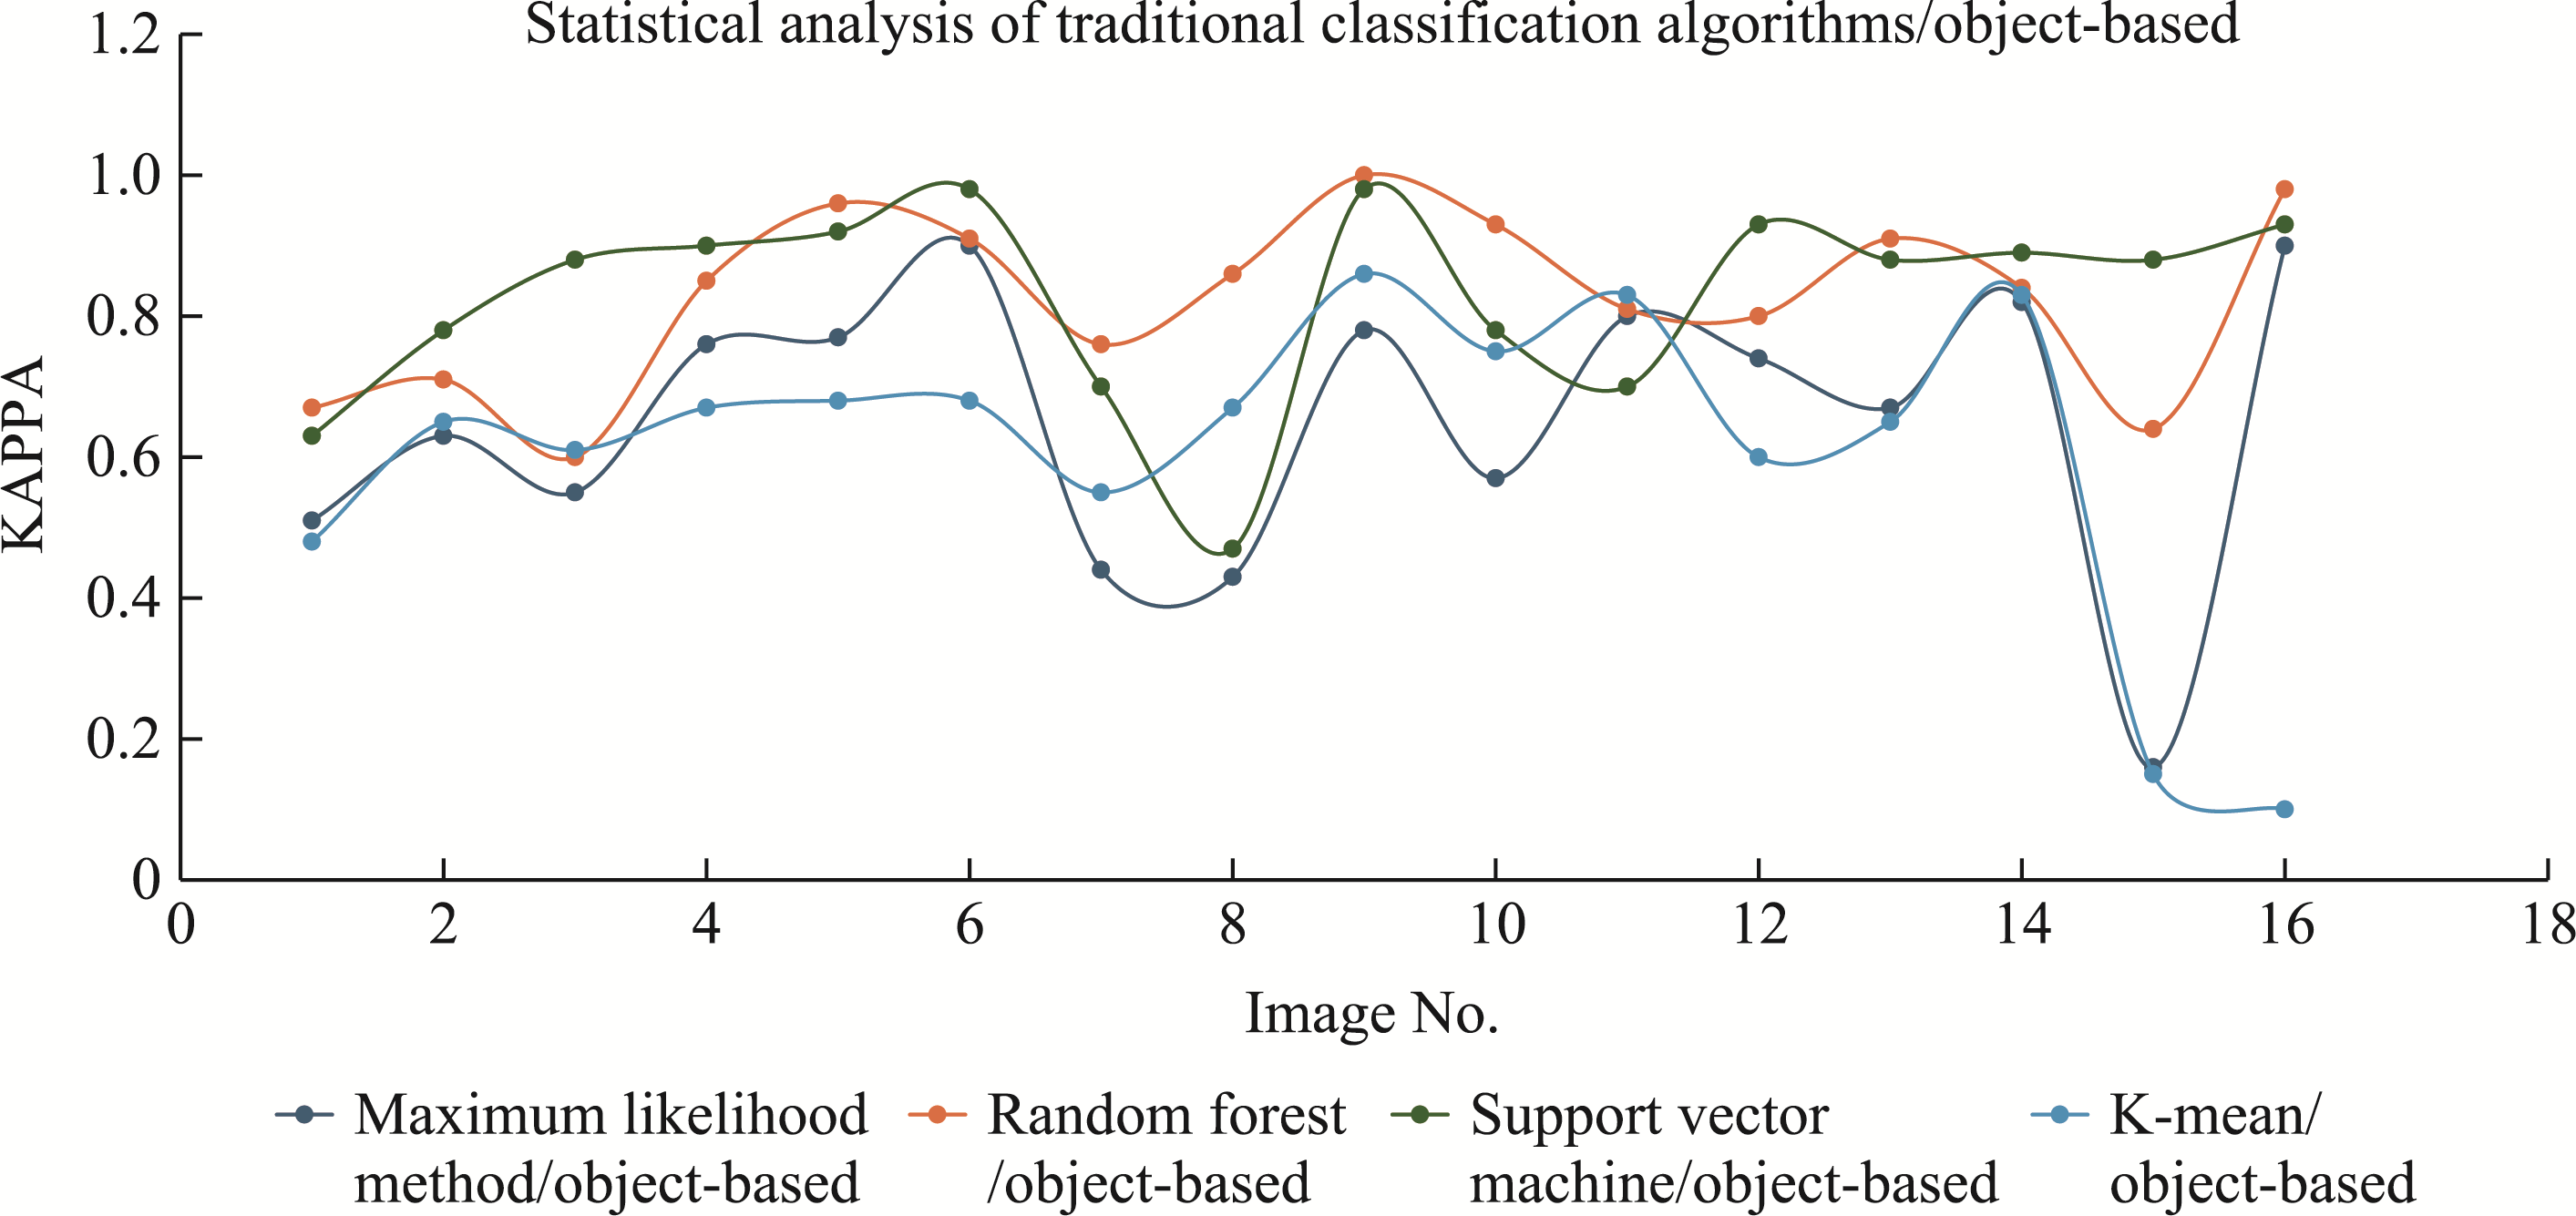
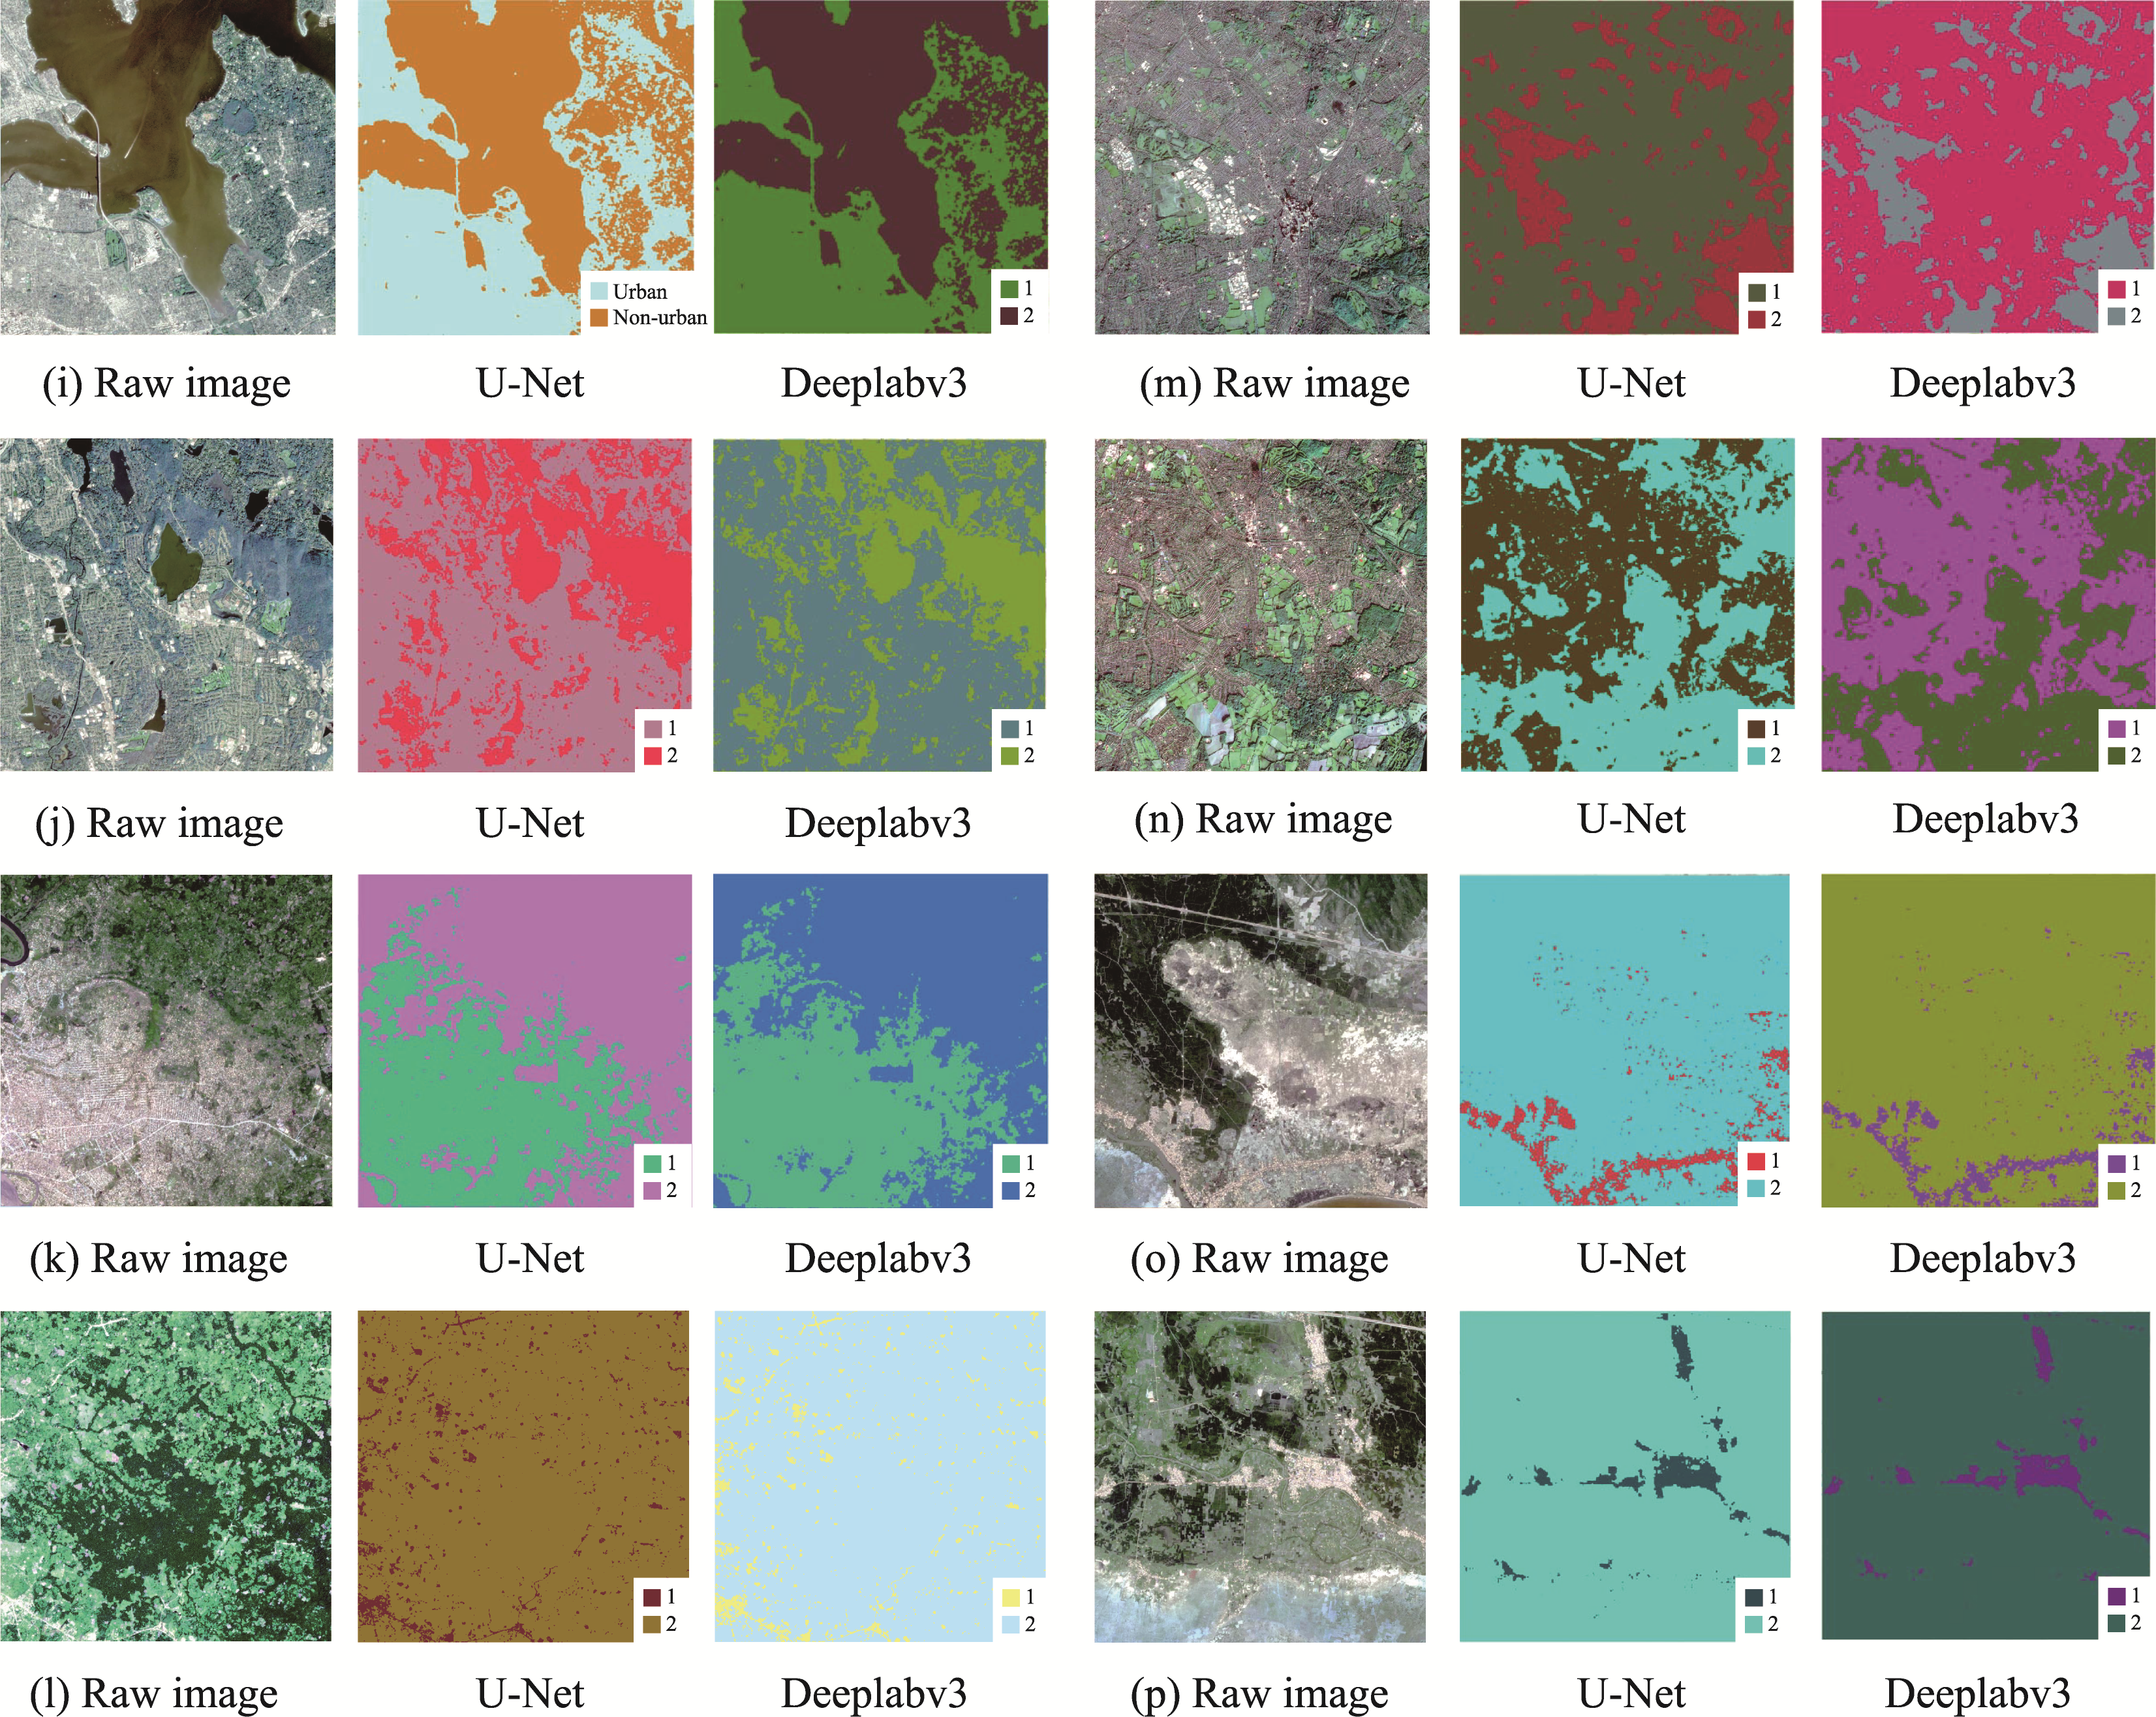
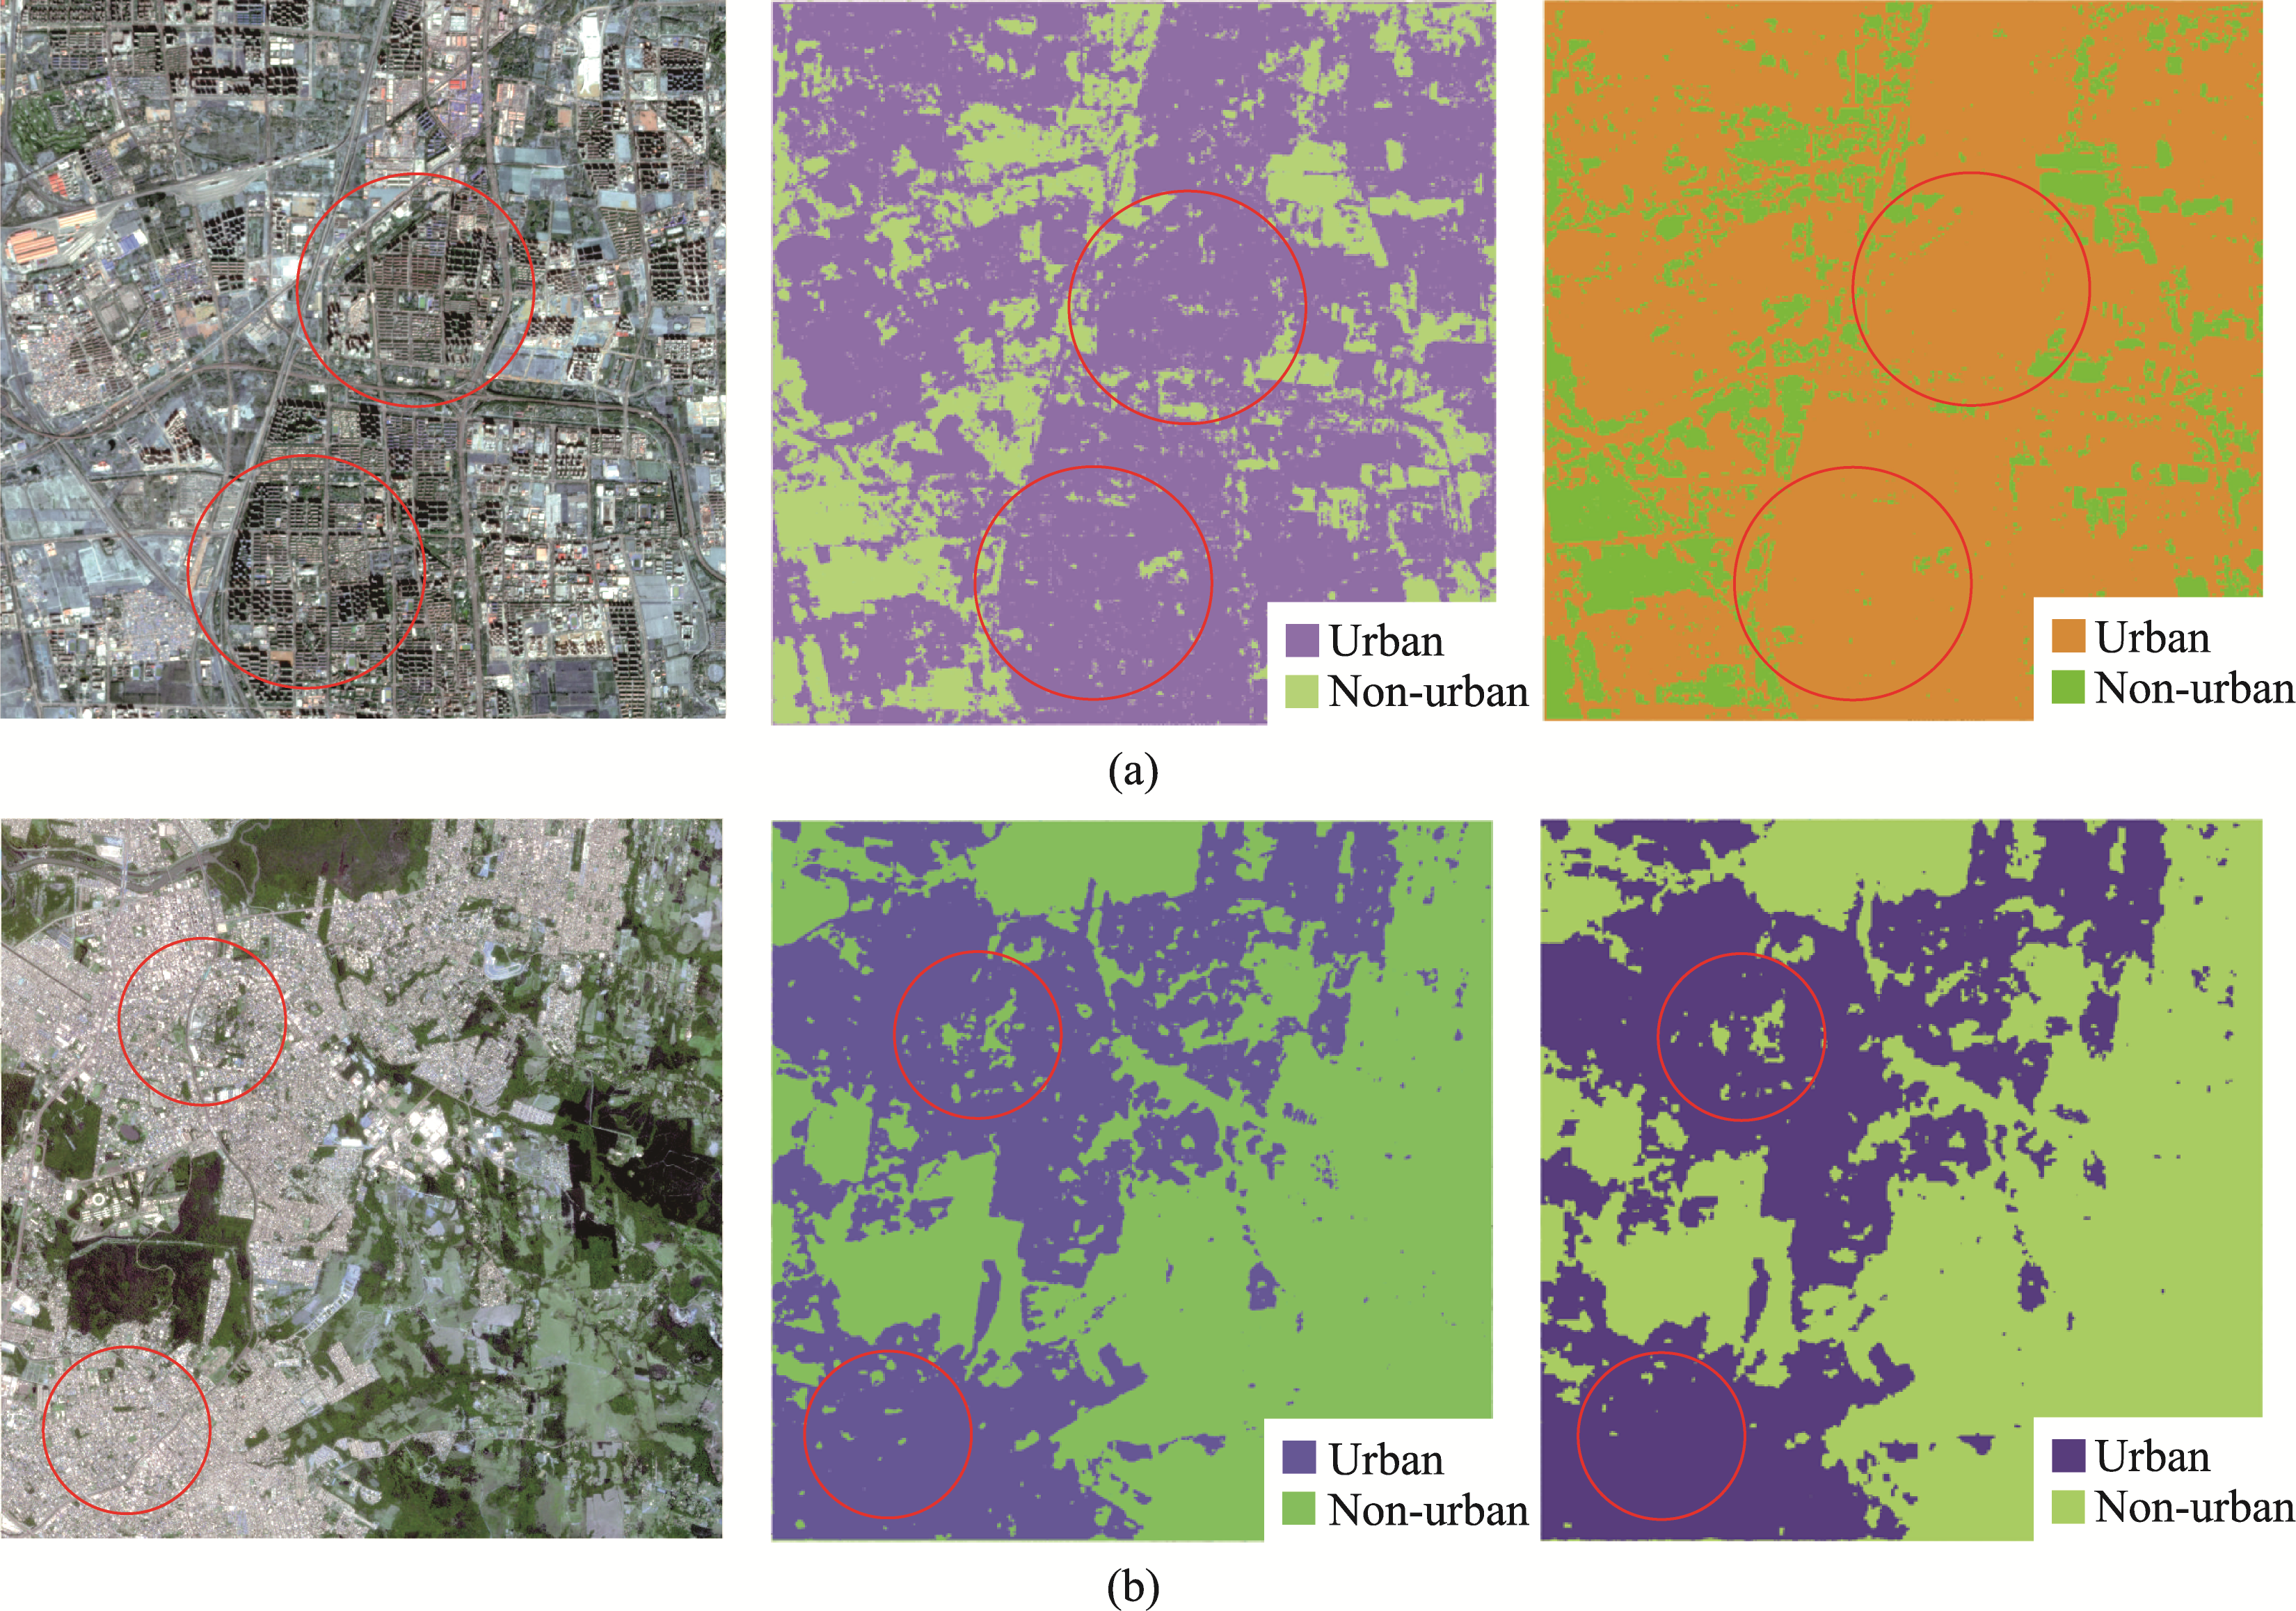
Other figure/table from this article