×
模态框(Modal)标题
在这里添加一些文本
Close
Close
Submit
Cancel
Confirm
×
模态框(Modal)标题
×
Journal
Article
Figure
Search
EN
中文
Home
About Journal
About Journal
Indexed in
Awards
Editorial Board
Guide for Authors
Browse
Current Issue
Online First
Archive
Highlights
Topic
Archive by Subject
Most Viewed
Most Download
Most Cited
E-mail Alert
RSS
Subscribe
Advertisement
Contact us
EN
中文
Figure/Table detail
Characteristics and driving factors of population age structure in China: A study based on the scale nesting theory
YING Kui, HA Lin, DUAN Liancheng, DING Jinhong
Journal of Geographical Sciences
, 2026, 36(
5
): 1278-1298. DOI:
10.1007/s11442-026-2492-y
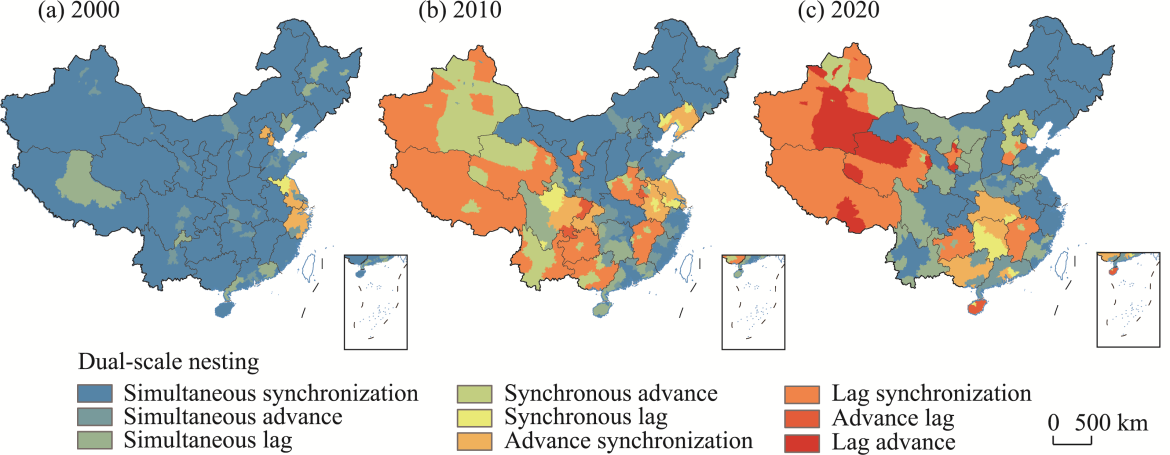
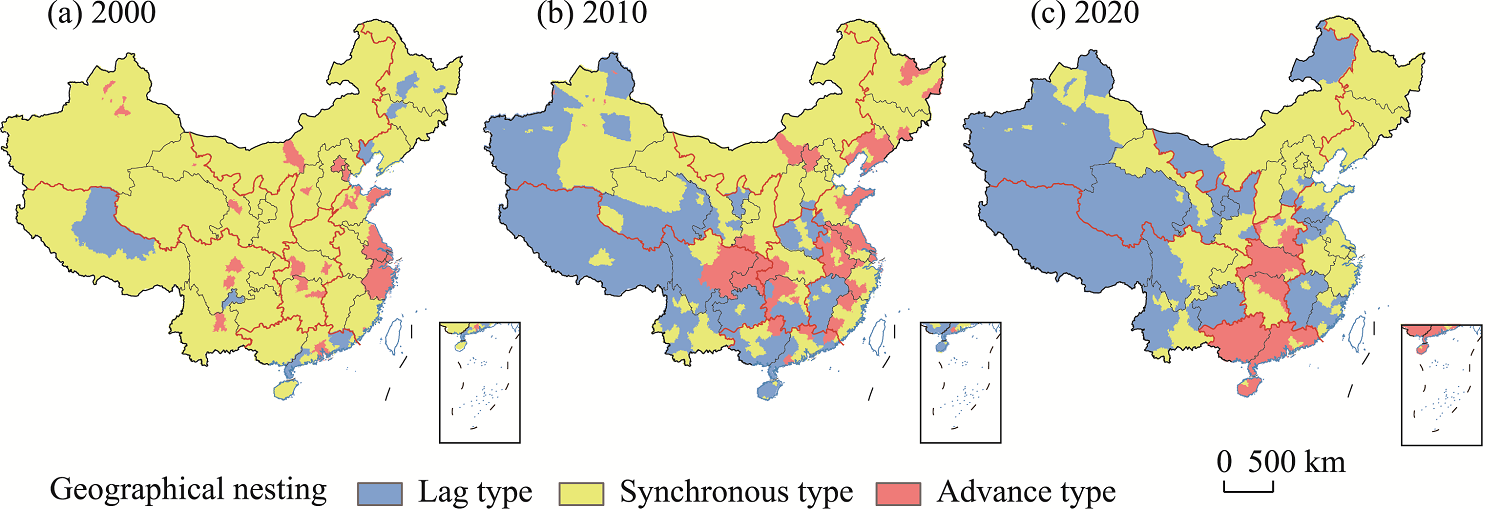
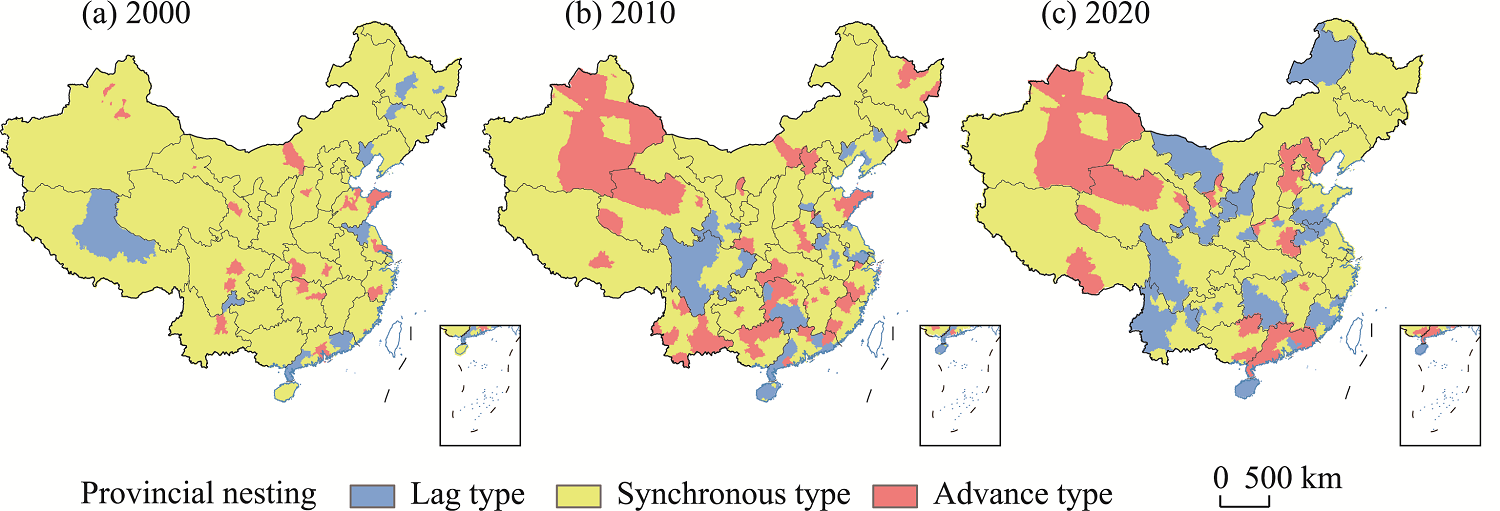
Figure 6
Dual-scale nested pattern of population age structure of China in 2000, 2010 and 2020
Other figure/table from this article
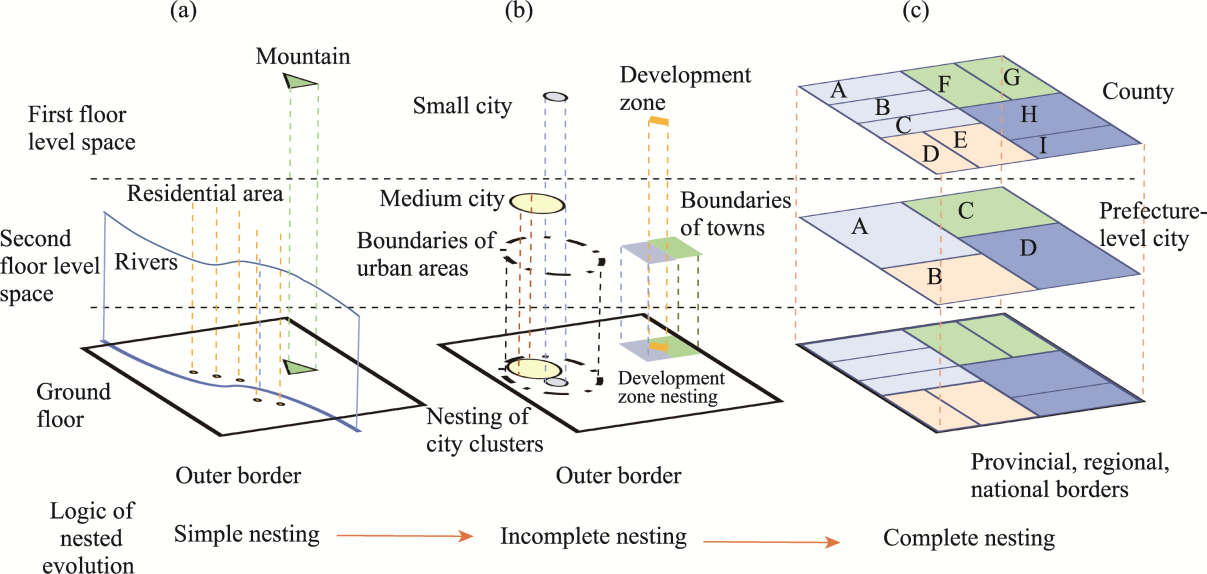
Figure 1
Logic of nested evolution of scales in geography
Table 1
Classification standards for population age structure (PAS)
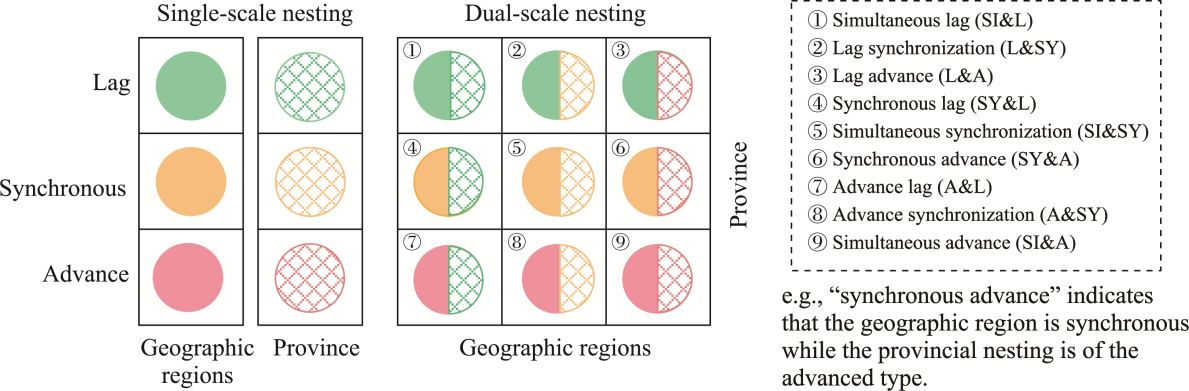
Figure 2
Types of scale nesting
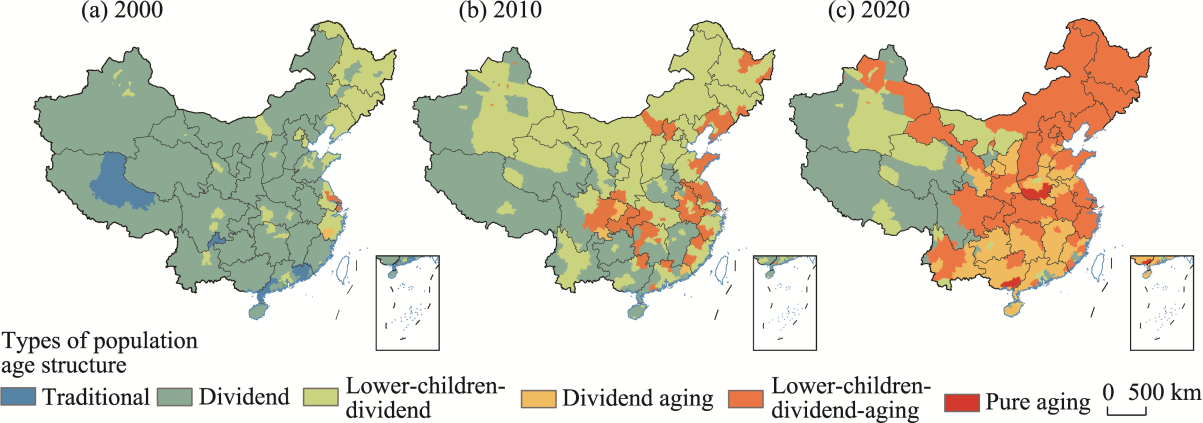
Figure 3
Spatial evolution of the population age structure in China in 2000, 2010 and 2020
Note: Data for Hong Kong, Macao, and Taiwan is missing, as is reflected in the accompanying chart.
Figure 4
Nested pattern of population age structure in seven major geographical regions of China in 2000, 2010 and 2020
Figure 5
Nested pattern of population age structure in provincial-level regions of China in 2000, 2010 and 2020
Table 2
Indicator description
Table 3
Multiscale geographically weighted regression results of population age structure driving factors in nested perspectives