| Name | Explanation | |
|---|---|---|
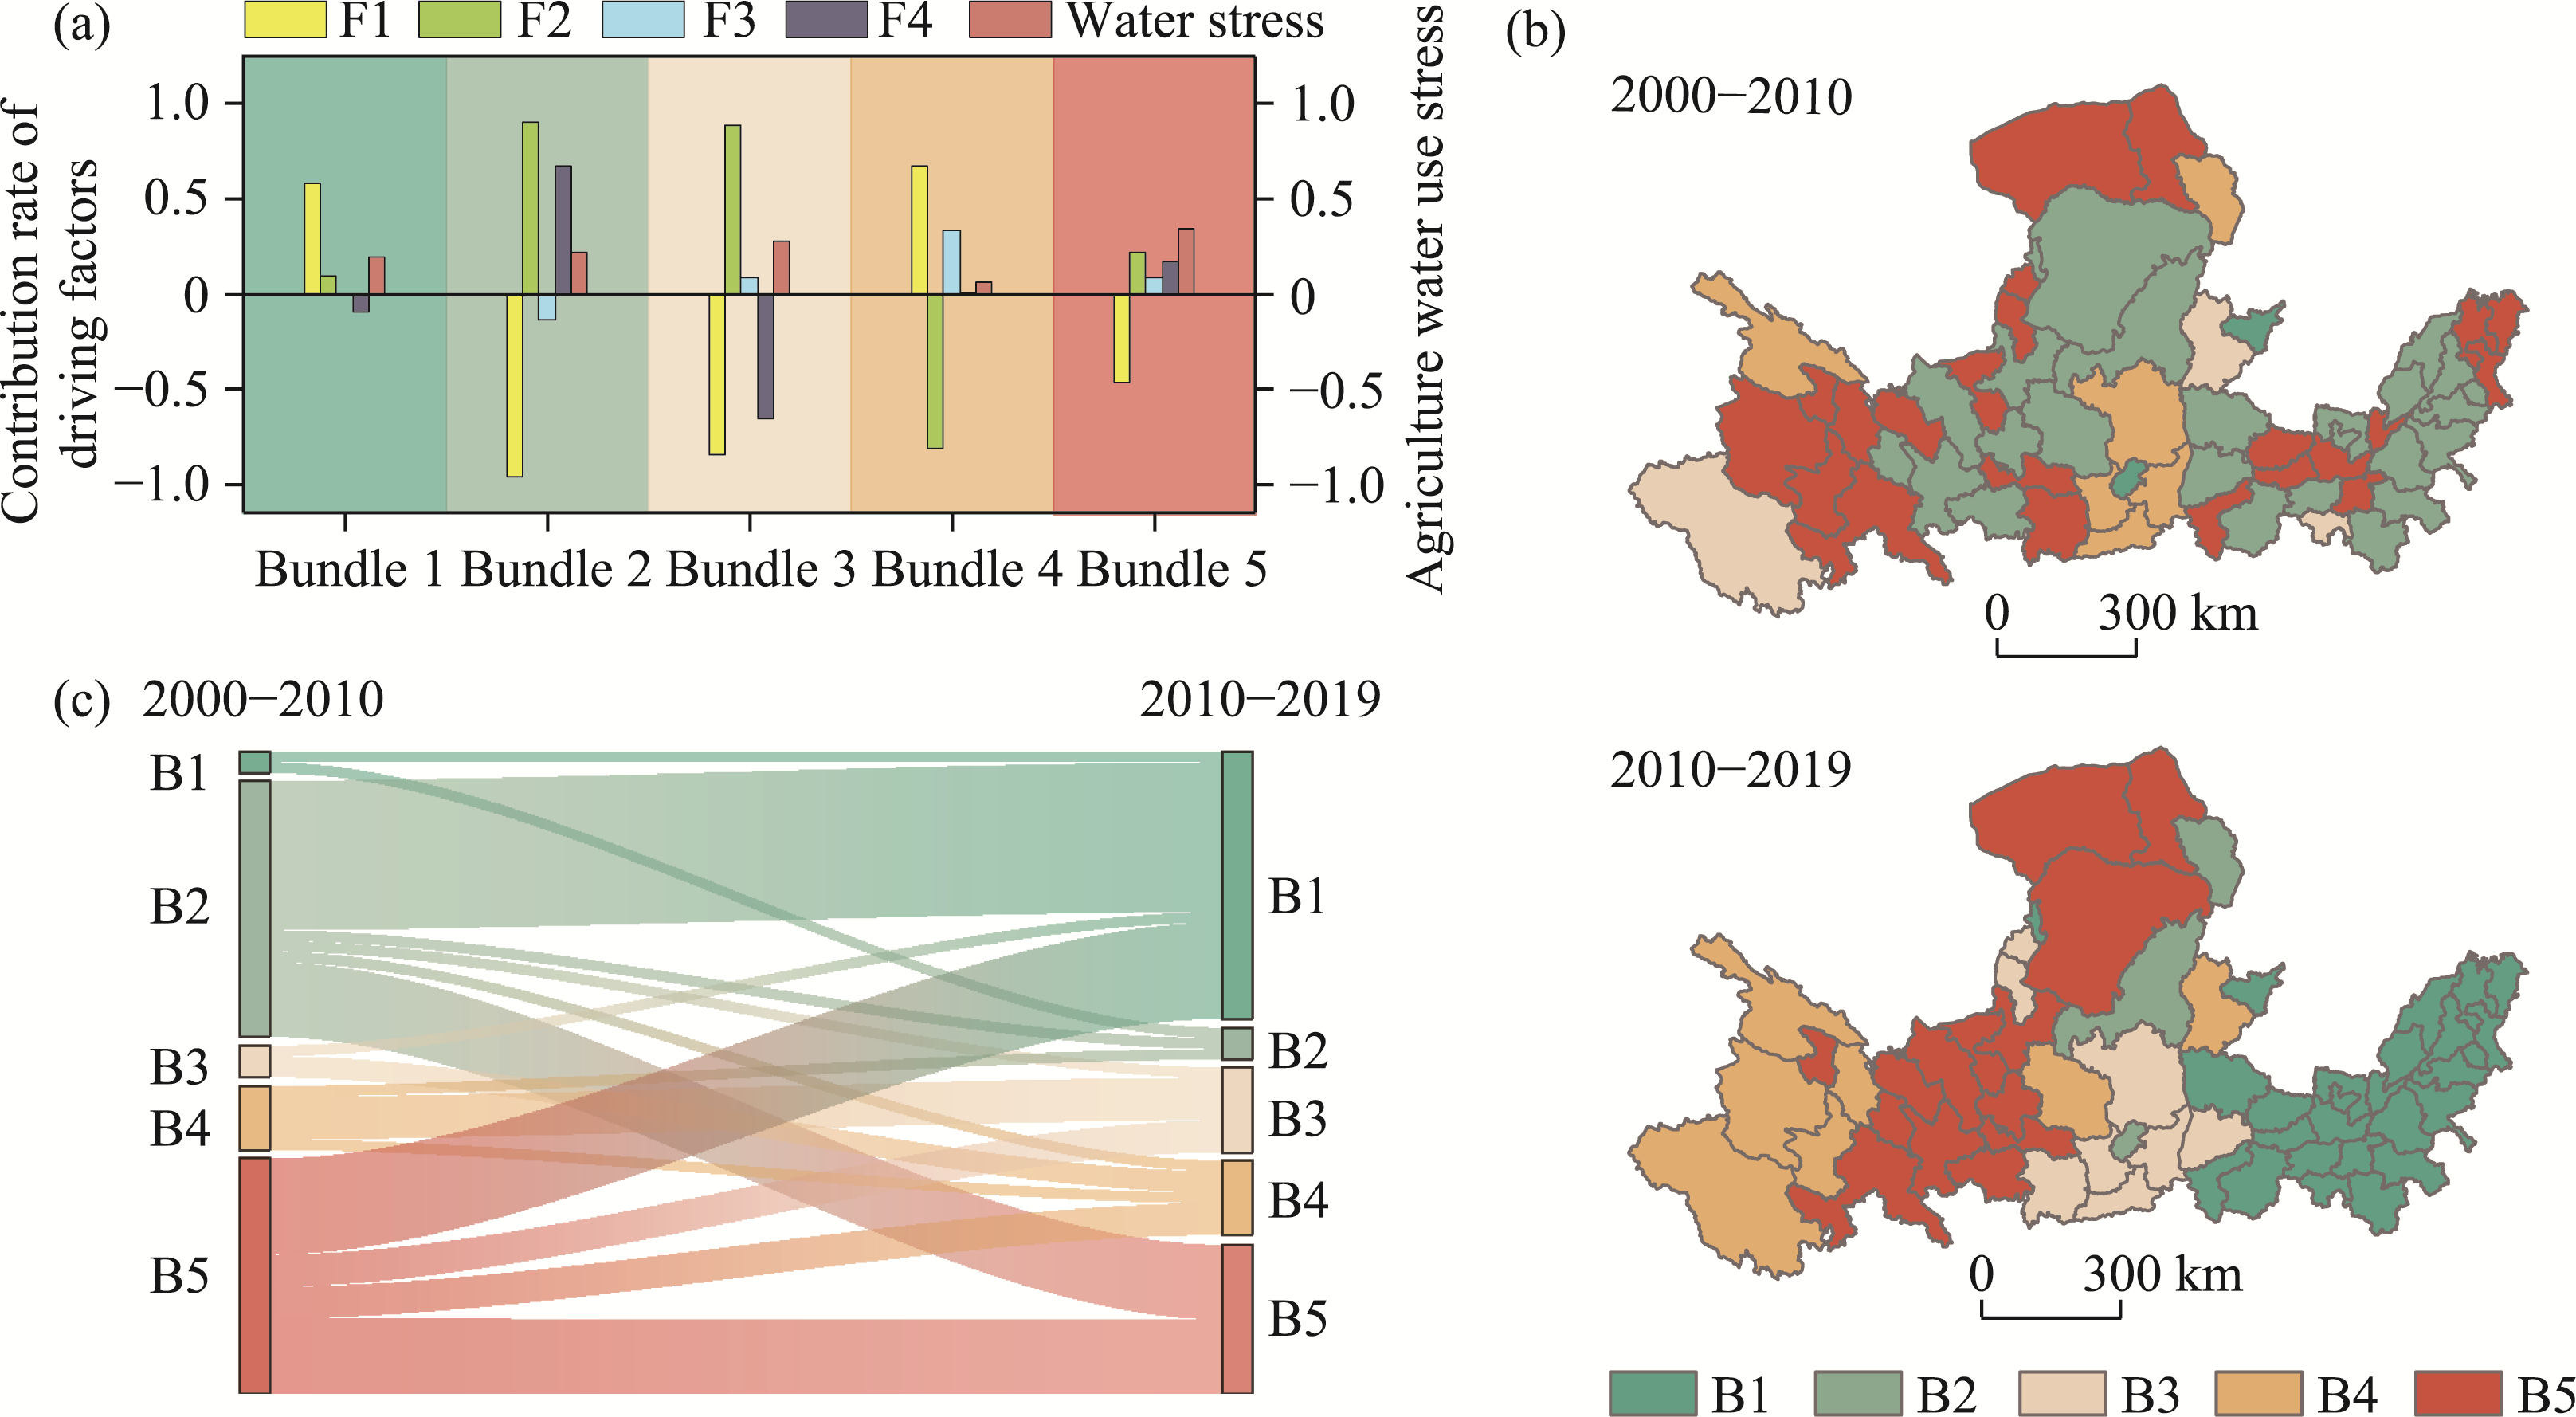
| B1 | Steady agricultural irrigation development | Characterized by moderate water stress and balanced contributions from climate efficiency and yield factors. |
| B2 | Agricultural expansion- intensification group | Dominated by large-scale cultivated area expansion and yield-driven irrigation demand. |
| B3 | Agricultural contraction- intensification group | Features significant reduction in cultivated area but heightened yield-induced water pressure. |
| B4 | Specialty agriculture development group | Exhibits low water stress with efficiency gains offset by structural adjustments. |
| B5 | Agricultural water-stressed development group | Combines severe water stress with conflicting drivers of efficiency gains and scale-driven demand. |