×
模态框(Modal)标题
在这里添加一些文本
Close
Close
Submit
Cancel
Confirm
×
模态框(Modal)标题
×
Journal
Article
Figure
Search
EN
中文
Home
About Journal
About Journal
Indexed in
Awards
Editorial Board
Guide for Authors
Browse
Current Issue
Online First
Archive
Highlights
Topic
Archive by Subject
Most Viewed
Most Download
Most Cited
E-mail Alert
RSS
Subscribe
Advertisement
Contact us
EN
中文
Figure/Table detail
Evolution of the historical polder landscape in the ancient Danyang wetland, lower Yangtze River, China, during the last 3000 years
HU Xiaosi, WU Li, ZHUANG Yijie, WANG Xinyuan, MA Chunmei, LI Linying, GUAN Houchun, LU Shuguang, LUO Wenjing, XU Ziyi
Journal of Geographical Sciences
, 2024, 34(
10
): 2053-2073. DOI:
10.1007/s11442-024-2282-3
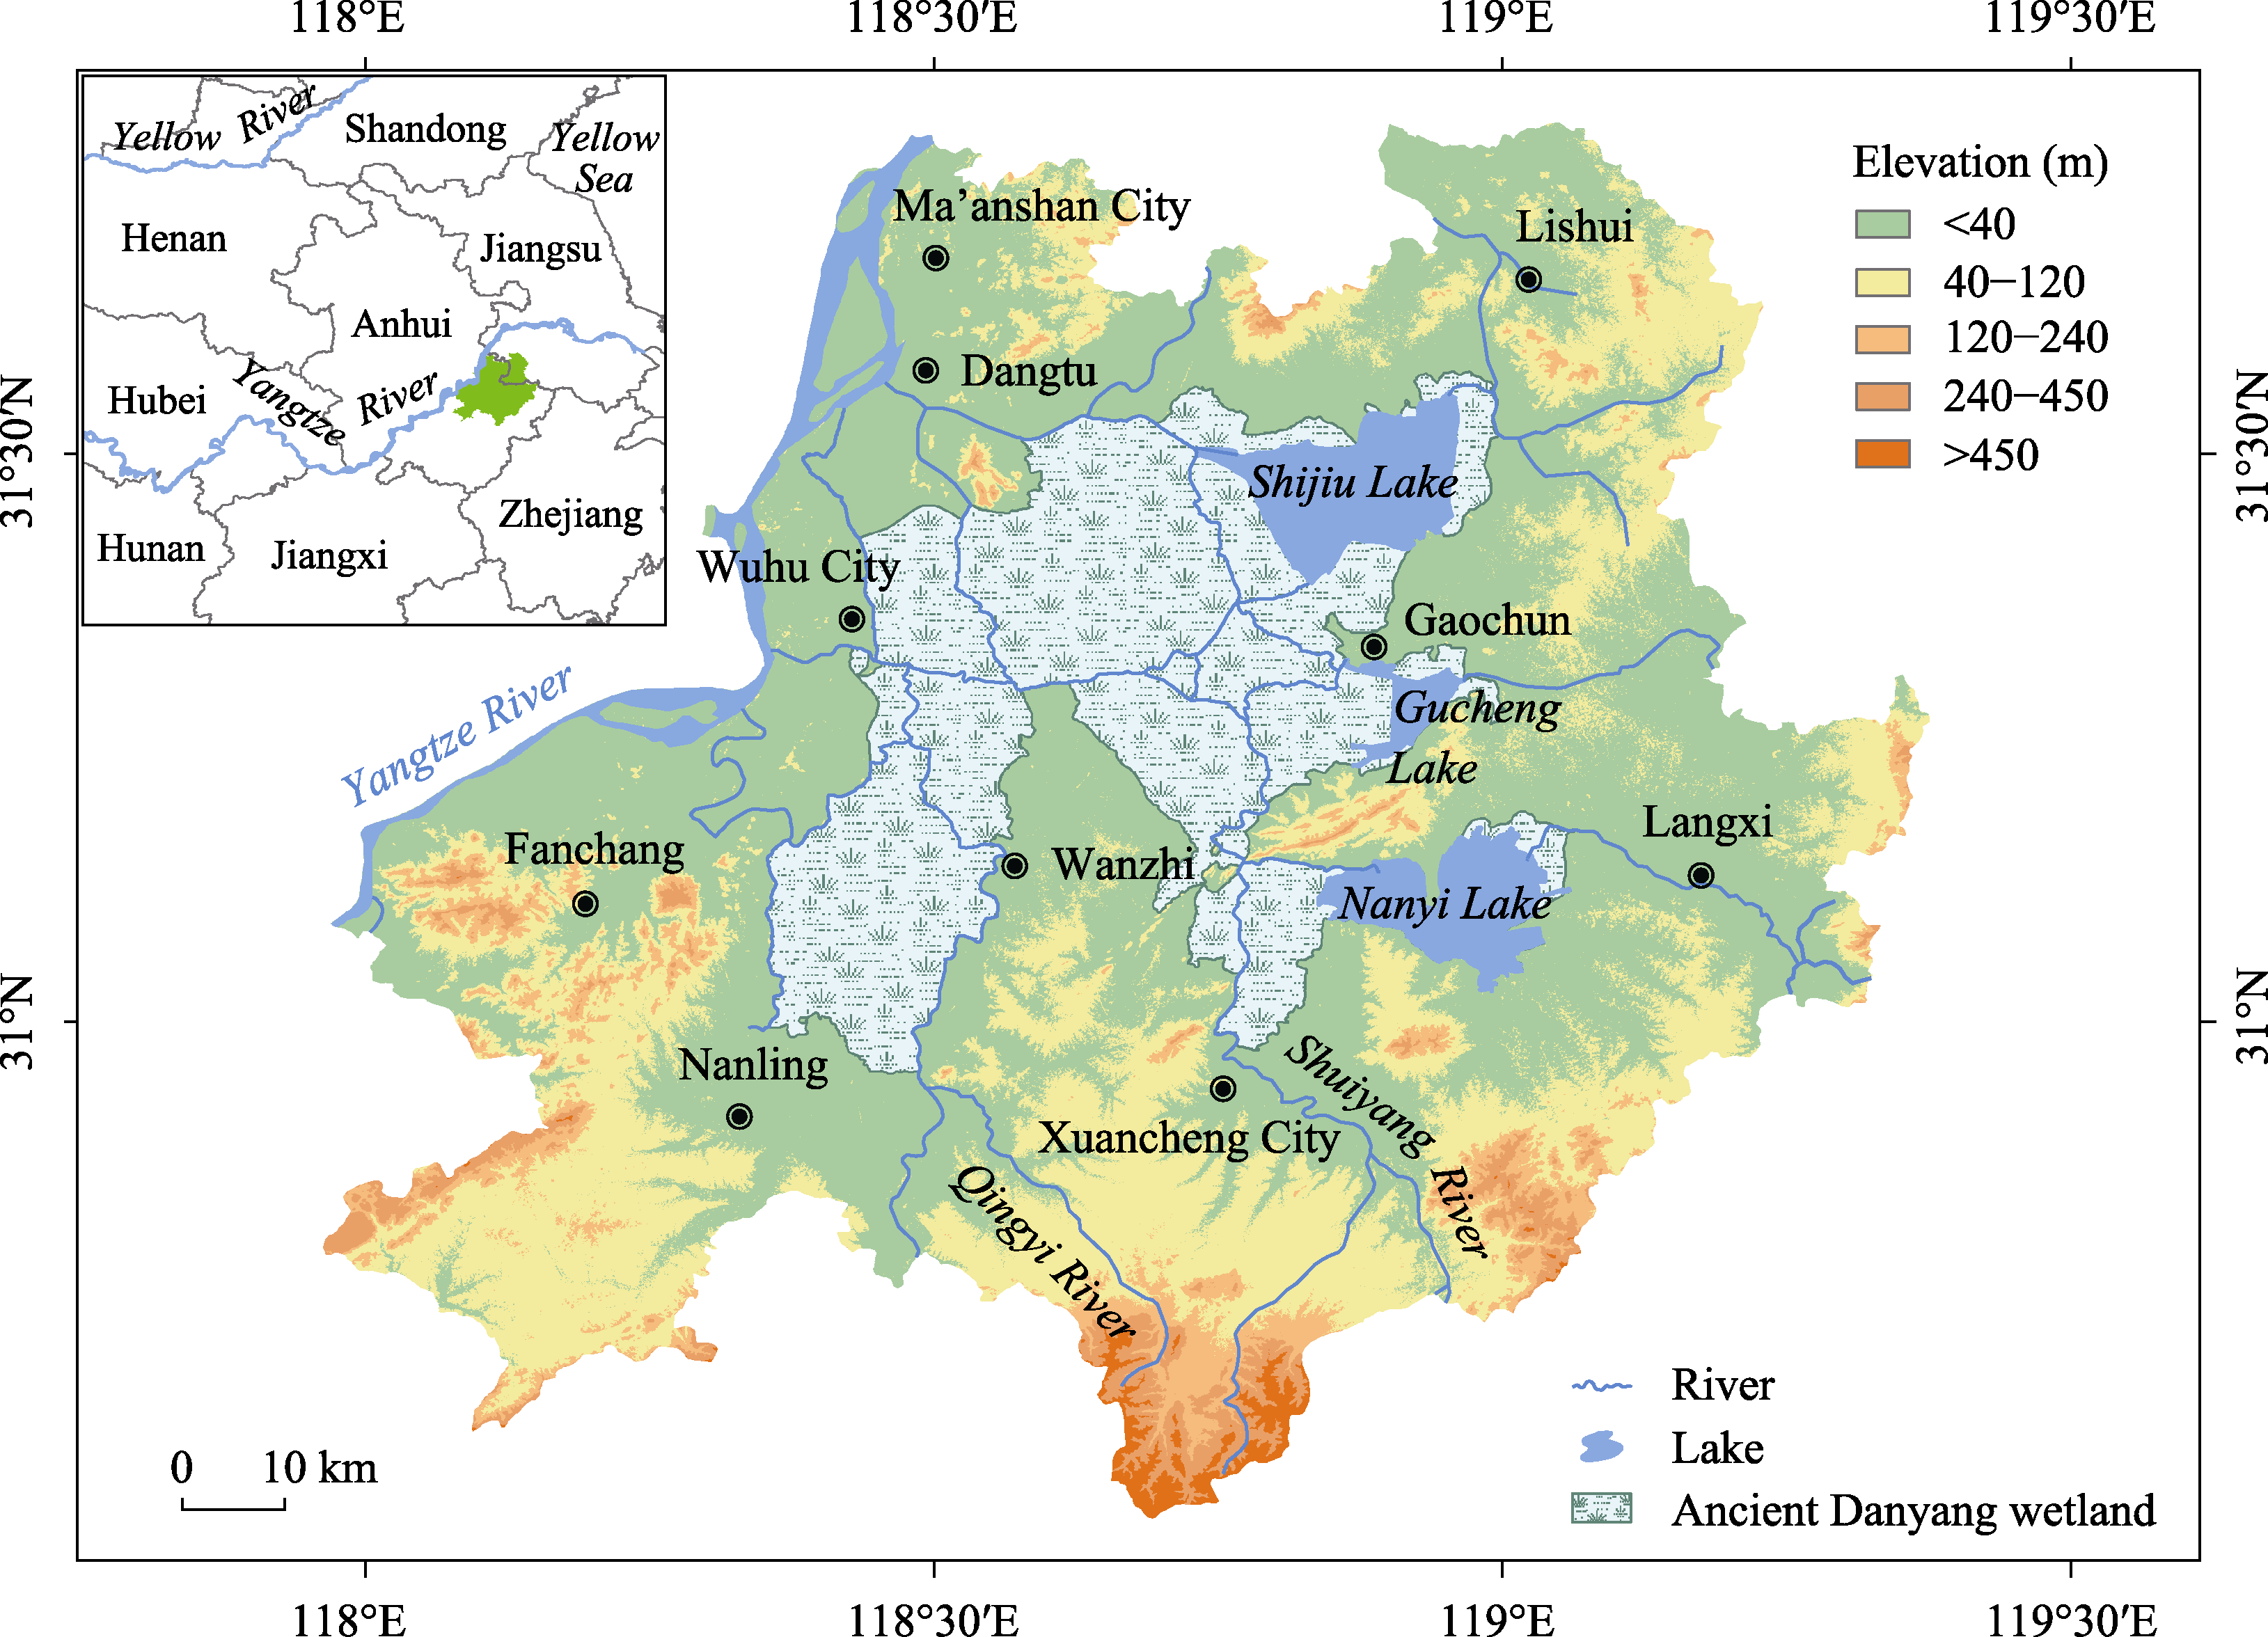
Figure 1
Location of the ancient Danyang wetland in southeastern Anhui province
Other figure/table from this article
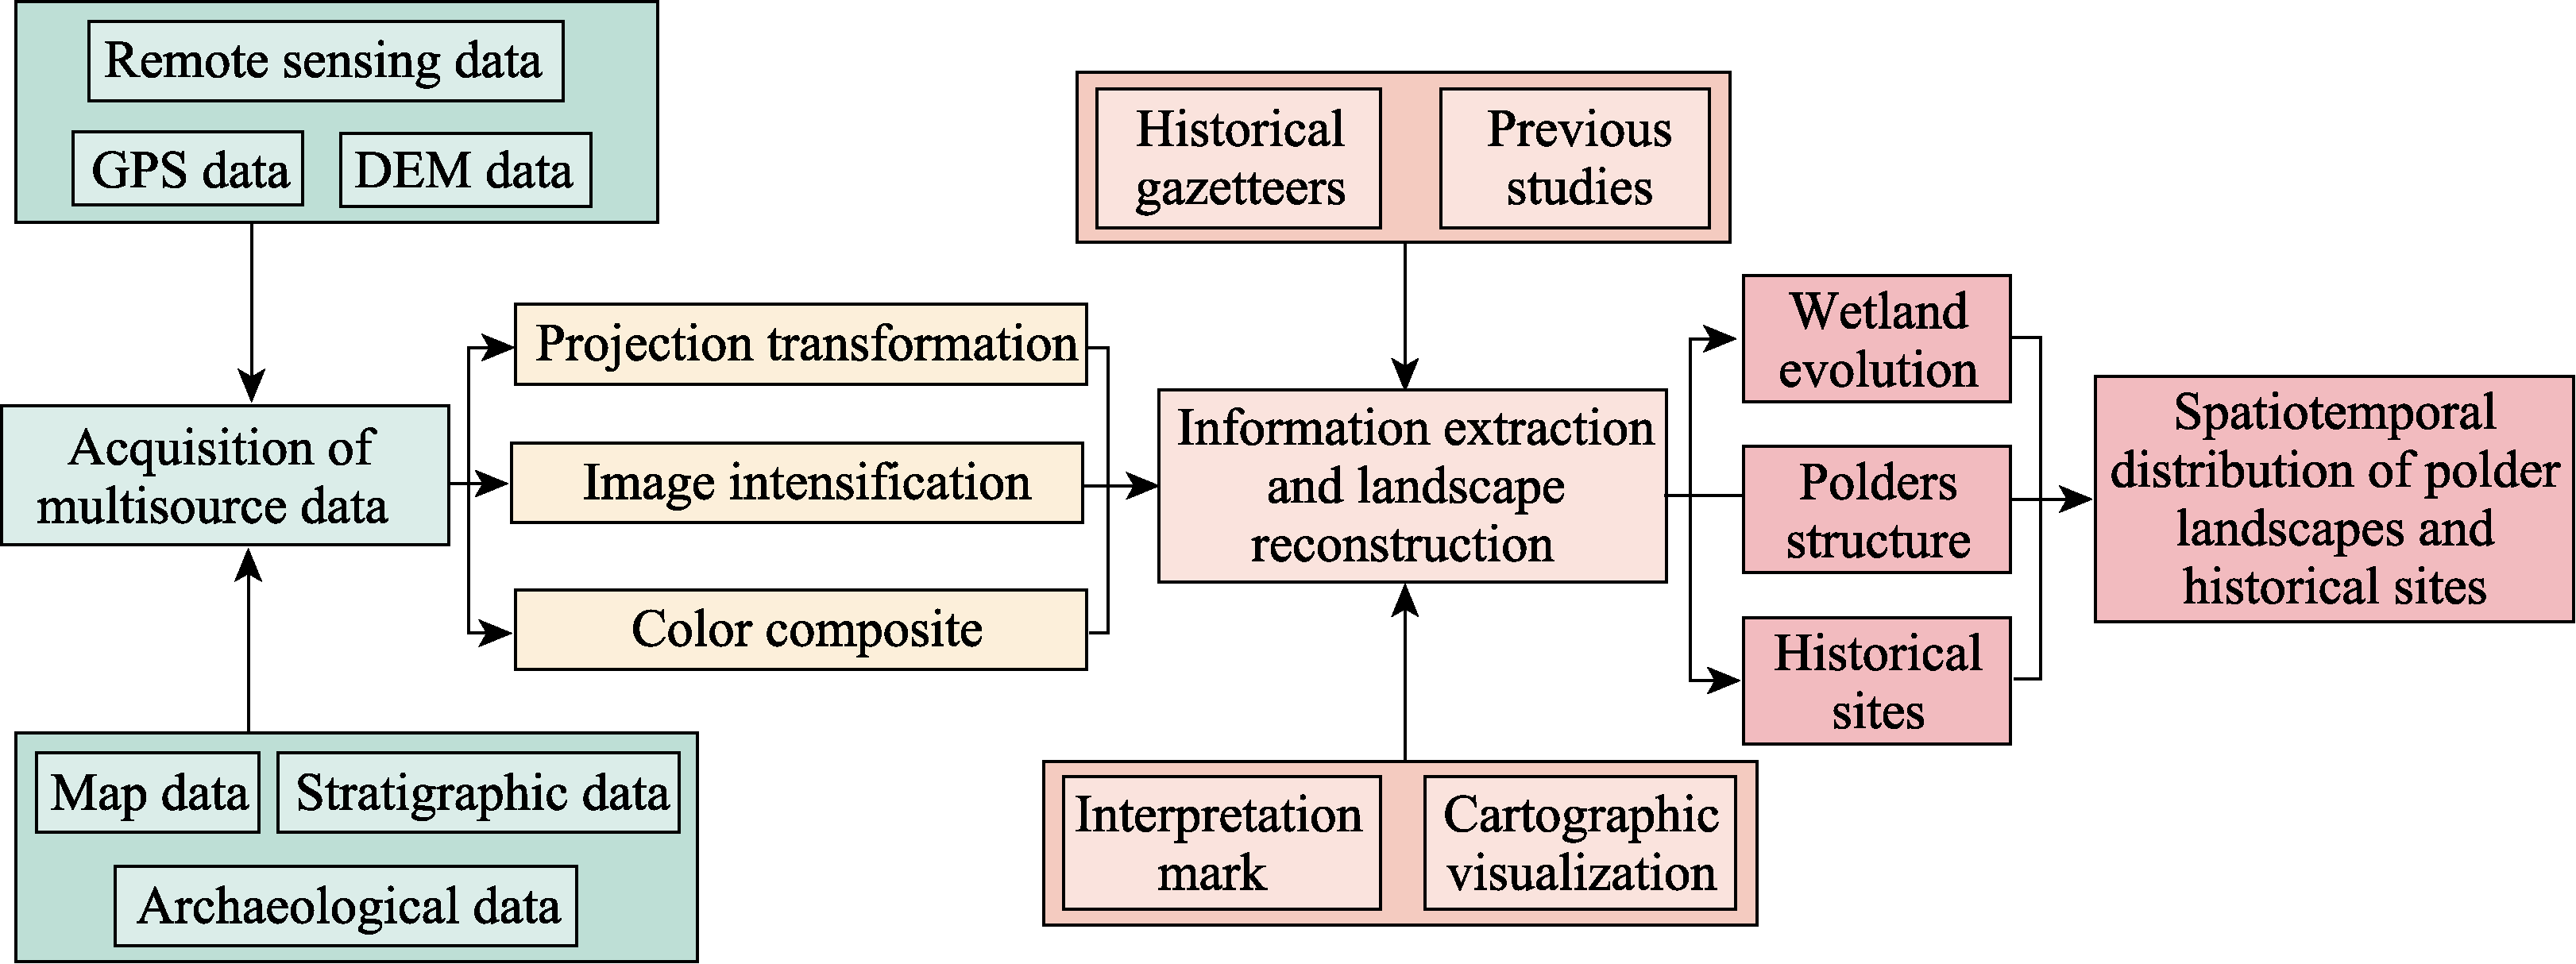
Figure 2
Methodological flow chart showing how our research was designed and carried out
Table 1
The newly built area of the poldered fields with a unit of km
2
/100 yr in the past 3000 years
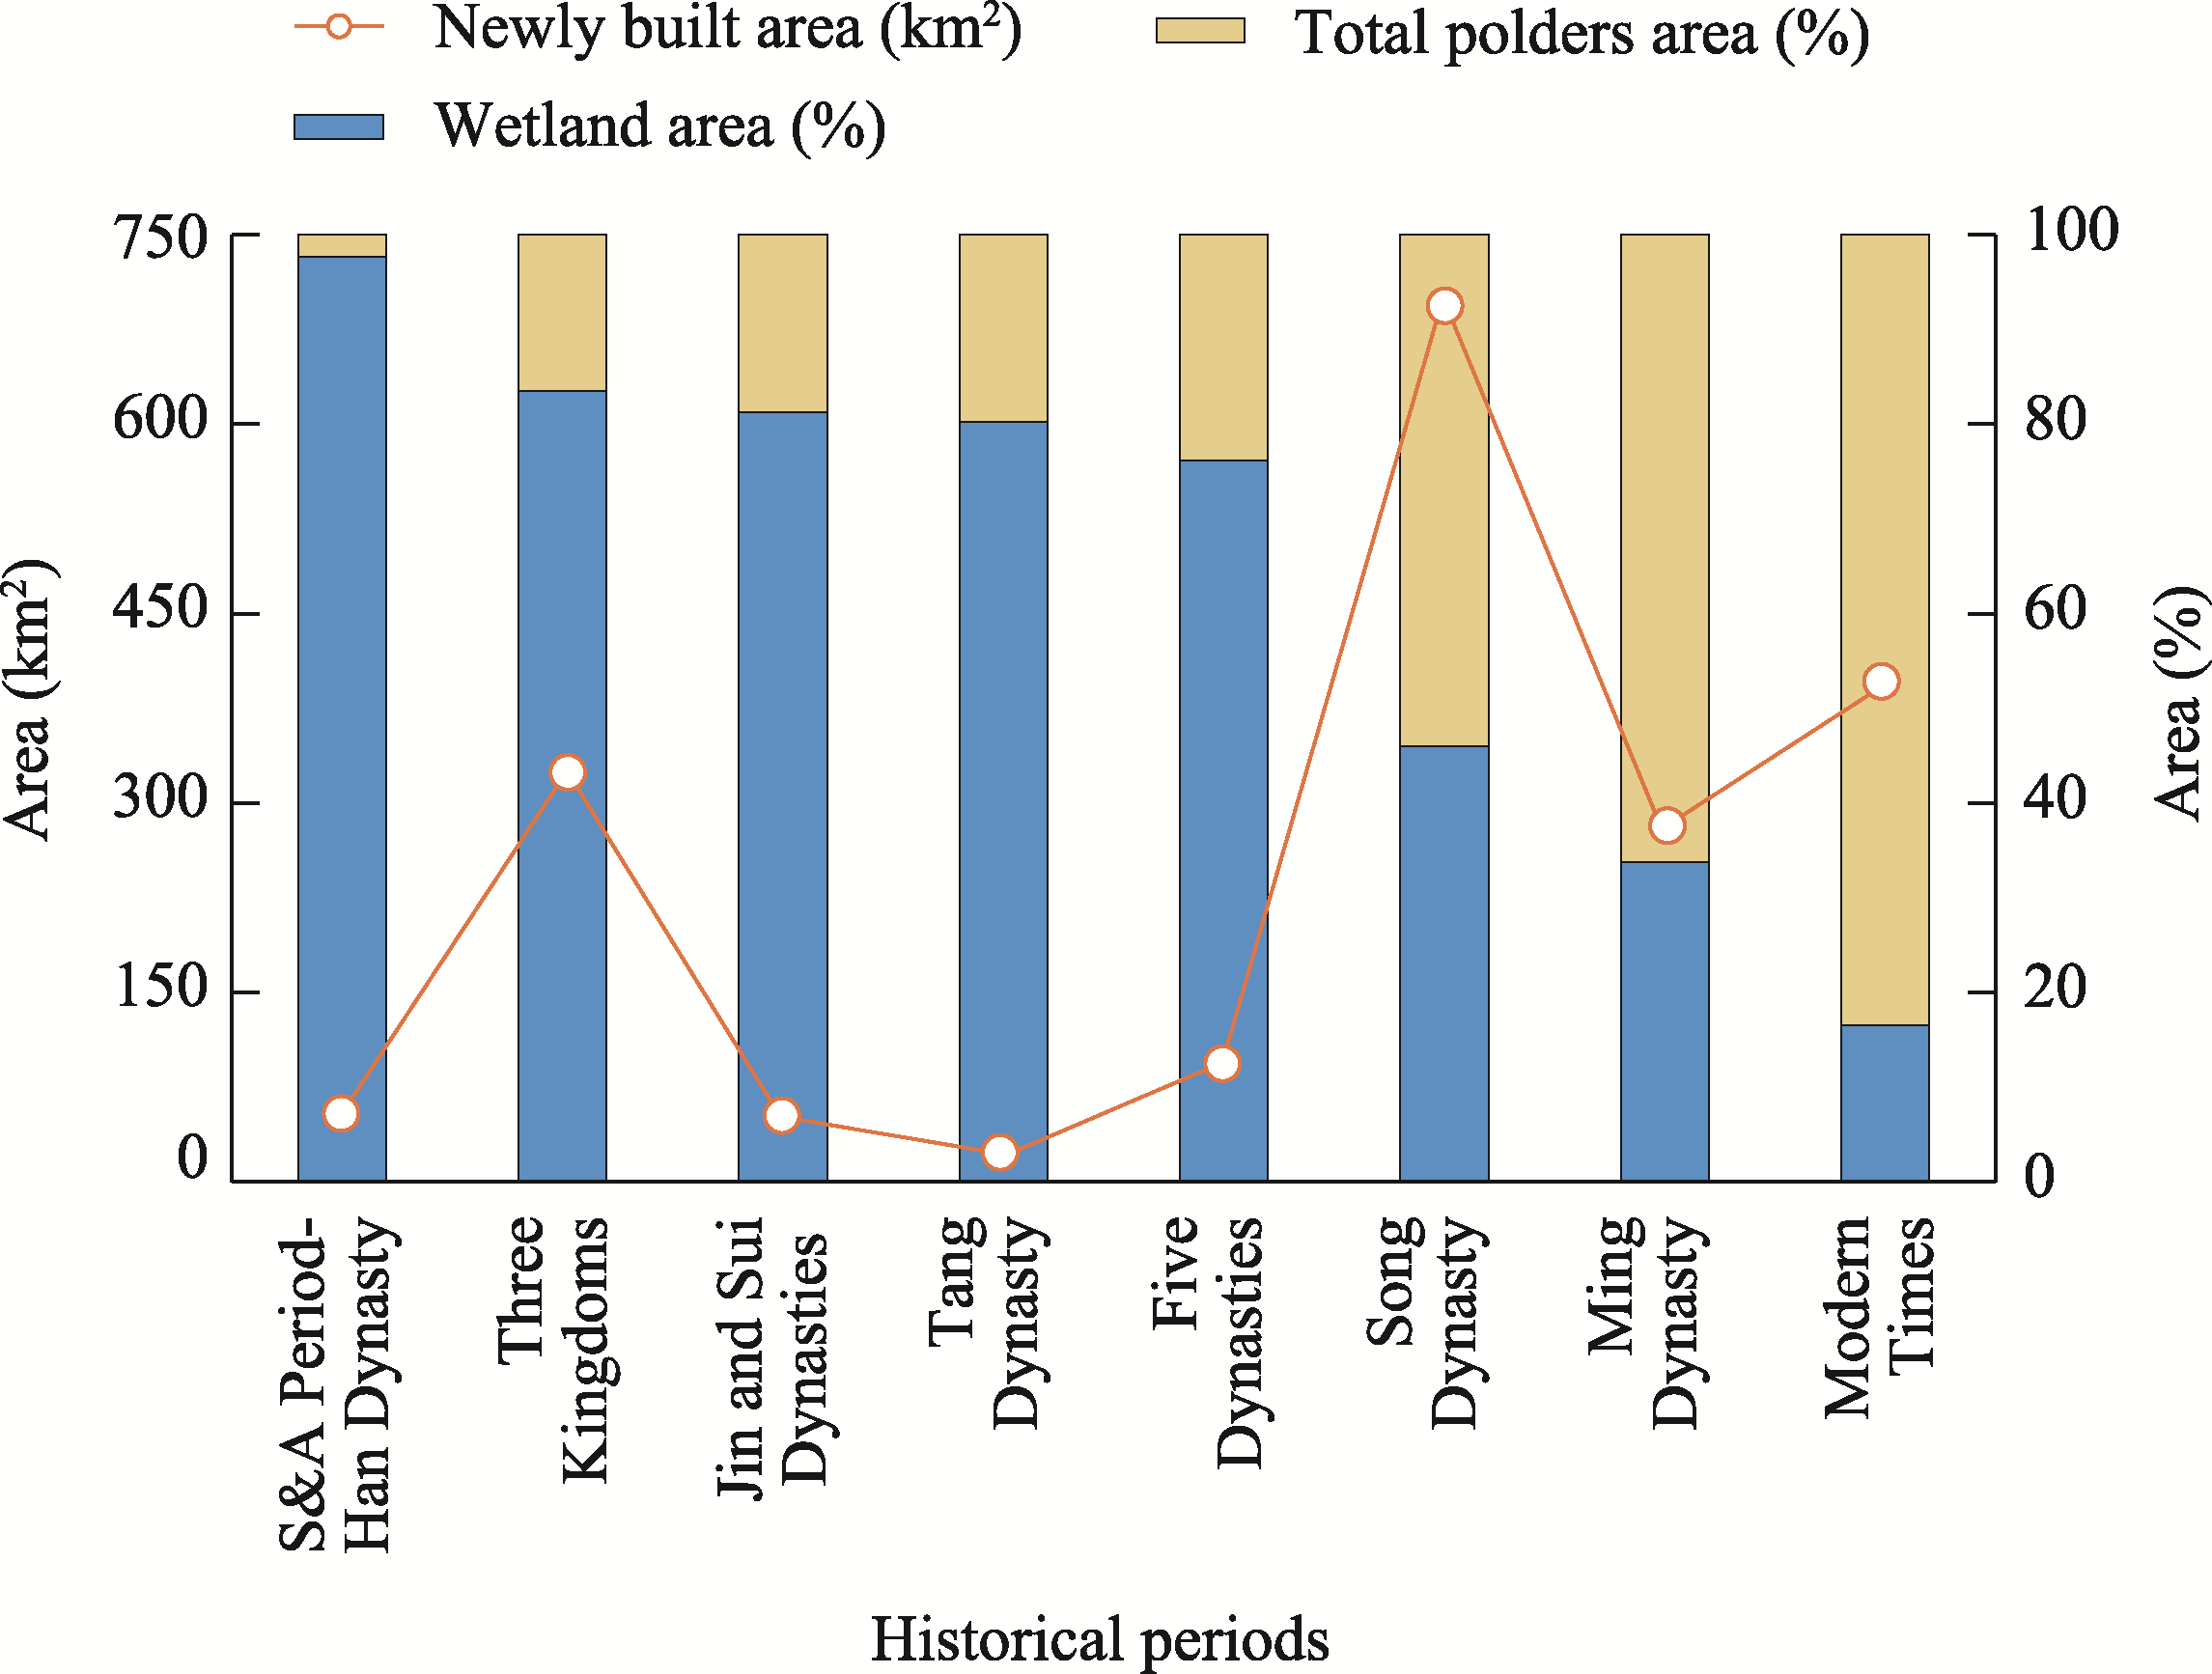
Figure 3
Change in the areas of the ancient Danyang wetland and poldered fields during the historical periods
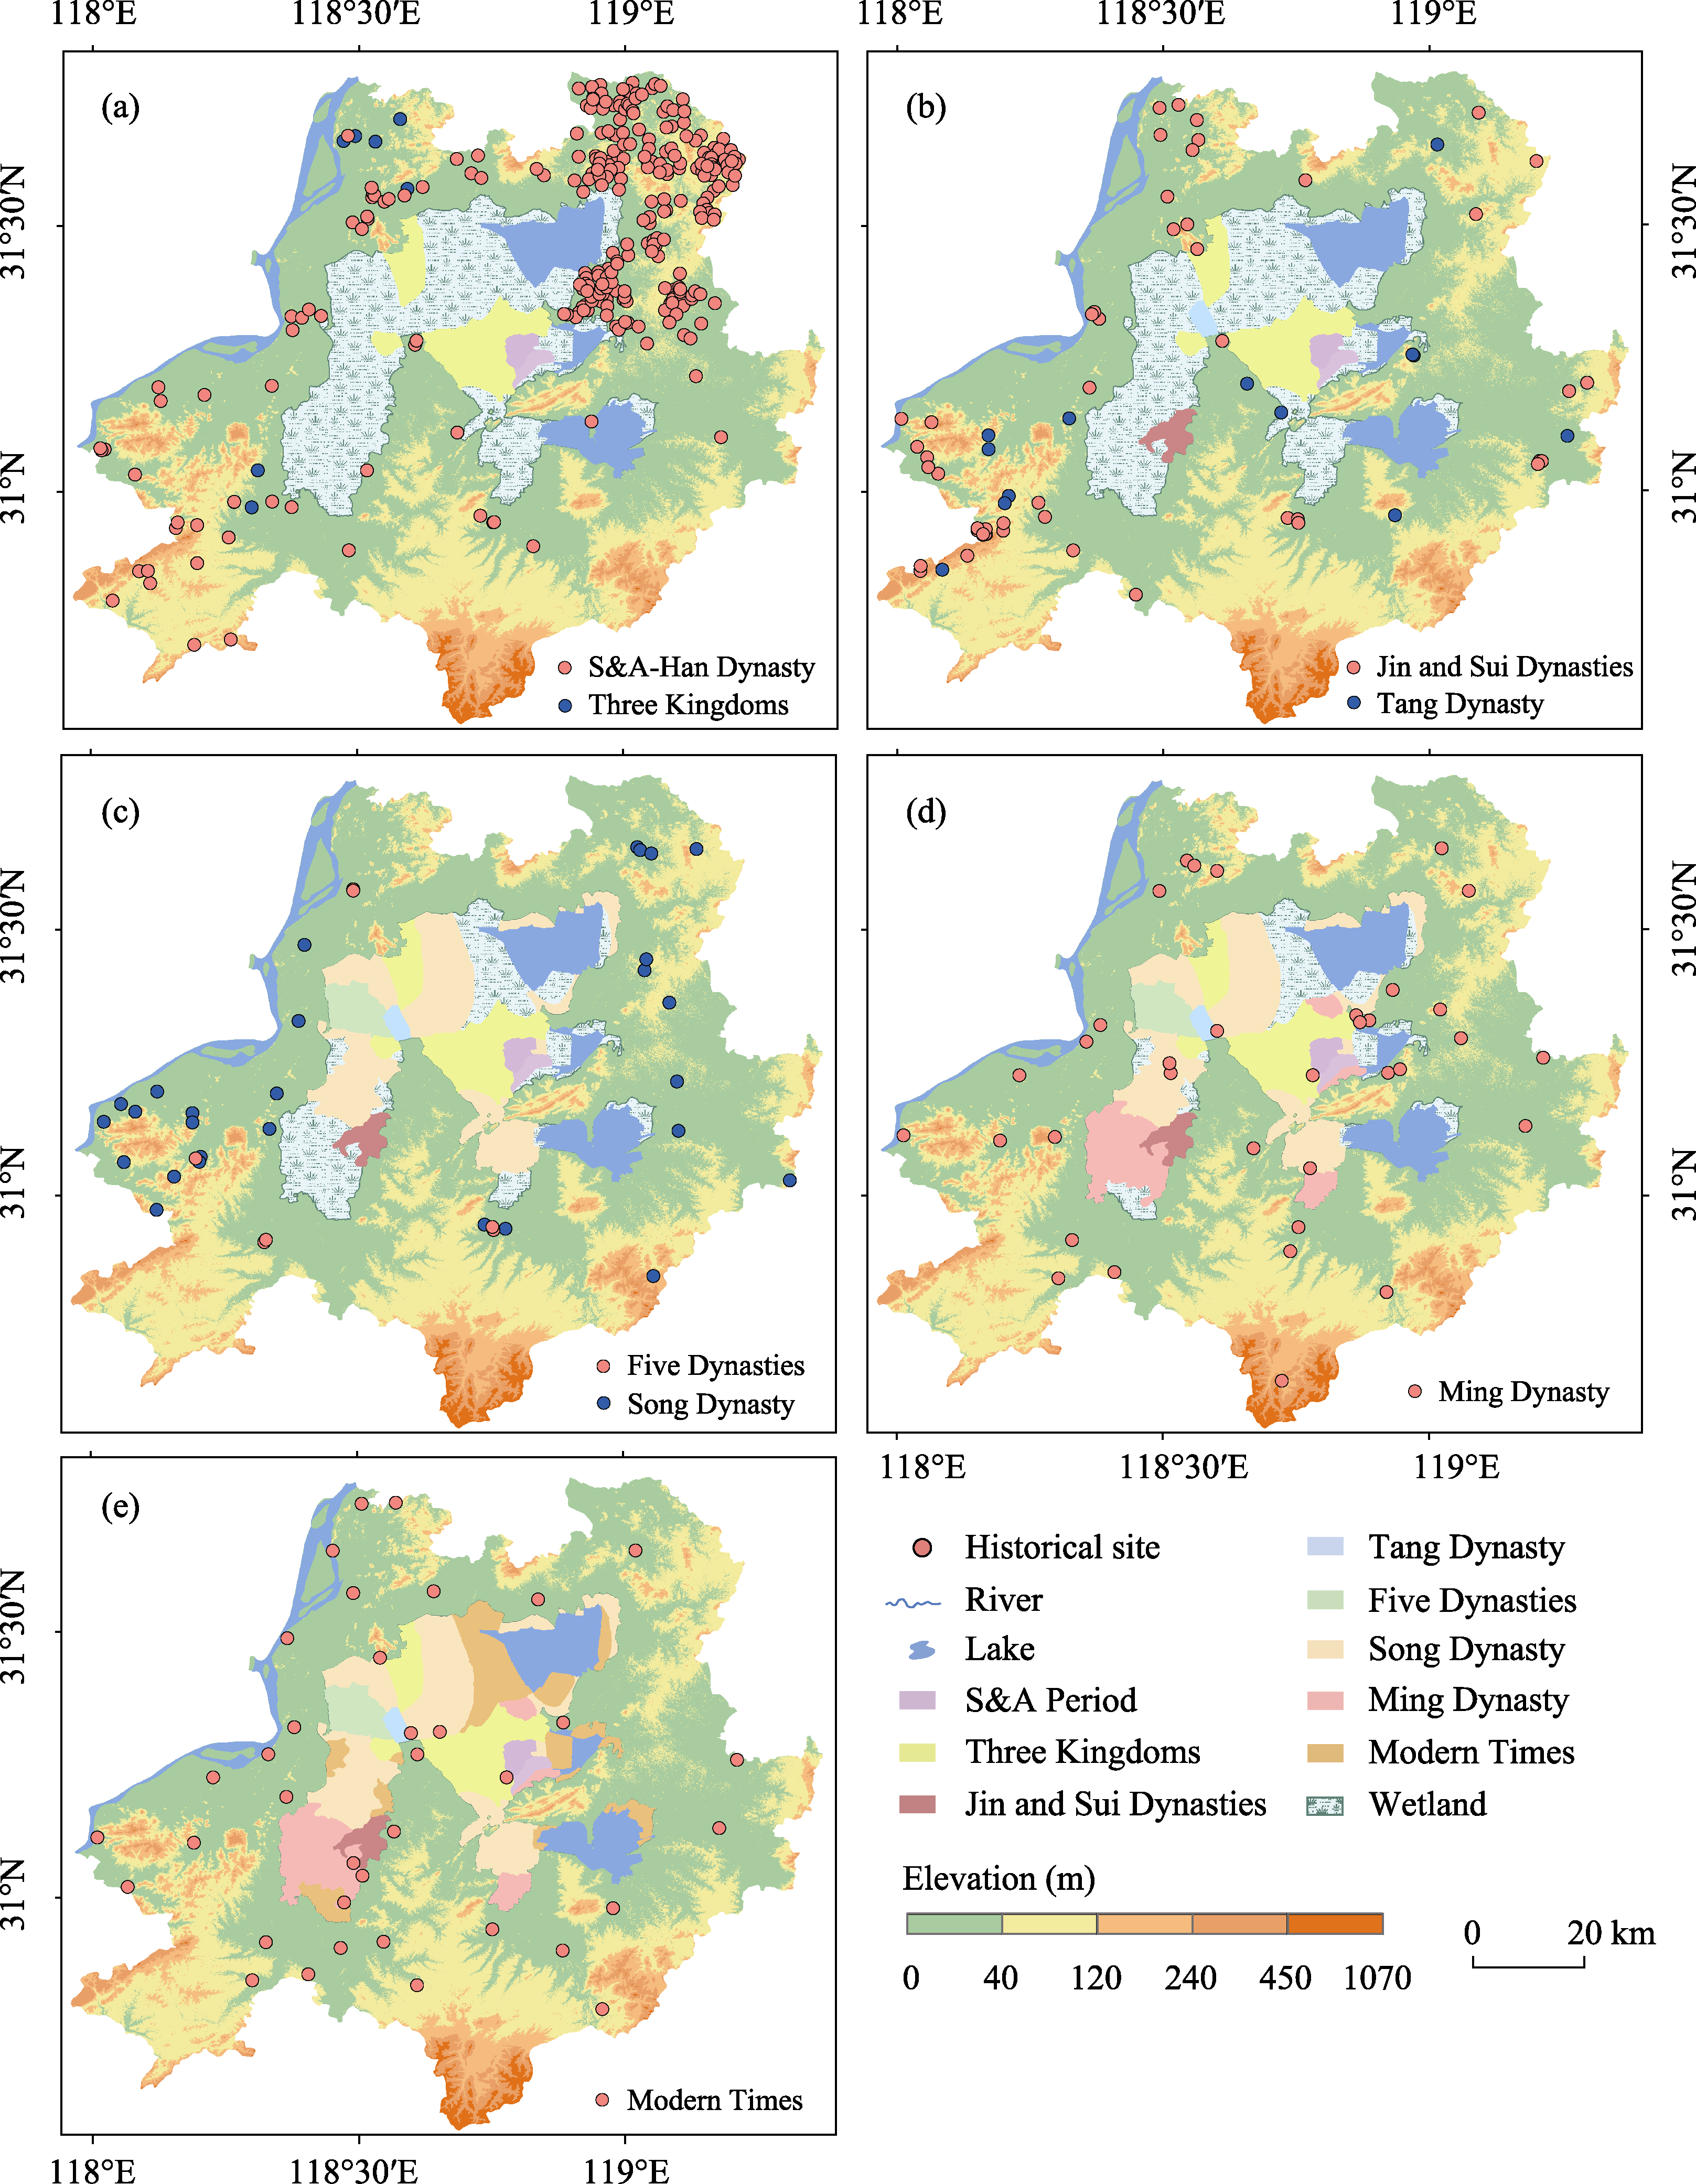
Figure 4
The distributions of the poldered fields and historical sites varied across different dynasties, including the Spring and Autumn Period to the Three Kingdoms Period (a), the Jin and Sui Dynasties to the Tang Dynasty (b), the Five Dynasties to the Song Dynasty (c), the Ming Dynasty (d) and Modern Times (e) in the study area
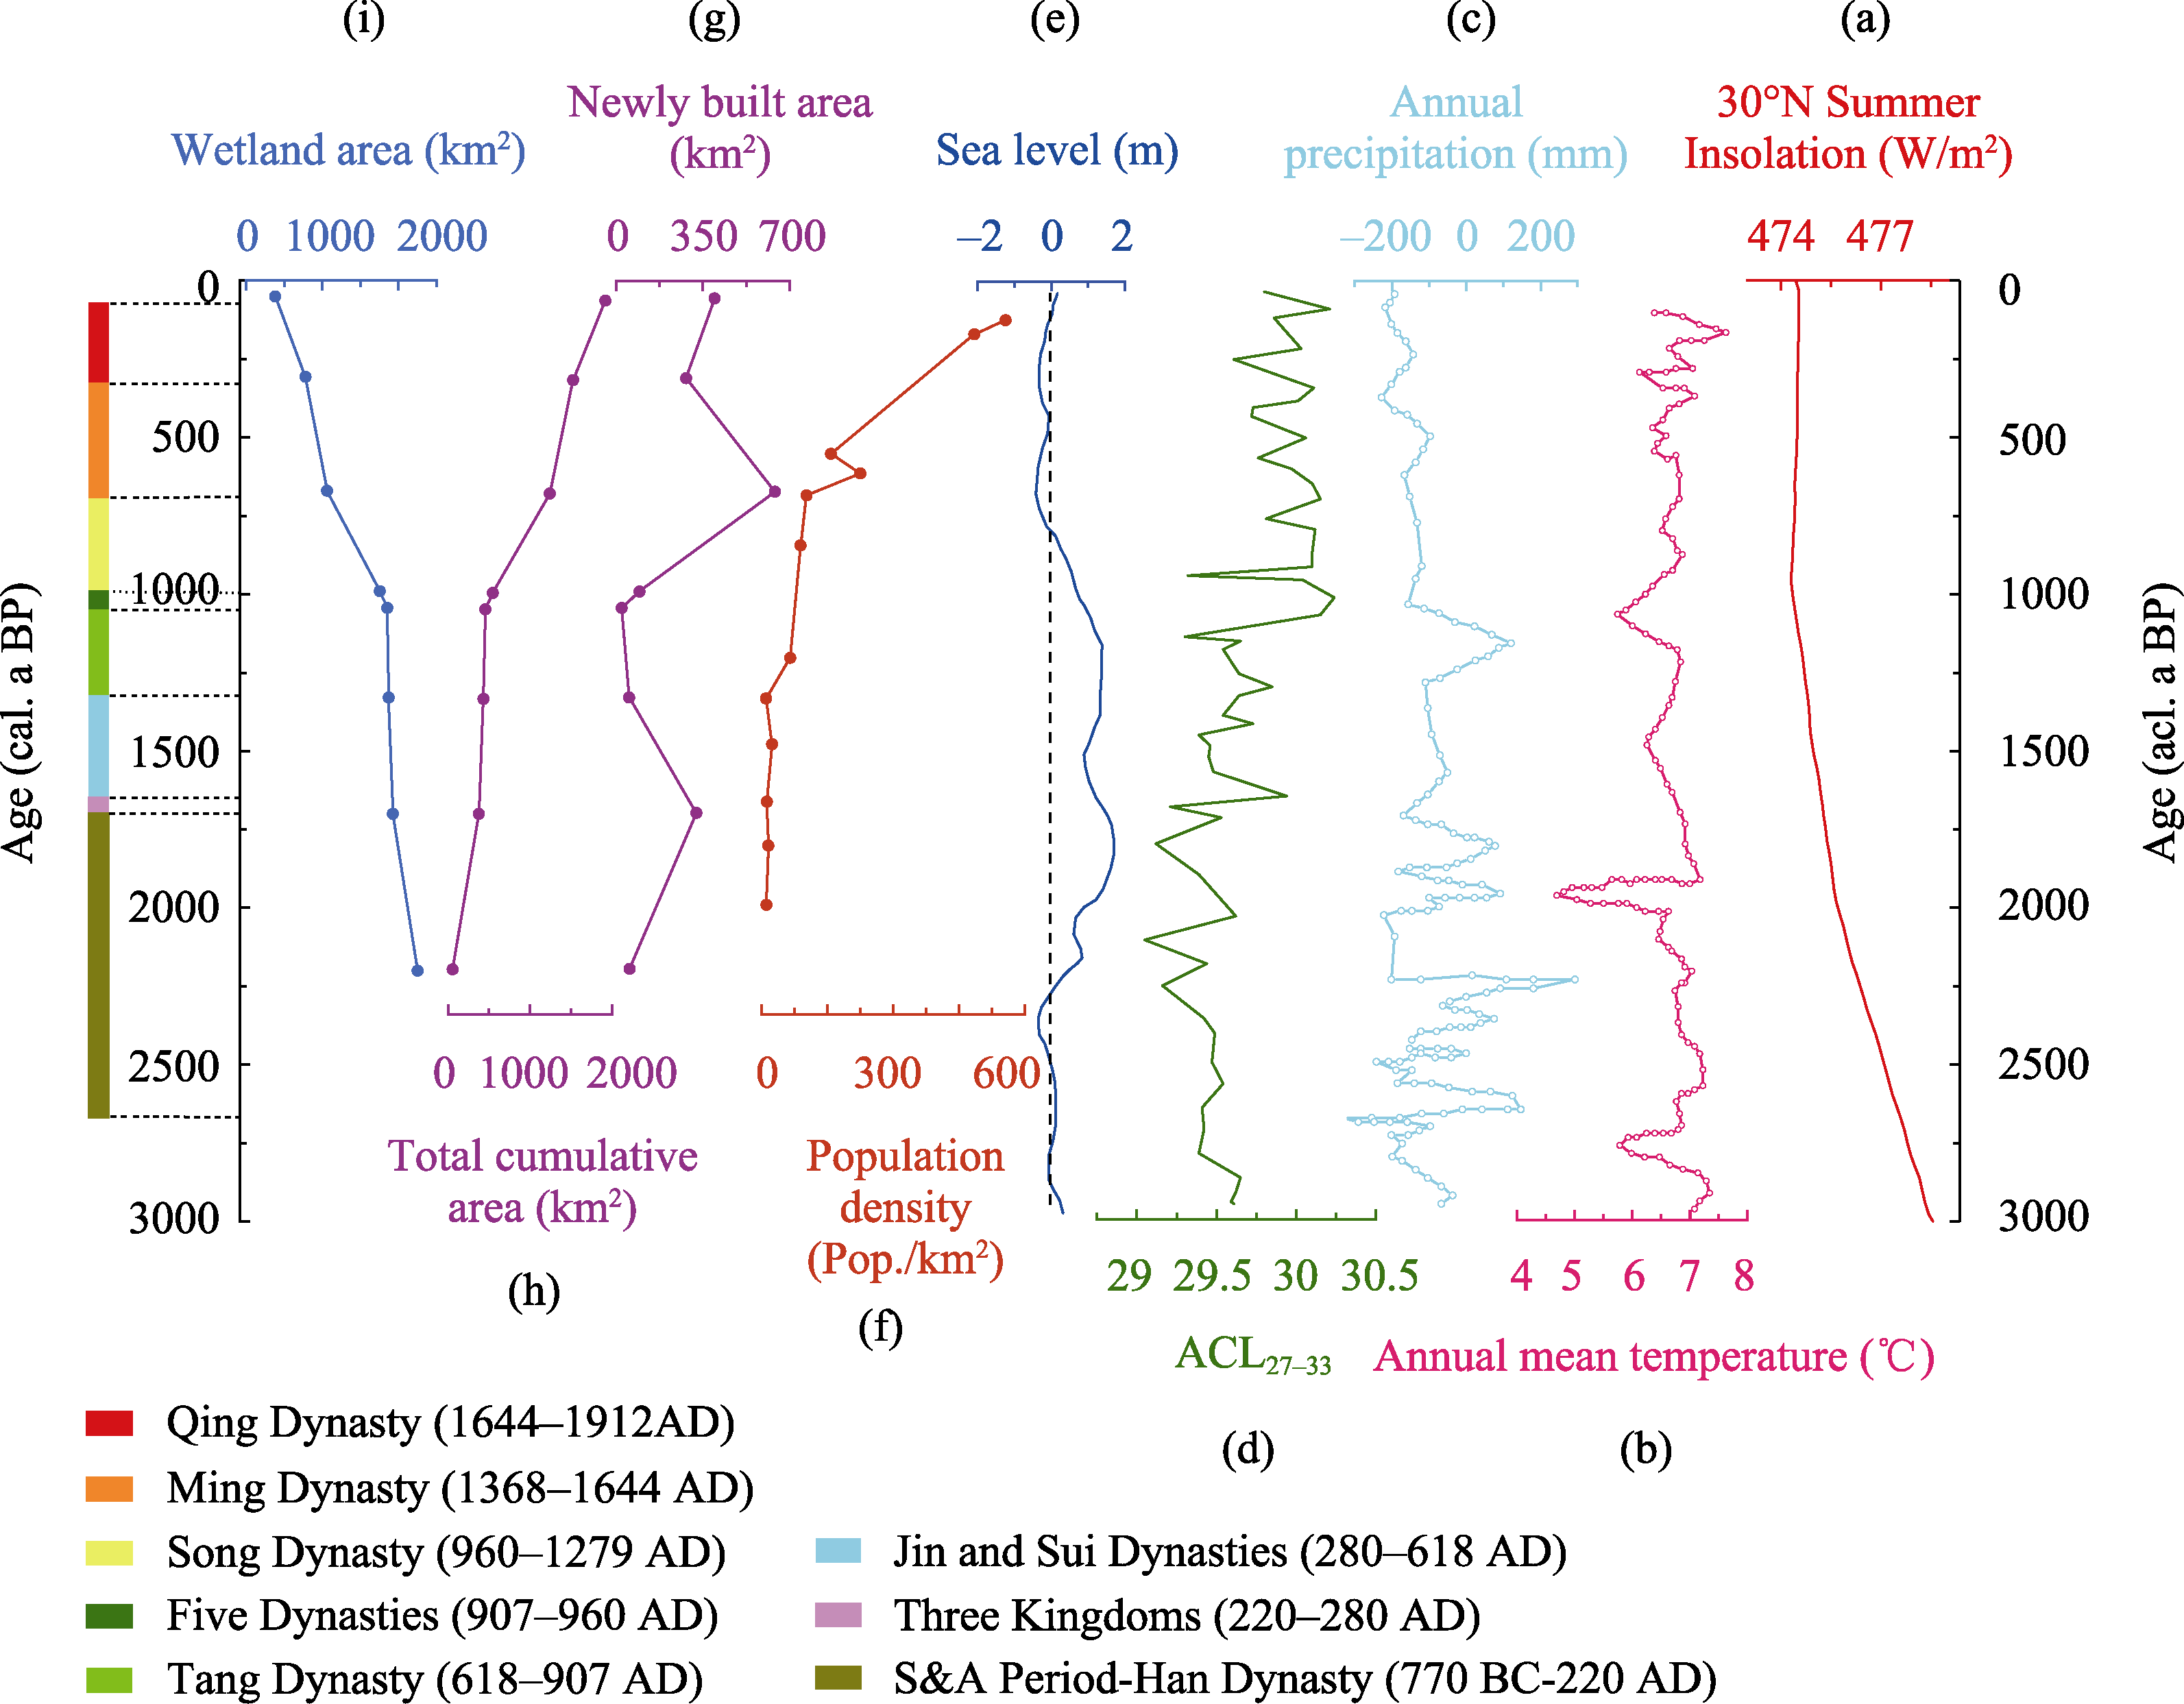
Figure 5
Dynamics on the formation and changes of polder landscapes. (a) Summer insolation at 30°N (W/m
2
) (Berger and Loutre,
1991
); (b) Annual mean temperature (°C) (Zhu et al.,
2008
); (c) Annual precipitation (mm) (Sun et al.,
2019
); (d) Average chain length value (Liu et al.,
2018
); (e) Sea level (m) (Xie et al.,
2012
); (f) Population density (Pop./km
2
) (Zheng,
2019
); (g) Newly built area (km
2
), (h) Total cumulative area (km
2
); and (i) Wetland area (km
2
).
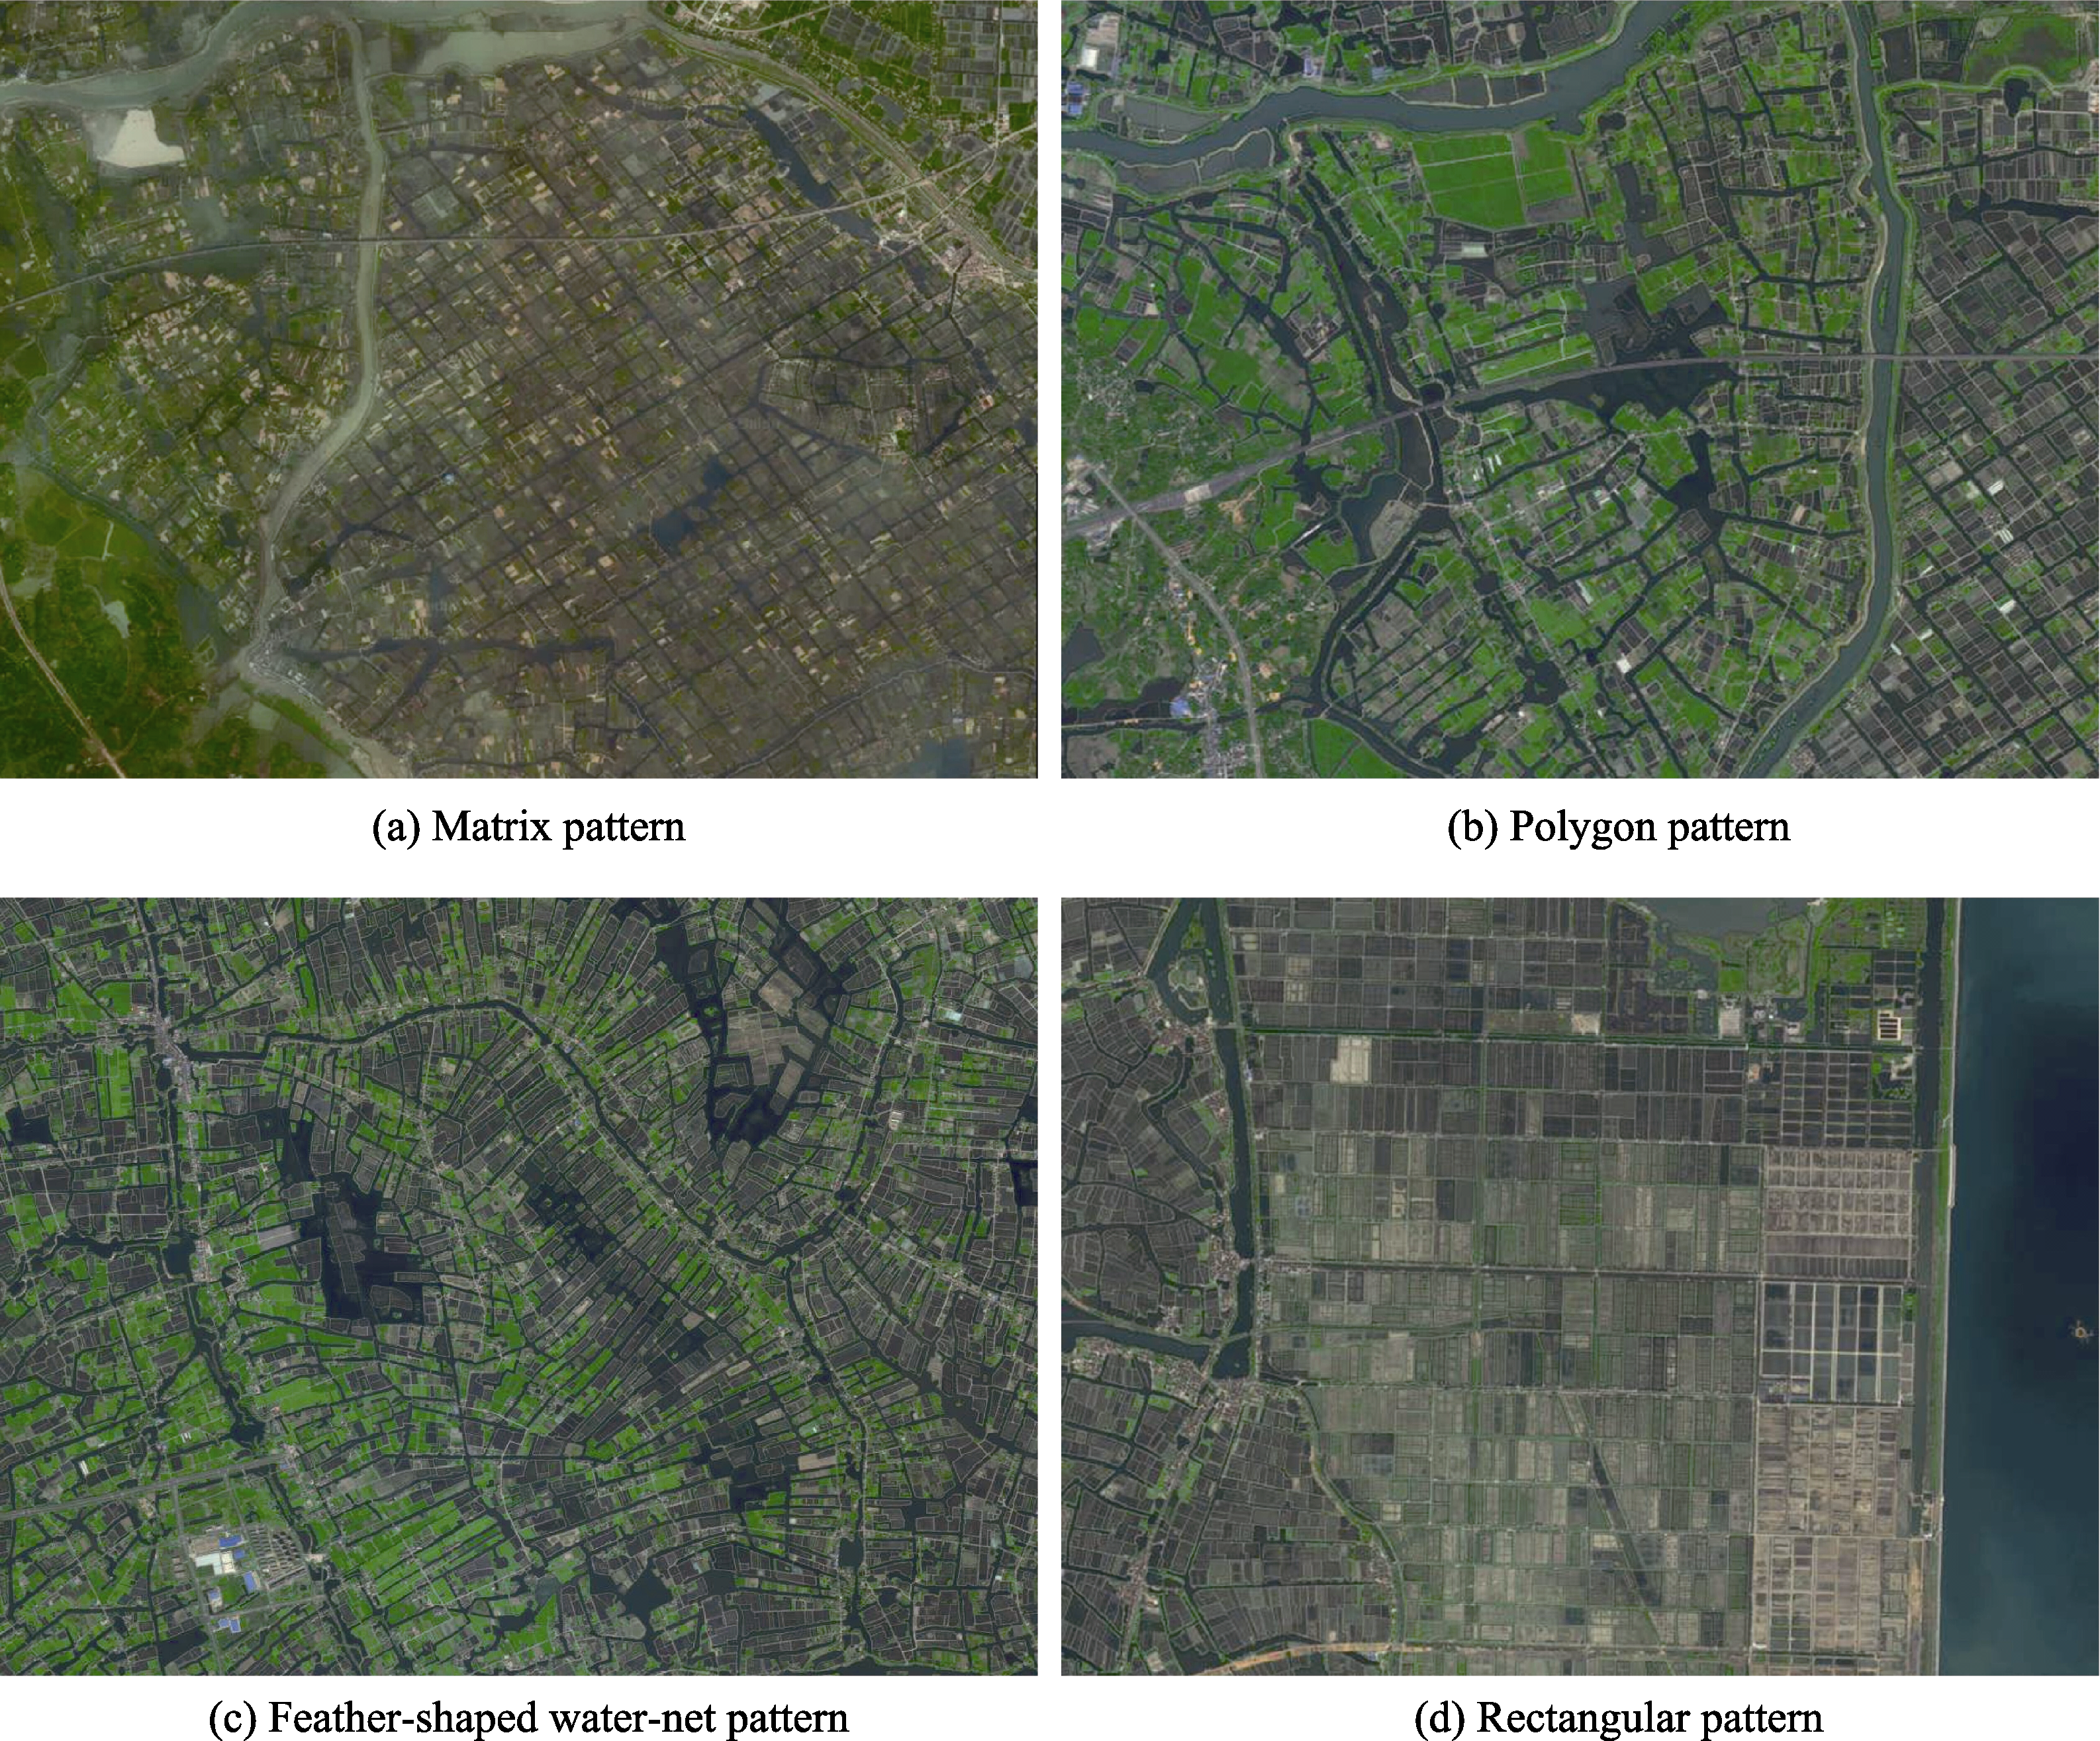
Figure 6
Images of different polder landscape patterns