
Journal of Geographical Sciences >
Urbanization has enhanced compound heatwaves
|
Sun Peng (1986-), PhD and Professor, specialized in natural hazard simulation and risk assessment. E-mail: sun68peng@163.com |
Received date: 2024-05-22
Accepted date: 2025-01-23
Online published: 2025-09-05
Supported by
National Natural Science Foundation of China(42271037)
Natural Science Foundation of Anhui Province(2408085MD095)
Key Research and Development Program Project of Anhui Province(2022m07020011)
University Synergy Innovation Program of Anhui Province(GXXT-2021-048)
Science Foundation for Excellent Young Scholars of Anhui(2108085Y13)
Under global warming, understanding the impact of urbanization on the characteristics of different heatwaves is important for sustainable development. In this study, we investigated the changes of heatwaves characteristics in the Yangtze River Delta urban agglomeration (YRDUG) and analyzed the influencing mechanisms of urbanization. Results showed that: (1) the duration, frequency, and intensity of NHWs (Nighttime Heatwaves) and CHWs (Daytime-nighttime compound Heatwaves) had shown a significant increase and the CHWs showed the greatest increasing trend. Furthermore, the NHWs exhibited higher durations, frequencies, and intensities compared to DHWs (Daytime Heatwaves); (2) Since 1990, the DHWs and CHWs were greater in urban areas than in rural areas, NHWs had been more pronounced in rural areas than in urban centers; and (3) Cloud cover, solar radiation, etc. affected heatwaves. Furthermore, in the process of urbanization, the increase in impervious area and the decrease in green land exacerbated heatwaves. Considering the combined effect of DHWs and NHWs, CHWs continued to increase.
SUN Peng , YU Shifang , YAO Rui , SUN Zhongbao , Vijay P. SINGH , BIAN Yaojin , GE Chenhao , ZHANG Qiang . Urbanization has enhanced compound heatwaves[J]. Journal of Geographical Sciences, 2025 , 35(5) : 1115 -1131 . DOI: 10.1007/s11442-025-2360-1
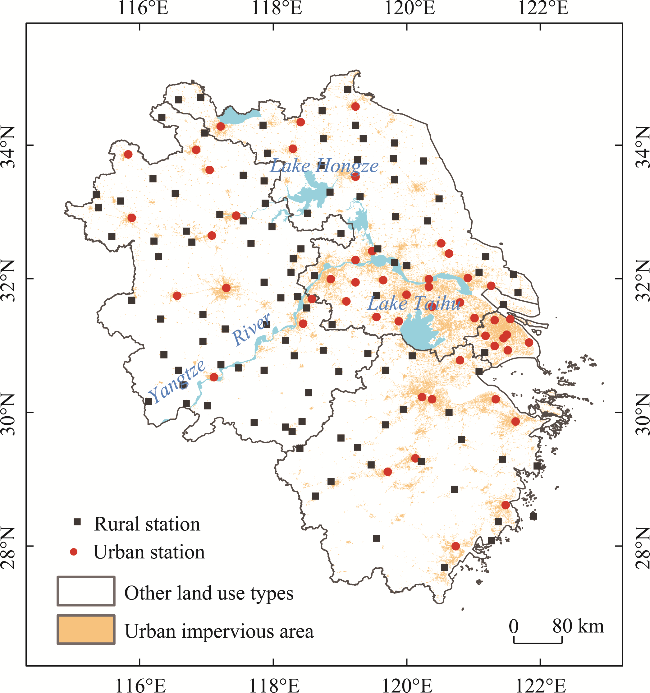
Figure 1 Location of meteorological stations in the Yangtze River Delta urban agglomeration |
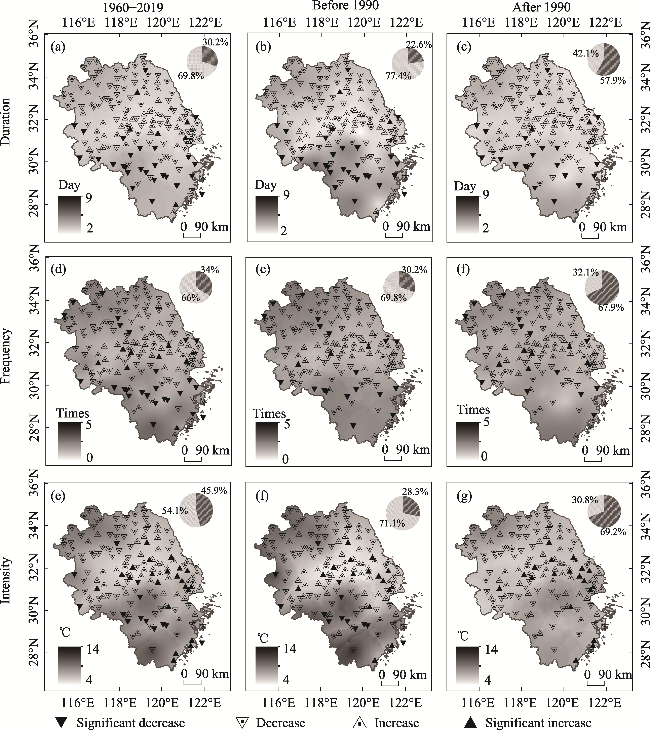
Figure 2 Spatial distribution of duration, frequency and intensity of daytime HWs. The left column represents the period 1960-2019, the middle column represents 1960-1990, and the right column represents 1991-2019. (Black indicates an increasing trend, and gray indicates a decreasing trend.) |
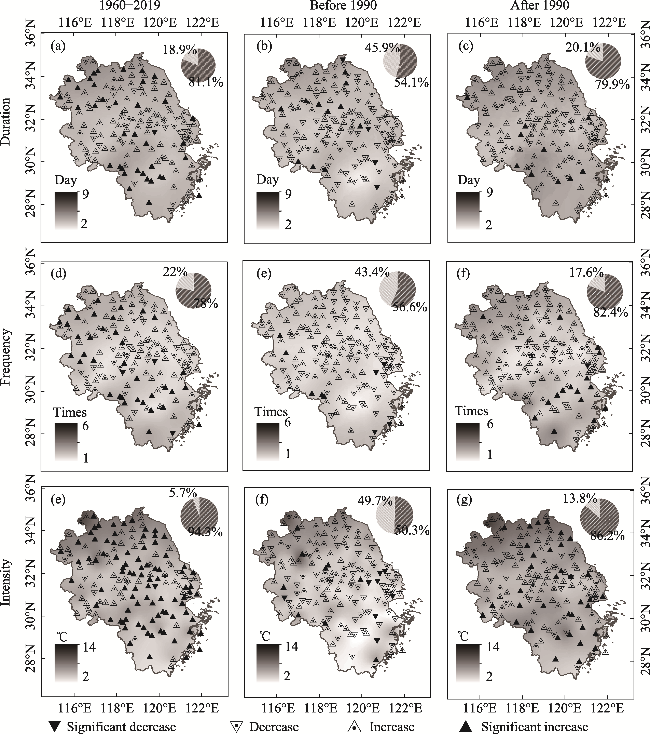
Figure 3 Spatial distribution of duration, frequency, and intensity of nighttime HWs. The left column represents the period 1960-2019, the middle column represents 1960-1990, and the right column represents 1991-2019. |
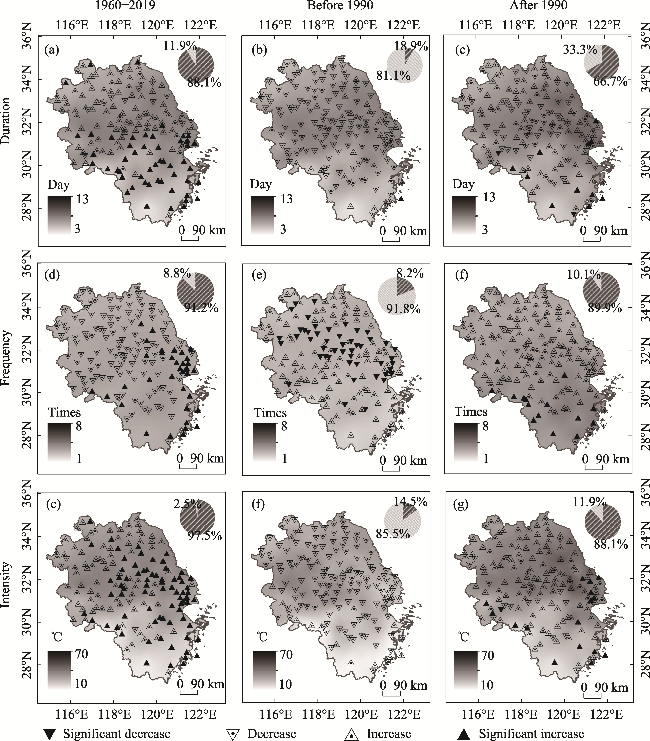
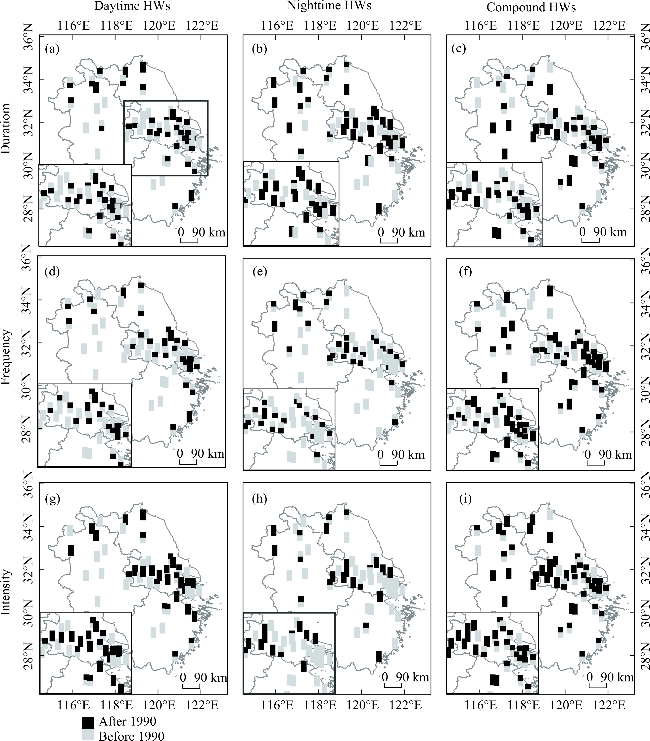
Figure 4 Spatial distribution of duration, frequency, and intensity of CHWs. The left column represents the period 1960-2019, the middle column represents 1960-1990, and the right column represents 1991-2019. |
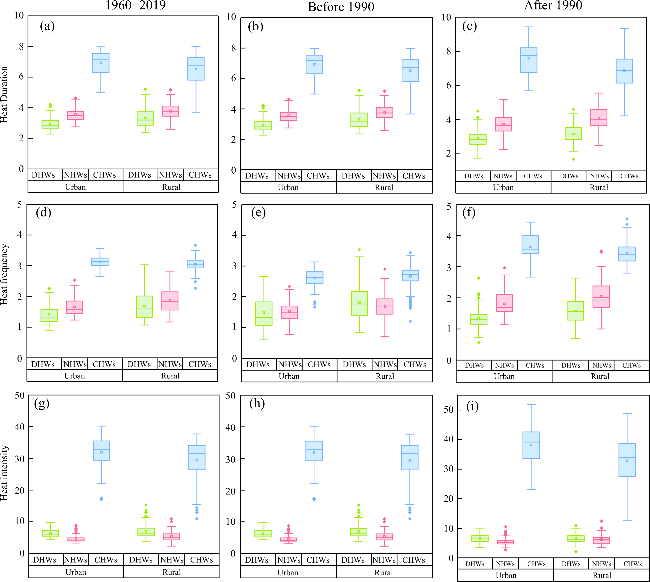
Figure 5 Boxplots of the average duration, frequency and intensity of DHWs, NHWs and CHWs in urban and corresponding rural stations |
Figure 6 Spatial analysis between urban and rural differences in the duration, frequency, and intensity of DHWs, NHW and CHWs (Black and gray represent positive and negative values, respectively. Urban_HWs-Rural_HWs =ΔT, the following paragraph shows the results before 1990 and the upper paragraph shows the results after 1990.) |
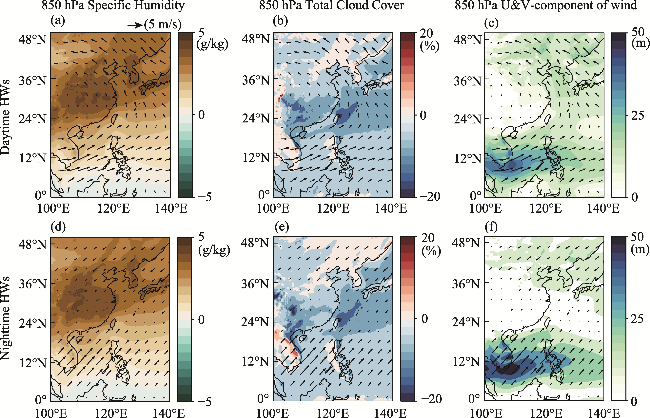
Figure 7 Specific Humidity, total cloud cover and geopotential height at 850 hPa in (a-c) maximum daily temperature occurrence in daytime and (d-f) minimum daily temperature occurrence in night during hot extreme heatwaves |
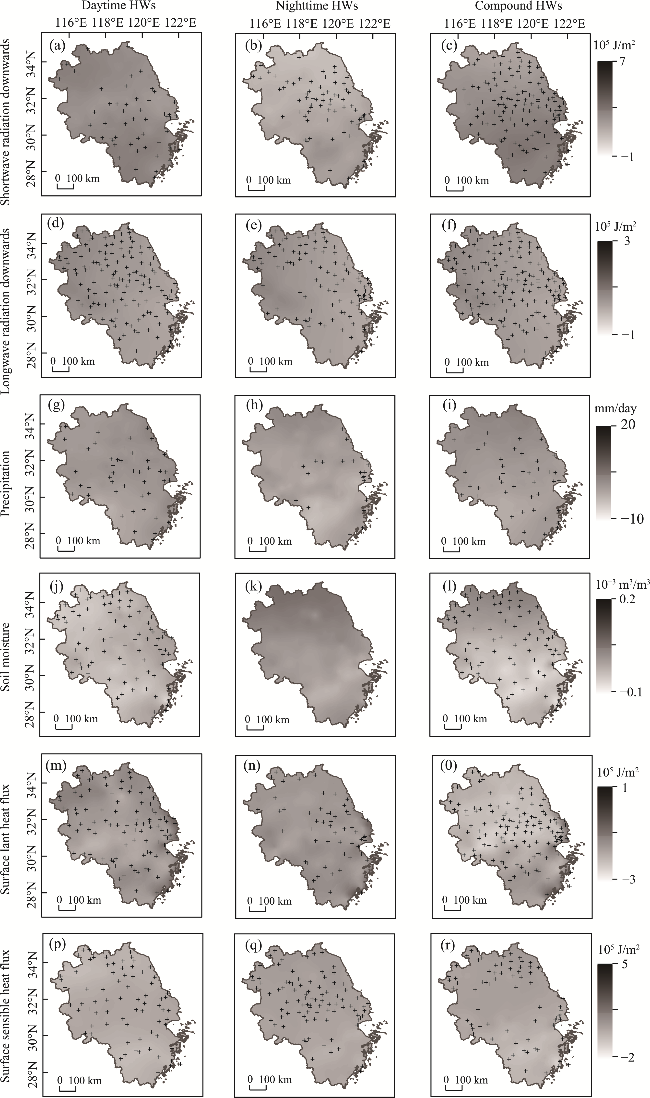
Figure 8 Changes in shortwave radiation downwards and longwave radiation downwards, precipitation and soil moisture, surface latent heat flux and surface sensible heat flux of different heatwaves. Composite maps of daily shortwave radiation downwards and longwave radiation downwards, precipitation and soil moisture, surface latent heat flux and surface sensible heat flux anomalies for DHWs (a, d, g, j, m, p), (b, e, h, k, n, q) and (c, f, i, l, o, r) as (a, d, g, j, m, p), but for anomalies for NHWs and CHWs, respectively. (The “+” indicates that it passes the 95% significance test.) |
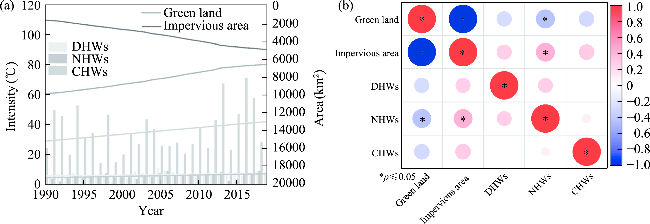
Figure 9 Changes of the impervious area and green land of the meteorological stations buffer zone and changes of different HWs intensity from 1990 to 2019 (a); their correlation (b) |
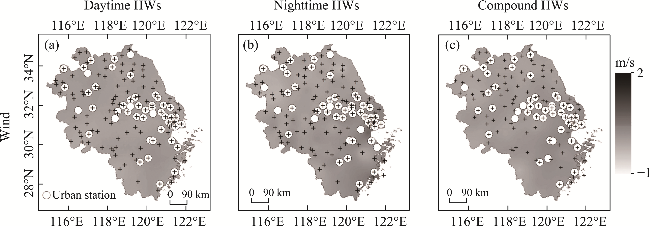
Figure 10 Wind changes of different heatwaves. Composite maps of daily wind anomalies for DHWs (a), (b) and (c) as (a), but for anomalies for NHWs and CHWs, respectively. (The “+” indicates that it passes the 95% significance test.) |
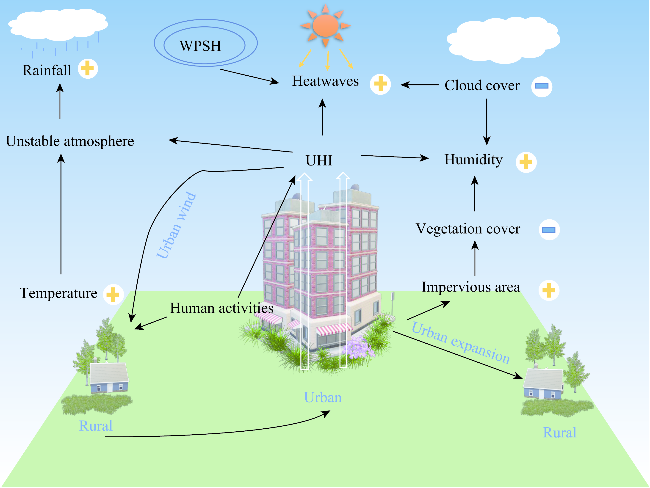
Figure 11 A schematic diagram of HWs between urban and rural areas. The blue minus sign indicates a decrease, and the red plus sign indicates an increase; Western Pacific Subtropical High (WPSH). |
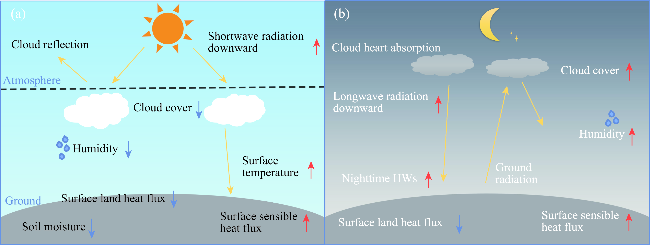
Figure 12 A schematic diagram for DHWs (a) and NHWs (b) (The blue downward arrow indicates decrease, and the red upward arrow indicates increase.) |
| [1] |
|
| [2] |
|
| [3] |
|
| [4] |
|
| [5] |
|
| [6] |
|
| [7] |
|
| [8] |
|
| [9] |
|
| [10] |
|
| [11] |
|
| [12] |
|
| [13] |
García-Herrera,
|
| [14] |
|
| [15] |
|
| [16] |
|
| [17] |
|
| [18] |
|
| [19] |
|
| [20] |
|
| [21] |
|
| [22] |
|
| [23] |
|
| [24] |
|
| [25] |
|
| [26] |
|
| [27] |
|
| [28] |
|
| [29] |
|
| [30] |
|
| [31] |
|
| [32] |
|
| [33] |
|
| [34] |
|
| [35] |
|
| [36] |
|
| [37] |
|
| [38] |
|
| [39] |
|
| [40] |
|
| [41] |
|
| [42] |
|
| [43] |
|
| [44] |
|
| [45] |
|
| [46] |
|
| [47] |
|
| [48] |
|
| [49] |
|
| [50] |
|
| [51] |
|
| [52] |
|
| [53] |
|
| [54] |
|
| [55] |
|
| [56] |
|
| [57] |
|
| [58] |
|
| [59] |
|
| [60] |
|
| [61] |
|
| [62] |
|
| [63] |
|
| [64] |
|
| [65] |
|
/
| 〈 |
|
〉 |