Special Issue: River Basin and Human Activity

Impact of land use intensity changes on ecosystem services in the Yellow River Basin, China

  • LI Nan , 1, 2 ,
  • SUN Piling , 1, 2, 3, * ,
  • ZHANG Jinye 1, 2 ,
  • SHEN Dandan 1 ,
  • QIAO Dingding 1 ,
  • LIU Qingguo 1
Expand
  • 1. School of Geography and Tourism, Qufu Normal University, Rizhao 276826, Shandong, China
  • 2. Rizhao Key Laboratory of Territory Spatial Planning and Ecological Construction, Rizhao 276826, Shandong, China
  • 3. College of Land Science and Technology, China Agricultural University, Beijing 100193, China
*Sun Piling (1984-), PhD and Associate Professor, specialized in ecological effect of land use changes, land use conflict and land use function. E-mail:

Li Nan (1999-), Master Candidate, specialized in the ecological effect of land use change and environmental economy. E-mail:

Received date: 2024-05-25

  Accepted date: 2025-01-17

  Online published: 2025-09-05

Supported by

National Natural Science Foundation of China(42101258)

Natural Science Foundation of Shandong Province(ZR2024MD073)

The Humanities and Social Sciences Youth Foundation, Ministry of Education(19YJCZH144)

Abstract

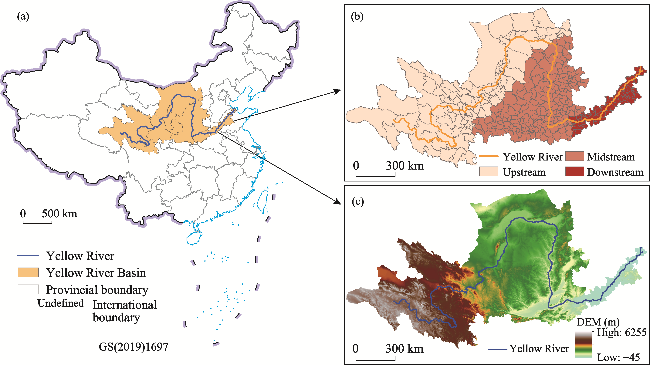
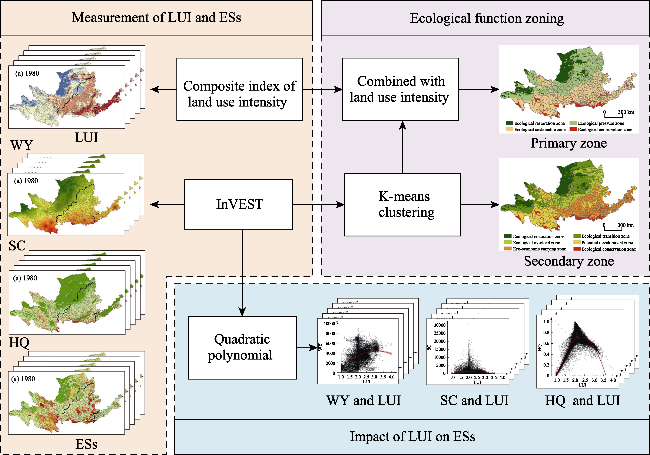
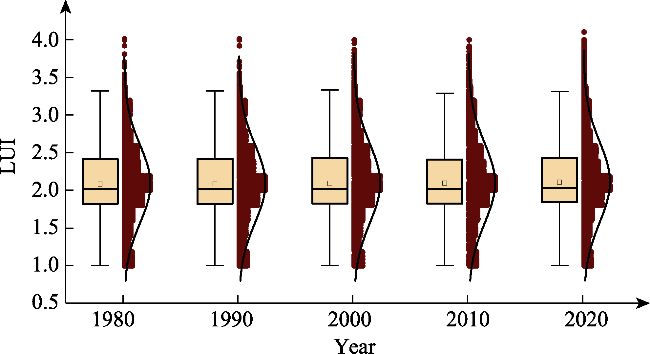
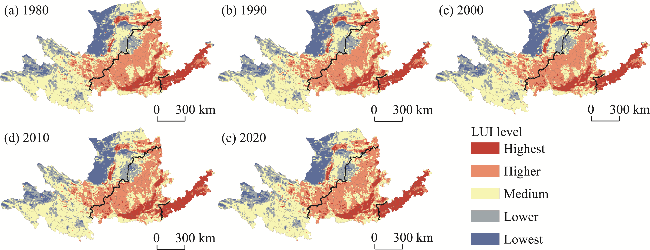
Land use sustainability is a pivotal concern in contemporary ecological protection efforts, necessitating a comprehensive understanding of the ramifications of changes in land use intensity (LUI) on ecosystem services (ESs). Although ecological control zoning typically emphasizes ES outcomes, it tends to overlook the impacts of human activity intensity. This research focuses on the Yellow River Basin and integrates various data sources, encompassing land use, meteorological, soil, and socioeconomic data from 1980 to 2020. Using the InVEST model, quadratic polynomial fitting, and cluster analysis, this work evaluates the spatiotemporal changes and zoning characteristics of LUI and three ESs—water yield, soil conservation, and habitat quality—to explore the influence of LUI changes on ESs. The results indicate that from 1980 to 2020, LUI shows a sustained increase with considerable spatial heterogeneity, gradually intensifying from upstream to downstream areas. The interannual variability of ESs is minimal, with substantial local fluctuations but overall minor changes. LUI correlates positively with ESs. Based on regional ESs, the Yellow River Basin is categorized into four primary ecological function zones: ecological restoration, ecological pressure, ecological sustainability, and ecological conservation. Considering LUI characteristics, this categorization is further refined into six secondary function zones: ecological restoration, ecological transition, ecological overload, potential development, eco-economic carrying, and ecological conservation. This study provides a scientific foundation for land use planning and ecological conservation policy formulation within the watershed area.

Cite this article

LI Nan , SUN Piling , ZHANG Jinye , SHEN Dandan , QIAO Dingding , LIU Qingguo . Impact of land use intensity changes on ecosystem services in the Yellow River Basin, China[J]. Journal of Geographical Sciences, 2025 , 35(5) : 1003 -1023 . DOI: 10.1007/s11442-025-2356-x

1 Introduction

Alterations in land use and cover change (LUCC) exert a substantial influence on the Earth’s surface systems, driving global environmental changes (Turner et al., 2007) and causing structural and functional transformations in ecosystem services (ESs). The United Nations Millennium Ecosystem Assessment (MA) reports that since the 1950s, human activities have had unprecedented and profound impacts on ESs, leading to the degradation of over 60% of the world’s ecosystems (MA, 2005; Carpenter et al., 2006). Global ecological security is under severe threat, with human activities being one of the main threats (Yang et al., 2023; Han et al., 2024). Large-scale industrialization, rapid urbanization, and intensive agricultural production have considerably affected the Earth’s ecosystem. LUCC serves as a critical means through which human activities affect the ecosystem, and its direction and rate considerably influence the extent of global ESs changes (Tuholske et al., 2017; Dai and Wang, 2020; Oertel et al., 2024). Understanding the relationship between LUCC and ESs is an urgent issue for attaining regional sustainable development goals. Therefore, a relationship analysis of land use intensity (LUI) and ESs is important for understanding the impact of human activities on ESs and guiding the rational allocation of land use.
Academic studies on the relationship between LUCC and ESs have yielded rich results. The research has centered on examining spatial and temporal changes (Li et al., 2017; Jiang et al., 2024) and trade-off synergies (Qiao et al., 2018), as well as simulation and response (Li et al., 2011; Shao et al., 2023). The impact of LUCC on ESs stems from changes in land use type, LUI, and land use diversity (Felipe-Lucia et al., 2020; Zheng et al., 2022). As the related studies advance, the correlation coefficient (Tian et al., 2022), geographically weighted regression (GWR; Mengue et al., 2020), sensitivity analysis (Yang et al., 2019), and the patch-generating land use simulation model (PLUS; Yang et al., 2022b; Zhao et al., 2024) have been gradually applied to provide new insights into the relationships between LUCC and ESs. The Yellow River Basin (YRB; Yuan et al., 2024), the Yangtze River Basin (Yu et al., 2024), coastal and lakeside areas (Bax et al., 2023; Yang et al., 2024), karst landforms (He, 2021; Qiu et al., 2021), and plateau mountainous areas (Quan et al., 2008) are hotspots for studying ESs and human activities. For instance, Cheng et al. (2024) argued that urbanization levels in the YRB have positive and negative impacts on Ecosystem Service Values (ESV). Yang et al. (2024) found that climatic factors primarily influence ESV at the source of the Yellow River. Tang et al. (2024) examined the influence of past and prospective land use and LUCC on habitat quality (HQ) in the Yellow River Delta region. Research perspectives vary from global to regional and local levels (Newbold et al., 2015), with research scales encompassing countries (Burke et al., 2023), regions (Duan et al., 2023), cities, counties (Liu et al., 2018), and grids (Peng et al., 2022; Huang et al., 2024). With the development of remote sensing technology, the analysis unit transforms from the administrative unit to a grid, from macroscale to microscale, and enables the detailed study of typical areas. However, considerable uncertainty remains about the intricate interplay between LUCC and ESs in typical watershed regions, characterized by marked variations in natural and socioeconomic conditions. This ambiguity has posed challenges in crafting policies aimed at the harmonious integration of land use practices with ecological preservation measures.
Modeling is used to evaluate ESs, and the Integrated Valuation of Ecosystem Services and Tradeoffs (InVEST) model is the most mature and common model (Jiang and Liu, 2024). The LUI measurement method includes the land use type assignment method and the comprehensive index method. In contrast, the assessment of human activities is more scientific. Some scholars have delineated ecological management zones by considering the interplay between supply and demand (Zhu et al., 2023), trade-off and synergy effects (Li et al., 2023b), the flow of ESs (Assis et al., 2023; Xiong and Mei, 2023), and clusters of ESs (Raudsepp-Hearne et al., 2010; Wang et al., 2023). For example, Xiong et al. (2023) delineated ecological management zones in Xinjiang based on the assessment of ESs supply and demand, as well as spatial flow. They developed a set of corresponding control measures tailored to each zone. Lin et al. (2021) suggested that the Three-River Headwater Region in the Qinghai-Tibet Plateau constitutes an ecologically critical area, considering the ESs flow. An ES bundle is a set where multiple ESs co-occur in time and space, revealing their interdependence. Some scholars conducted zoning studies combined with ES clusters. For example, Wang et al. (2023) delineated ecological function zones within the Four Lakes Basin based on ES clusters and ecological sensitivity and explored their dominant driving factors. Superposition analysis and cluster analysis are advanced methods for ES bundle identification (Zhang et al., 2022a). Relative to the simple spatial superposition, the clustering method can more systematically describe the interaction modes (Gou et al., 2021) between multiple ESs.
The YRB is an important ecological barrier and economic zone in China. The imbalance of economic development of counties (cities, districts, and banners) within the basin epitomizes the gaps between the eastern, central, and western regions of China. Studying the influence of LUI on ESs in the YRB can provide a reference for studying the relationships between human activities and ecosystems in similar regions and even across China. The traditional economy-driven and extensive development model has long neglected the significance of ecological protection (Guo et al., 2021), resulting in a fragile ecological environment, water pollution, soil erosion, and other pressing ecological issues. This has resulted in severe encroachment on ecological spaces, further intensifying the conflict between human activities and the environment (Zhao et al., 2023). Frequent land use and development activities are crucial for maintaining ESs supply (Huang et al., 2022; Zhang et al., 2022b). Intense human activities and climate change have led to ecosystem degradation in the YRB. The central government has emphasized the region’s ecological conservation and the promotion of high-quality development, elevating it to a pivotal national strategy. However, the YRB has long grappled with disharmony between environmental conservation and developmental pursuits (Feng et al., 2012). As ecological protection policies are implemented and regional development demands escalate, the structures and patterns of land use in the basin are constantly revised (Zhang et al., 2020). However, the impact of the whole YRB LUI on the ecological environment has received less attention. Existing studies often focus on the macro scale, typically lacking sufficient details in spatial information. Therefore, targeted research on the impact of LUI on ESs at the microscale is needed (Yang et al., 2022a). Grid-scale analysis of the changes in LUCC and ESs in the YRB is needed, to explore differentiated management pathways for ecological zoning. This work is aimed at quantitatively assessing the YRB’s LUI and ESs while exploring the relationship between them. Furthermore, the objective of this work is to zone the YRB based on the relationship between LUI and ESs at the grid scale. The aim is to provide support to policy-making bodies in the YRB in formulating policies that balance development and conservation efforts.

2 Materials and methods

2.1 Study area

The YRB, situated in the north of China (31°19'-42°11'N, 93°28'-118°09'E), spans an approximate area of 7.52 × 10⁵ km2. Comprising a total of 427 counties (cities, districts, and banners), this region spans nine provincial-level regions: Qinghai, Sichuan, Gansu, Ningxia, Inner Mongolia, Shaanxi, Shanxi, Henan, and Shandong (Figure 1). The study area considers the integrity of administrative units in the natural areas of the YRB and the spatial interrelation between land use and the ecological environment. The basin exhibits considerable climatic variations, with an annual average temperature of 9℃ and spatially diverse annual precipitation ranging from 200 mm to 600 mm. The terrain features a west-to-east high-low distribution, with elevations ranging from −45 m to 6255 m.
Figure 1 Location, river sections, and digital elevation map (DEM) of the Yellow River Basin (YRB; Map Review Number: GS2019 (1822))
Land use types are primarily grassland and cultivated land. In recent years, the continuous expansion of forest land and construction land caused by the policy of ecological farmland conversion and urbanization has impacted the original land use structure. The YRB serves as a crucial ecological barrier (Zhai et al., 2021), encompassing 12 national important ecological function zones. However, the fragile ecosystems and the negative effects of local human activities hinder their high-quality development. So, its economic level is still low. As of the year 2020, the YRB’s total population was 160 million, comprising 10% of the national total, with a GDP of about 98,743.95 billion yuan, or 10% of China’s overall GDP.

2.2 Data sources and processing

The research used various data sources, including meteorological data, topographic data, normalized difference vegetation index (NDVI), soil attribute data, land use data, etc. (Table 1). ArcGIS 10.4 software facilitated the cutting, geometric registration, and resampling of the acquired data.
Table 1 Main data types and sources
Data type Spatial resolution Data sources
Meteorological data 1 km × 1 km China Meteorological Science Data Sharing Service Network (http://cdc.cma.gov.cn/)
Digital elevation model (DEM) 30 m × 30 m Geospatial Data Cloud (http://www.gscloud.cn/)
Normalized Difference
Vegetation Index (NDVI)
1 km × 1 km Data Center for Resources and Environmental Sciences of
Chinese Academy of Sciences (https://www.resdc.cn/)
Soil attribute data 1 km × 1 km Big Data Center of Science in Cold and Arid Region (http://bdc.casnw.net/index.shtml)
Land use data 1 km × 1 km Resource and Environmental Science and Data Center of the Chinese Academy of Sciences (https://www.resdc.cn/)

2.3 Methods

The research framework is structured into three distinct components (Figure 2): (1) Measurement of LUI and ESs. The LUI was measured through the composite index of LUI, and the ESs were quantitatively calculated based on the InVEST model. (2) Impact of LUI on ESs. The impact of LUI on ESs was analyzed through quadratic polynomial fitting. (3) Ecological function zoning. This was achieved by integrating ESs and LUI, specifically, using K-means clustering to form primary ecological function zones based on ESs, followed by the designation of second-level zones considering the LUI levels. This framework facilitated the analysis of the impact of human activities on the ecological environment, providing theoretical underpinnings for the formulation of ecological protection policies and zoned management.
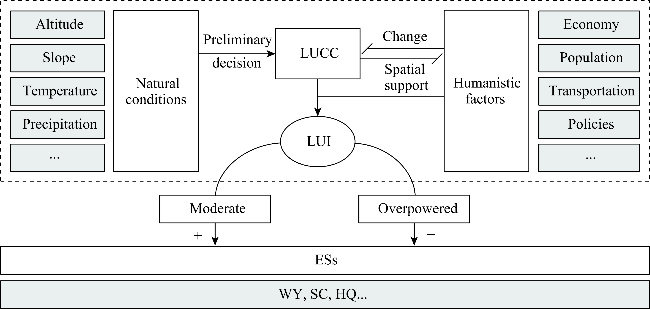
Figure 2 The research framework

2.3.1 Measurement of land use intensity

LUI mirrors the influence of human interventions on the natural ecosystem. To better reflect the overall degree of land use and the interference degree of human activities, the assignment method and the night light index were combined with the measured LUI. Farmland LUI with a higher night light index grade was corrected. Referring to previous research findings, the LUI levels for various land use categories were categorized as follows: unused land (unused or difficult land); forest, grass, and water land (woodland, grassland, waters); agricultural land (cultivated land, garden plot); and urban settlement land (urban and rural, industrial and mining, residential land). The classification index for land use degree was assigned values of 1, 2, 3, and 4 sequentially (Zeng et al., 2022). The formula used for this classification was as follows:
$LUI=\sum\limits_{j=1}^{m}{{{A}_{j}}\times ({{S}_{j}}/S)}$
where LUI represents the composite index of land use intensity. Aj represents the grading index of use intensity for a specific land use type in LUI level j. Sj represents the extent of land use within level j. S denotes the total area within the study area, and m pertains to the scale of LUI.

2.3.2 Ecosystem services calculation

The Yellow River is the main water source for industrial and agricultural production and human life in the river basin and is the key element to maintain the balance and stability of the whole ecosystem. High-quality soil plays a key role in the survival of organisms in the river basin, but due to the dual influences of the natural environment and human activities in the YRB, soil erosion and desertification are serious challenges. The Loess Plateau in the middle reaches has some of the most serious soil erosion in the world. The natural environment of the YRB is complex and diverse, which make it a key area of biodiversity protection. Therefore, due to the importance of protecting water, soil, and biological resources in the YRB, and considering the needs for ecological environment governance and sustainable development in the YRB, the three key ESs of water yield (WY), soil conservation (SC), and HQ were selected for evaluation (Table 2).
Table 2 Calculation formula of ecosystem services (ESs)
Ecosystem
services (ESs)
Calculation formula Meaning of each index
Water yield
(WY)
$Y\left( x \right)=\left( 1-AET\left( x \right)/P\left( x \right) \right)\times P\left( x \right)$ Y(x) indicates the average annual water production depth for grid x; AET(x) denotes the actual annual evapotranspiration in grid x; P(x) is the average yearly precipitation recorded in grid x.
Soil conservation
(SC)
$SEDRE{{T}_{x}}=RKL{{S}_{x}}-USL{{E}_{x}}$
$USL{{E}_{x}}={{R}_{x}}\times {{K}_{x}}\times L{{S}_{x}}\times {{C}_{x}}\times {{P}_{x}}$
SEDRETx represents the SC within grid cell x, RKLSx is the potential erosion of grid cell x, USLEx is the actual soil erosion occurring in grid unit x, Rx signifies the precipitation erosion force factor, Kx denotes the soil erosion factor, LSx represents the slope length factor, Cx reflects the vegetation management factor, and Px accounts for the soil and water conservation measures.
Habitat quality
(HQ)
${{Q}_{xj}}={{H}_{j}}[1-D_{xj}^{z}/(D_{xj}^{z}+{{k}^{z}})]$ The HQ of a ground grid cell x in location j is represented by Qxj, with values in the range [0-1], Hj signifies the habitat suitability for ground j, Dzxj captures the habitat degradation of j ground grid cell x, the half-saturation parameter is
denoted by k, and z represents the normalization constant.

2.3.3 Impact of land use intensity on ecosystem services

The quadratic polynomial function of Origin 2021 software was used to fit the interrelationships between ESs and LUI across different periods. In this equation, (x, y) represents the plane coordinates of the grid, and the quadratic polynomial function expression is as follows:
$y=f(x)={{a}_{0}}+{{a}_{1}}x+{{a}_{2}}{{x}^{2}}$
where y is ES, x represents LUI, and ai (i = 1, 2, 3) is the undetermined coefficient, which can be obtained by least squares regression.

2.3.4 Ecosystem services functional partition

K-means clustering was employed to evaluate the similarity of each class based on Euclidean distance and to identify grid combinations of similar ESs. The equations used are expressed as follows:
$d({{x}_{i}},{{x}_{j}})={{\left[ \sum\limits_{r=1}^{p}{|{{x}_{ir}}-{{x}_{jr}}{{|}^{2}}} \right]}^{\frac{1}{2}}}$
$C(l)=\arg {{\min }_{1\le l\le K}}d({{x}_{i}},{{v}_{l}}),i=1,2,...,N$
${{v}_{l}}=\arg {{\min }_{v}}\sum\limits_{i\in {{C}_{l}}}{d({{x}_{i}},v),i=1,2,...,N}$
where d(xi, xj) represents the Euclidean distance between the samples, xi signifies the i-th sample and xr denotes the r-th feature parameter pertaining to the i-th sample. The notation C(l) stands for the collection of samples belonging to the l-th class, and vl represents the centroid of the l-th class.

3 Results

3.1 Spatiotemporal variation of land use intensity

The LUI of the YRB was assessed for the period 1980-2020 using the land use composite index (Figure 3). Over this period, the average LUI in the YRB increased from 2.084 in 1980 to 2.109 in 2020, reflecting a 1.20% growth. The growth trends in LUI correlate with different stages of economic development in China. During the period between 1980 and 2020, the median of LUI in the YRB remained steady at 2.02, signifying a moderate level of intensity. Notably, the upper extreme value of LUI displayed a rising trend, while the lower extreme value was stable, suggesting continuous improvement in the LUI of certain high value areas. The upper quartile line remained at 2.42, while the lower quartile line stabilized at approximately 1.83, with 50% of the regional LUI falling within the 2.42 and 1.82 range. The land in question is moderately used, fully developed, and retains potential for further development or improvement. An examination of the normal distribution curves from 1980 to 2020 indicates that LUI values in the YRB were concentrated around the median, demonstrating minimal variation in LUI between each period and a skewed overall distribution. Furthermore, the proportion of high LUI values is relatively high. Owing to the unique ecological characteristics of the YRB, a sizable number of areas exhibit LUI levels around 2.00.
Figure 3 Changes in land use intensity (LUI) in the Yellow River Basin (YRB) from 1980 to 2020
The natural breakpoint method was used for the classification of LUI in the YRB (Figure 4). The results demonstrated notable spatial heterogeneity from 1980 to 2020, with intensity gradually increasing from upstream to downstream. The highest intensity levels were centered at the intersection of Shaanxi, Shanxi, Henan, and Shandong, and were also scattered in the Ningxia Plain and the Hetao Plain. These regions are characterized by flat terrain, ample water sources, less challenging land development and use, high population density, rapid economic and urban development, and a substantial demand for construction land. Higher intensity levels were distributed in a band through in the middle reaches, encompassing the intersection of Shaanxi, Gansu, and Ningxia, as well as northern Shaanxi and western Inner Mongolia. Medium intensity levels were found on the periphery of the Qinghai-Tibet Plateau and in the low-lying region north of the Ordos Plateau and Yinshan Mountains. Areas with the lowest intensity were in the Kunlun Mountains, in the desert environment around the bend of the Yellow River, and in its estuaries. Geographical constraints, severe climatic conditions, water scarcity, and the need for ecological protection have resulted in limited land use capacity and development potential in these areas, reflected in their low LUI.
Figure 4 Spatiotemporal distribution of land use intensity (LUI) in the Yellow River Basin (YRB) from 1980 to 2020

3.2 Spatiotemporal variations of ecosystem services

Using the InVEST model, the spatial distribution of the three key ESs in the YRB was examined across the 1980-2020 period (Figures 5-7). Among these, the interannual variation trend of WY was relatively stable, with a spatial pattern characterized by elevated values in the southern and eastern regions, in contrast to lower values in the northern and western areas. High value regions were situated around Anemaqen Mountain, Qinling Mountains, and Mount Tai, characterized by steep terrain gradients conducive to water flow and accumulation, abundant vegetation cover, strong water retention capabilities, and high WY. Medium-value areas were concentrated in the Loess Plateau, featuring relatively high precipitation, undulating terrain, and various vegetation types such as grassland and shrubs. Low value areas were concentrated in Dulan county of Qinghai, the northern section of Ningxia, and Inner Mongolia. Throughout the study period, as global temperatures increased and regional precipitation patterns shifted, WY decreased due to the irrational exploitation of water resources and the detrimental effects of human interventions on the ecological environment. However, there was a slight increase in WY attributed to ecosystem restoration and protection.
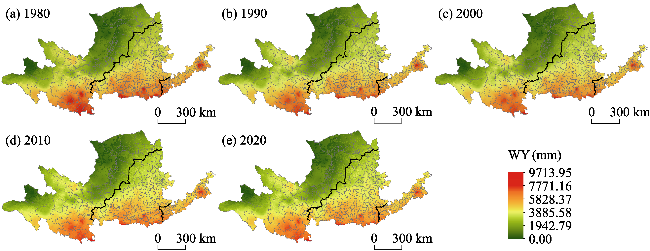
Figure 5 Spatiotemporal distribution of water yield (WY) in the Yellow River Basin (YRB) from 1980 to 2020
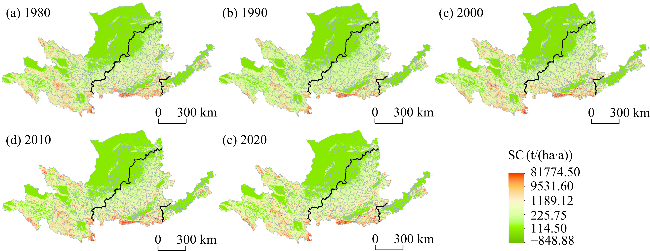
Figure 6 Spatiotemporal distribution of soil conservation (SC) in the Yellow River Basin (YRB) from 1980 to 2020
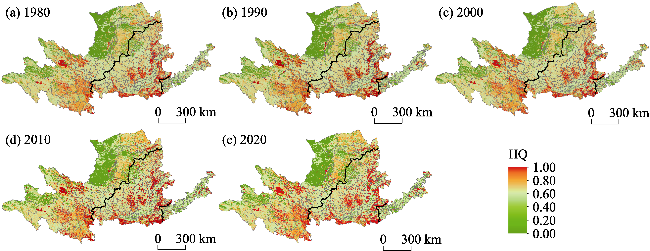
Figure 7 Spatiotemporal distribution of habitat quality (HQ) in the Yellow River Basin (YRB) from 1980 to 2020
From 1980 to 2020, the interannual variation in SC in the YRB has been minimal. The area with low SC values was significantly larger than that with high SC values, creating a pattern with higher values in the south and west, and comparatively lower values in the north and east. Regions exhibiting high SC were distributed in the Qilian Mountain, as well as the eastern sections of the Kunlun Mountains, Min Mountains, Qinling Mountains, and the downstream hills. This is due to the complex topography, abundant vegetation cover, and high-altitude climatic conditions prevalent in these regions. Regions with the highest value were situated in proximity to those areas that exhibited higher value regions. Areas with low SC values were concentrated in the Loess Plateau including the Inner Mongolia Plateau, the Fenwei Basin, and the North China Plain. These areas have uneven precipitation distributions, relatively poor vegetation conditions, and experienced excessive grazing.
From 1980 to 2020, there was high interannual similarity in HQ of the YRB, showing obvious spatial heterogeneity and a distribution pattern of higher values in the south and lower values in the north. Regions of higher value HQ consist of the upstream lakes, the margins of the Qinghai-Tibet Plateau, and the mountains to the north of the Weihe River valley, as well as the Qinling, Lvliang, and Taihang mountains. These areas have diverse habitats and rich species compositions, with less human disturbance. The highest value areas include the Qinghai-Tibet Plateau, the plains north of the Yinshan Mountains, and the Ordos Plateau. Regions with medium value HQ were focused in the Hetao Plain, the southern regions of the Great Wall (in Shaanxi), the Fenwei Plain, and the North China Plain. Despite the relatively favorable natural conditions of these areas, they also have concentrated industrial and agricultural activities, face considerable land use pressure, and experience high levels of human activity interference. The regions exhibiting comparatively low value HQ were situated in the Ningxia Plain. The lowest values were recorded in the mountainous regions of Qinghai, the deserts within Inner Mongolia, and the Yellow River estuary in Shandong. The unique landforms in these areas limit ecosystem development, resulting in low HQ levels.

3.3 Impact of land use intensity on ecosystem services

Scatter plots of LUI and ESs values for the grids within the study area were fitted using the quadratic polynomial function (Figure 8). The scatter plot distribution patterns of LUI and ESs in the YRB from 1980 to 2020 were roughly similar, with minimal differences between periods. LUI exhibited a general positive correlation with WY (Figure 8a). As land use intensity increased, WY gradually rose, peaking at LUI = 3.0. Beyond this point, WY slightly declined with further increases in LUI, indicating relatively high WY in arable and orchard lands. Extensive irrigation agriculture, facilitated by Yellow River diversion, has enhanced water use efficiency and positively impacted WY. As LUI increased, SC initially rose and then declined (Figure 8b). SC peaked at LUI = 2.1, highlighting the major contributions of forests, grasslands, and water bodies to SC. LUI and HQ exhibited an inverse U-shaped relationship, with HQ reaching its highest level at an LUI of approximately 2.3 (Figure 8c). This indicates that moderate human interventions in ecosystems enhances HQ, while areas with scarce natural resources and minimal human activity maintain low LUI and HQ levels. However, excessive human activity leads to HQ degradation.
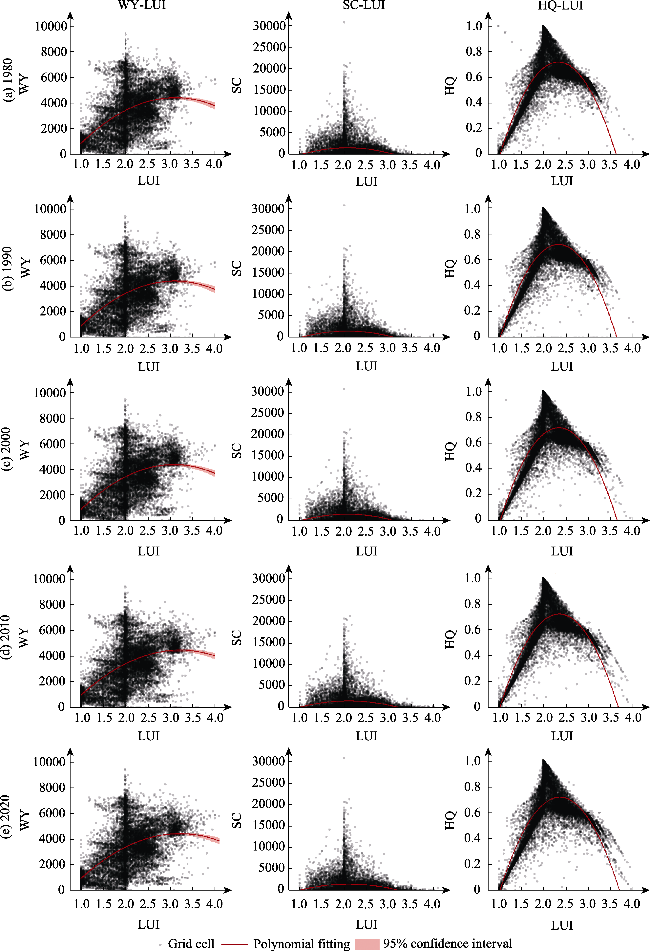
Figure 8 Land use intensity (LUI) and ecosystem services (ESs) in the Yellow River Basin (YRB) from 1980 to 2020 (a. Water yield; b. soil conservation; c. habitat quality)

3.4 Ecological function zoning of the Yellow River Basin

K-means clustering was performed on the average values of the three key ESs in the YRB from 1980 to 2020. The number of clusters for the ESs was determined by the error sum of squares (SSE) (Figure 9). Upon setting the number of clusters to four, the within-cluster SSE curve showed an obvious inflection point. Therefore, the YRB was segmented into four distinct clustering zones, and the significance test confirmed the validity of the clustering results. To further analyze the differences between the clusters of ESs, the data were standardized to have an average value of 0 for each ES. A mean value greater than 0 within an ES cluster indicates that the corresponding ES is higher than the regional average, and vice versa. Based on this, the YRB can be divided into four different clusters of ESs, each with specific ES characteristics. Among them, Cluster 1 had the lowest WY (−1.183), SC (−0.398), and HQ (−1.858), all below the regional average level. In Cluster 2, although its HQ (0.983) was slightly higher than the regional average, WY (−0.633) and SC (−0.418) were below the regional average. Cluster 3 had SC (0.061) close to the regional average level, while WY (0.764) and HQ (0.443) were above the regional average. Cluster 4 had the highest ES values, with SC (3.057) well above the regional average, while WY (1.343) and HQ (1.043) were also at relatively high levels.
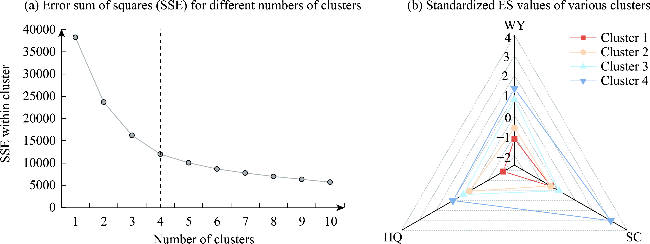
Figure 9 Classification results of ecosystem services (ESs) clusters in the Yellow River Basin (YRB)
Based on the clustering outcomes of ES clusters and existing research (Zhou et al., 2023), the YRB is divided into four primary ecological function zones: ecological restoration, ecological pressure, ecological sustainability, and ecological conservation (Figure 10). The area designated for ecological restoration encompasses the Qaidam Basin in Qinghai, the southern mountainous areas, and the desert areas within Inner Mongolia (such as the Ulan Buh and Tengger deserts, the Kubuqi desert, and the Mu Us Sandy Land). This zone has low annual precipitation and poor soil quality, making it extremely fragile in its natural state. The ecological pressure zone is the transitional area between the ecological restoration zone and the ecological sustainability zone. It is focused on the northern Loess Plateau and the southern Inner Mongolia Plateau. This zone is severely affected by soil erosion and faces the risk of forest and grassland degradation. The ecological sustainability zone is positioned along the eastern border of the Qinghai-Tibet Plateau, encompassing the middle to lower sections of the Yellow River Plain. It has better resources and environmental conditions and a rich biodiversity. The ecological conservation zone is scattered along the edges of the Bayankala Mountains and the Qinling Mountains. It has excellent natural conditions and abundant ecological resources.
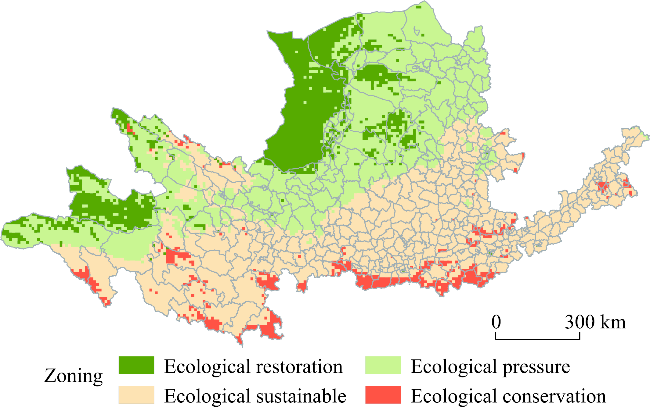
Figure 10 Primary ecological function zoning of the Yellow River Basin (YRB)
Incorporating ES clustering and the distinct features of LUI (Figures 4 and 9), the YRB was divided into six secondary ecological function zones: ecological restoration, ecological transition, ecological overload, potential development, eco-economic carrying, and ecological conservation (Figure 11 and Table 3). The ecological pressure zone includes the ecological transition zone and the ecological overload zone, while the ecological conservation zone was divided into the potential development zone and the eco-economic carrying zone. Within the ecological pressure zone, areas with lower LUI levels were classified as the ecological transition zone, located in the eastern section of the Bayan Har Mountains, the southern periphery of the Qilian Mountains, the Yinshan Mountains, and the Ordos Plateau. Areas with higher LUI levels were classified as the ecological overload zone, distributed in the Hetao Plain and the Loess Plateau. In this zone the fragility of the ecological environment contrasts with the high intensity of human activity. Within the ecological sustainability zone, areas with low LUI were classified as the potential development zone, concentrated in the eastern border of the Qinghai-Tibet Plateau and the central part of the Loess Plateau, such as the Ziwuling area. This area has abundant ecological resources, with relatively low human activity intensity and high development potential. However, due to its geography, economic development in this area is hindered. Areas with high LUI were classified as the economic carrying zone, located in the Fenwei Valley and the downstream plain along the river. These areas have favorable natural conditions and a robust capacity to support resources and the environment, making them the main economic activity areas within the basin.
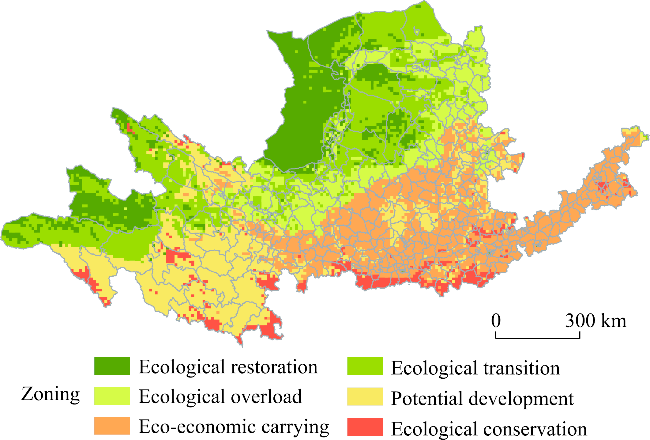
Figure 11 Secondary ecological function zoning of the Yellow River Basin (YRB)
Table 3 Ecological function zoning of the Yellow River Basin (YRB)
Primary zone Secondary zone Ecosystem services (ESs) cluster Land use intensity (LUI) Proportion (%) Zoning characteristics
Ecological restoration zone Ecological restoration zone Cluster 1 All levels of
intensity
15.49 Widespread, high, cold grasslands and deserts, with a poor natural environment and minimal human activity, resulting in the weakest levels
of ES functionality.
Ecological pressure
zone
Ecological transition zone Cluster 2 Lowest intensity
Lower intensity
Medium intensity
22.53 The ecological environment is fragile and is distributed around ecologically restored areas, exhibiting obvious transitional characteristics. The functionalities of ESs and LUI ware low.
Ecological overload zone Highest intensity
Higher intensity
13.07 In regions with less precipitation and concentrated dry area agriculture, the functionalities
of ESs were weak and the LUI was high.
Ecological sustainable zone Potential development zone Cluster 3 Lowest intensity
Lower intensity
Medium intensity
20.45 The region includes ecologically favorable mountainous areas with minimal human activity, where ESs functions were strong and the LUI was low.
Eco-economic carrying zone Highest intensity
Higher intensity
22.44 The middle to lower sections of the Yellow
River Plain have favorable natural conditions, with concentrated human activities. The ESs functions and the LUI were high.
Ecological conservation zone Ecological conservation zone Cluster 4 All levels of
intensity
6.03 The mountains with the most favorable
ecological environment have minimal
development activities, resulting in the
strongest ESs functions.

4 Discussion

4.1 Ecosystem services influencing factors

The YRB, a critical ecological barrier in China, plays a crucial role in maintaining ecological stability. Considerable natural variations and prominent ecological issues exist within the basin, with human activities exerting substantial impacts on the natural environment. The spatial distribution of ESs in the YRB shows higher values located in the southern region and lower values in the northern area, influenced by natural and human factors (Chen et al., 2022; Hu et al., 2023). These factors include natural conditions, location, socioeconomic conditions, and policies, constituting a multilayered process driven by the interconnectedness of these diverse factors (Yu et al., 2024). Among these factors, natural conditions such as temperature and precipitation are stable and determine the ES spatial patterns. Socioeconomic and policy factors affect the characteristics of ES changes. Existing studies have found that natural factors play a dominant role in areas with poor suitability for human activities (Yu et al., 2024). Human activities, including urban expansion, farmland cultivation, and ecological land restoration, are the primary influences on ES changes (Chen et al., 2015; Liu et al., 2021).

4.2 Impacts of land use intensity changes on ecosystem services

The strength of human activity factors varies for different land use types, demonstrating their interdependence (Zhuang et al., 1997). The night light index is a comprehensive embodiment of population, economy, and other factors, which is closely related to human social activities. The revised LUI including the night light index can well reflect the degree of human disturbance in the YRB. Over the past 40 years, there have been notable transformations in the land use patterns within the YRB, with land policies during various phases of economic development exerting substantial influence on LUCC. Overall, construction land has increased and cultivated land and unused land have decreased (Zhang et al., 2020; Yang et al., 2021). This has caused continuous changes in the regional LUI, confirming the observed trend of increasing LUI within the basin.
The various components of ecosystems are interconnected through energy, material, and information flows, resulting in significant spatial dependencies between land use and ESs (Chen et al., 2025). Previous studies on the relationships between land use and ESs have often neglected LUI changes (Hasan et al., 2020; Ren et al., 2022). LUI is a direct reflection of human investment in and use of land resources (Han et al., 2021), and LUI changes lead to changes in ES functionality (Felipe-Lucia et al., 2020). Reducing LUI can improve ESs, but economic development can enhance LUI and degrade ESs. However, according to the results of this work, LUI showed completely different correlations with ESs at the local level. Spatially, the enhanced LUI of the YRB from 1980 to 2020 showed small overall changes in the three key ESs and larger local changes. In the areas with high LUI (such as Henan and Shandong), the three ESs were degraded and LUI was negatively correlated with ESs. The LUI in Qinghai, Ningxia, and Inner Mongolia was low, but LUI and ESs improved over time and LUI was positively correlated with ESs. This is consistent with the conclusions obtained from previous studies (Hao et al., 2023; Shi et al., 2025).
The fitting results indicate that increasing LUI substantially affects ESs, and within a certain range, LUI is positively correlated with ESs (Figure 8). Previous research findings indicate that on a long time scale, excessively high LUI can negatively impact ESs. When LUI exceeds a certain threshold, it leads to a decrease in ES, consistent with findings from prior research (Li et al., 2023a). Some scholars have found that cultivated land, forest land, and grassland are associated with higher values of ESs (Li et al., 2021; Tesfay et al., 2023). Decreasing cultivated land and forest land is a major factor in ES degradation, indirectly reflecting the influence of LUI on ESs (Akber et al., 2018). There are land degradation risks in the upper reaches of the YRB, while soil erosion and secondary salinization are common problems in the middle and lower reaches (Han et al., 2021). Hence, it is imperative to control LUI in different regions based on the land resource carrying capacity in the YRB (Yan et al., 2017). Differential and intelligent land use models should be adopted. Some scholars also suggest incorporating ESs into land sustainability evaluations in land development and management to enhance the ecological benefits of land use (Li and Lei, 2023).

4.3 Rationality of ecological function zoning based on ecosystem services and land use intensity

LUI is positively correlated with ESs within a certain range, but the correlation becomes negative as LUI exceeds a high level (Figure 12). Alterations in land use classifications and intensity due to economic development and urbanization are the main forms of human activity that affect ESs. There are significant differences in ESs within the YRB, with lower ES values in the meandering section. The YRB is a vital ecological barrier and economic region in China. It has a fragile ecological environment, scarce water resources, and serious soil erosion. It also faces the combined challenges of ecological conservation and economic advancement (Lu and Sun, 2019). Its uniqueness lies in the considerable variations in natural circumstances and economic progress within the basin (Lyu et al., 2023). Distinct development strategies need to be formulated based on regional differences. Previous research has identified ecological function zones through spatial overlay of ESs (Guan et al., 2019) and clustering analysis (Zhao et al., 2022b; Zhou et al., 2023). These methods identify similar spatial units based on ES levels (Li et al., 2023a) and the importance and sensitivity of ESs (Zhao et al., 2022a) to partition ecological functions. However, there is still no adequate solution to the question of whether the zoning criteria need to be adjusted for regions with significant disparities. The interactions between LUI and ESs represent two dimensions of ecological protection. Building on the identification of ES clusters, the application of LUI helps improve ecological function zoning by considering the impact of human activities. This approach leads to more reasonable and realistic zoning results. Therefore, this work combines LUI and ESs to form ecological function zones, clarifying the direction of ecological protection and development in different regions. This approach optimizes the benefits of ESs and provides a basis for precise land resources management.
Figure 12 The interdependent influence mechanisms of land use intensity (LUI) and ecosystem services (ESs)

4.4 Limitations and future research

In assessing the effect of LUI on ESs, it is essential to consider the spatial heterogeneity of geographical elements and their spatial correlation characteristics (Li et al., 2025). Scatter plot quadratic polynomial fitting curves were employed for analysis (Butcher et al., 2022). However, due to the inherent constraints of the method, there are uncertainties in the research, such as the considerable influence of model selection on research results, difficulty in capturing complex data relationships, and challenges in extrapolating data, among others (Van Sark et al., 2010). Future research is necessary to overcome the limitations in data and research methods. For example, this work only considered the three key ESs of WY, SC, and HQ. Consequently, the findings might deviate from the genuine ecological system conditions in the region. Future research should further explore other ESs, such as carbon sequestration, oxygen release, and climate regulation (Ding et al., 2023). This research focused on the long-term temporal changes of LUI and ESs at the grid scale, offering a narrow perspective. Future studies should integrate multiple spatiotemporal scales for comparative analysis to obtain more comprehensive spatial information. Human activities are a major factor influencing ESs. Although LUI partially signifies the degree of human activity, it may not provide all key information required to understand the full impact on ESs. In subsequent research, it is imperative to thoroughly examine natural factors and other anthropogenic factors to provide references for ecological preservation and the effective use of land resources.

5 Conclusions

This work centers on the impact of LUI on ESs in the YRB and proposes ES functional zoning through ES clusters. From 1980 to 2020, the overall LUI in the YRB was at a moderate intensity level and demonstrated a consistent upward trajectory, gradually strengthening from the upper to lower reaches. The annual variation in ESs in the YRB was relatively small, with some local fluctuations but overall minor changes. The spatiotemporal variations of ESs were profoundly influenced by human activities, particularly the alterations in LUI. A positive correlation exists between LUI and ESs within a certain range. However, excessively high LUI has a negative impact on ESs. This work categorized the region into four ecosystem service clusters, based on the ES values, consequently establishing four primary ecological function zones in the YRB: ecological restoration, ecological pressure, ecological sustainability, and ecological conservation. Based on this, this work combined LUI with the primary zoning and further adjusted it to six secondary function zones: ecological restoration, ecological transition, ecological overload, potential development, eco-economic carrying, and ecological conservation.
In the ecological restoration zone, ecological principles should be prioritized, with a focus on enhancing the protection of biological resources (Petroni et al., 2022). The ecological transition zone should actively explore pathways for converting ecological resources into economic benefits, develop distinctive ecological products. The ecological overload zone should enhance land development and promote the green transformation of industries. Potential development zones should improve infrastructure to mitigate the impact of topographical constraints on development. The eco-economic carrying zone should develop innovative industrial clusters, enhance the level of intensive land use, and alleviate the pressure of economic activities on ecosystems (Li et al., 2021). Finally, the ecological conservation zone must ensure stable economic development while preserving ES functions, thereby safeguarding regional ecological security.
[1]
Akber M A, Khan M W R, Islam M A et al., 2018. Impact of land use change on ecosystem services of southwest coastal Bangladesh. Journal of Land Use Science, 13(3): 238-250.

[2]
Assis J C, Hohlenwerger C, Metzger J P et al., 2023. Linking landscape structure and ecosystem service flow. Ecosystem Services, 62: 101535.

[3]
Bax V, van de Lageweg W I, Terpstra T et al., 2023. The impact of coastal realignment on the availability of ecosystem services: Gains, losses and trade-offs from a local community perspective. Journal of Environmental Management, 345: 118675.

[4]
Burke T, Rowland C S, Whyatt J D et al., 2023. Spatially targeting national-scale afforestation for multiple ecosystem services. Applied Geography, 159: 103064.

[5]
Butcher C L, Rubin B Y, Anderson S L et al., 2022. Long-distance pollen dispersal in urban green roof and ground-level habitats. Frontiers in Ecology and Evolution, 10: 790464.

[6]
Carpenter S R, DeFries R, Dietz T et al., 2006. Millennium ecosystem assessment: Research needs. Science, 314(5797): 257-258.

[7]
Chen M, Lu Y, Ling L et al., 2015. Drivers of changes in ecosystem service values in Ganjiang upstream watershed. Land Use Policy, 47: 247-252.

[8]
Chen W X, Liang J L, Bian J J et al., 2022. Impact of landscape fragmentation on soil conservation services in the Yellow River Basin. Geographical Science, 42(4): 589-601. (in Chinese)

[9]
Chen X W, Li H B, Zhang W B, et al., 2025. The impact of land use transition on ecosystem service value in Lixiahe area: Multi-scenario simulation based on Markov-FLUS model. Resources Science, 47(1): 182-195. (in Chinese)

[10]
Cheng Y H, Qiao W F, He T Q et al., 2024. Response of ecosystem services value to land use function change at the village scale in Gaochun district, Nanjing. Geographical Science, 44(2): 340-350. (in Chinese)

[11]
Dai E F, Wang Y H, 2020. Spatial heterogeneity and driving mechanisms of water yield service in the Hengduan Mountain region. Acta Geographica Sinica, 75(3): 607-619. (in Chinese)

[12]
Ding S Y, Jia X, Zhao Y H et al., 2023. Spatial-temporal patterns of supply and demand of ecosystem services in the ecological function area of Qin-Ba Mountains. Ecology and Environmental Sciences, 32(12): 2236-2248.

[13]
Duan X, Chen Y, Wang L et al., 2023. The impact of land use and land cover changes on the landscape pattern and ecosystem service value in Sanjiangyuan region of the Qinghai-Tibet Plateau. Journal of Environmental Management, 325(Part B): 116539.

[14]
Felipe-Lucia M R, Soliveres S, Penone C et al., 2020. Land-use intensity alters networks between biodiversity, ecosystem functions, and services. Proceedings of the National Academy of Sciences, 117(45): 28140-28149.

[15]
Feng K, Siu Y L, Guan D et al., 2012. Assessing regional virtual water flows and water footprints in the Yellow River Basin, China: A consumption based approach. Applied Geography, 32(2): 691-701.

[16]
Gou M, Li L, Ouyang S et al., 2021. Identifying and analyzing ecosystem service bundles and their socioecological drivers in the Three Gorges Reservoir area. Journal of Cleaner Production, 307: 127208.

[17]
Guan Q C, Hao J M, Xu Y Q et al., 2019. Zoning of agroecological management based on the relationship between supply and demand of ecosystem services. Resources Science, 41(7): 1359-1373. (in Chinese)

[18]
Guo F Y, Tong L J, Qiu F D et al., 2021. Spatio-temporal differentiation characteristics and influencing factors of green development in the eco-economic corridor of the Yellow River Basin. Acta Geographica Sinica, 76(3): 726-739. (in Chinese)

[19]
Han N, Yu M, Jia P et al., 2024. Influence of human activity intensity on habitat quality in Hainan Tropical Rainforest National Park, China. Chinese Geographical Science, 34: 519-532.

[20]
Han S B, Li F C, Wang S et al., 2021. Groundwater resource and eco-environmental problem of the Yellow River Basin. Geology in China, 48(4): 1001-1019.

[21]
Hao J Y, Zhi L H, Li X W et al., 2023. Temporal and spatial variations and the relationships of land use pattern and ecosystem services in Qinghai-Tibet Plateau, China. Chinese Journal of Applied Ecology, 34(11): 3053-3063.

[22]
Hasan S S, Zhen L, Miah M G et al., 2020. Impact of land use change on ecosystem services: A review. Environmental Development, 34: 100527.

[23]
He X, 2021. Study on the evolution of ecological security in karst area based on the threshold of ecosystem services, Geographical Science, 41(11): 2021-2030. (in Chinese)

[24]
Hu X, Hou Y, Li D et al., 2023. Changes in multiple ecosystem services and their influencing factors in Nordic countries. Ecological Indicators, 146: 109847.

[25]
Huang L, Wang J, Chen X, 2022. Ecological infrastructure planning of large river basin to promote nature conservation and ecosystem functions. Journal of Environmental Management, 306: 114482.

[26]
Huang P, Zhao X, Pu J et al., 2024. Defining the land use area threshold and optimizing its structure to improve supply-demand balance state of ecosystem services. Journal of Geographical Sciences, 34(5): 891-920.

[27]
Jiang R, Liu J, 2024. Characterization and projection of spatial and temporal changes in habitat quality of Sanjiangyuan based on land use change. Journal of Geographical Sciences, 34(9): 1797-1821.

[28]
Jiang X, Li X, Han H et al., 2024. Influence of land use transformation on carbon storage change in Gansu province. Arid Land Geography, 47(12): 2075-2082. (in Chinese)

[29]
Li H, Wu Y, Huang X et al., 2017. Spatial-temporal evolution and classification of marginalization of cultivated land in the process of urbanization. Habitat International, 61: 1-8.

[30]
Li H R, Ma S, Zhang M et al., 2023a. Determinants of ecological functional zones in the Qinghai-Tibet Plateau ecological shelter at different scales in 2000 and 2015: From the perspective of ecosystem service bundles. Ecological Indicators, 154: 110743.

[31]
Li Q R, Jia Y L, Wang H J et al., 2023b. Analysis of trade-off and synergy effects of ecosystem services in Hebei province from the perspective of ecological function area. Acta Geographica Sinica, 78(11): 2833-2849. (in Chinese)

[32]
Li S, Zhao X, Pu J et al., 2021. Optimize and control territorial spatial functional areas to improve the ecological stability and total environment in karst areas of Southwest China. Land Use Policy, 100: 104940.

[33]
Li X, Lei L, 2023. Evaluating rural sustainable land use from a system perspective based on the ecosystem service value. Regional Sustainability, 4(1): 96-114.

[34]
Li Y, Deng O, Zhang D et al., 2011. Land use and ecosystem service value scenarios simulation in Danjiangkou Reservoir area. Transactions of the Chinese Society of Agricultural Engineering, 27(5): 329-335.

[35]
Li Y, Wu H, Zhu L Q et al., 2025. Identification of ecosystem service degradation risks in Zhengzhou based on multi-scenario simulation of land use changes. Journal of Natural Resources, 40(2): 493-513. (in Chinese)

[36]
Lin Z, Xiao Y, Ouyang Z, 2021. Assessment of ecological importance of the Qinghai-Tibet Plateau based on ecosystem service flows. Journal of Mountain Science, 18: 1725-1736.

[37]
Liu X, Chen X, Hua K, et al., 2018. Effects of land use change on ecosystem services in arid area ecological migration. Chinese Geographical Science, 28: 894-906.

[38]
Liu Z T, Wang S J, Fang C L, et al., 2021. Spatiotemporal evolution and influencing mechanism of ecosystem service value in the Guangdong-Hong Kong-Macao Greater Bay Area. Acta Geographica Sinica, 76(11): 2797-2813. (in Chinese)

[39]
Lu D D, Sun D Q, 2019. Development and management tasks of the Yellow River Basin: A preliminary understanding and suggestion. Acta Geographica Sinica, 74(12): 2431-2436. (in Chinese)

[40]
Lyu S, Guo C, Zhai Y et al., 2023. Characterising baseflow signature variability in the Yellow River Basin. Journal of Environmental Management, 345: 118565.

[41]
Mengue V P, de Freitas M W D, da Silva T S et al., 2020. Land-use and land-cover change processes in Pampa biome and relation with environmental and socioeconomic data. Applied Geography, 125: 102342.

[42]
Millennium Ecosystem Assessment, 2005. Ecosystems and Human Well-being:Synthesis. Washington, DC: Island Press.

[43]
Newbold T, Hudson L N, Hill S L L et al., 2015. Global effects of land use on local terrestrial biodiversity. Nature, 520(7545): 45-50.

[44]
Oertel E, Vickery C E, Quinn J E, 2024. Linked spatial and temporal success of urban growth boundaries to preserve ecosystem services. Landscape and Urban Planning, 250: 105134.

[45]
Peng L, Zhang L, Li X et al., 2022. Spatial expansion effects on urban ecosystem services supply-demand mismatching in Guanzhong Plain Urban Agglomeration of China. Journal of Geographical Sciences, 32(5): 806-828.

[46]
Petroni M L, Siqueira-Gay J, Gallardo A L C F, 2022. Understanding land use change impacts on ecosystem services within urban protected areas. Landscape and Urban Planning, 223: 104404.

[47]
Qiao X, Gu Y, Zou C, et al., 2018. Trade-offs and synergies of ecosystem services in the Taihu Lake Basin of China. Chinese Geographical Science, 28: 86-99.

[48]
Qiu S, Peng J, Dong J et al., 2021. Understanding the relationships between ecosystem services and associated social-ecological drivers in a karst region: A case study of Guizhou province, China. Progress in Physical Geography: Earth and Environment, 45(1): 98-114.

[49]
Quan B, Römkens M J M, Tao J et al., 2008. Spatial-temporal pattern and population driving force of land use change in Liupan Mountains region, southern Ningxia, China. Chinese Geographical Science, 18: 323-330.

[50]
Raudsepp-Hearne C, Peterson G D, Bennett E M, 2010. Ecosystem service bundles for analyzing tradeoffs in diverse landscapes. Proceedings of the National Academy of Sciences, 107(11): 5242-5247.

[51]
Ren Q, He C, Huang Q et al., 2022. Impacts of urban expansion on natural habitats in global drylands. Nature Sustainability, 5(10): 869-878.

[52]
Shao Y, Xiao Y, Kou X et al., 2023. Sustainable land use scenarios generated by optimizing ecosystem distribution based on temporal and spatial patterns of ecosystem services in the southern China hilly region. Ecological Informatics, 78: 102275.

[53]
Shi X, Zhang J, Liu S, et al., 2025. Impact of land use change on carbon storage in the middle reaches of the Yellow River, China. Journal of Arid Land, 17(2): 167-181.

[54]
Tang Z, Ning R, Wang D et al., 2024. Projections of land use/cover change and habitat quality in the model area of Yellow River delta by coupling land subsidence and sea level rise. Ecological Indicators, 158: 111394.

[55]
Tesfay F, Tadesse S A, Getahun Y S et al., 2023. Evaluating the impact of land use land cover changes on the values of ecosystem services in the Chacha Watershed, Ethiopia’s central highland. Environmental and Sustainability Indicators, 18: 100256.

[56]
Tian Y, Xu D, Song J et al., 2022. Impacts of land use changes on ecosystem services at different elevations in an ecological function area, northern China. Ecological Indicators, 140: 109003.

[57]
Tuholske C, Tane Z, López-Carr D et al., 2017. Thirty years of land use/cover change in the Caribbean: Assessing the relationship between urbanization and mangrove loss in Roatán, Honduras. Applied Geography, 88: 84-93.

[58]
Turner B L, Lambin E F, Reenberg A, 2007. The emergence of land change science for global environmental change and sustainability. Proceedings of the National Academy of Sciences, 104(52): 20666-20671.

[59]
Van Sark W, Alsema E A, 2010. Potential errors when fitting experience curves by means of spreadsheet software. Energy Policy, 38(11): 7508-7511.

[60]
Wang B Y, Wang L, Chen J C et al., 2023. Identification of ecological functional zoning and its influencing factors in the Sihu Lake Basin, China. Chinese Journal of Applied Ecology, 34(10): 2757-2766. (in Chinese)

[61]
Xiong X Y, Mei M, 2023. Regionalization and optimization strategy of ecological management in Xinjiang, China based on supply-demand relationship and spatial flow of ecosystem services. Chinese Journal of Applied Ecology, 34(8): 2237-2248. (in Chinese)

[62]
Yan H, Liu F, Liu J et al., 2017. Status of land use intensity in China and its impacts on land carrying capacity. Journal of Geographical Sciences, 27(4): 387-402.

[63]
Yang D, Liu W, Tang L, et al., 2019. Estimation of water provision service for monsoon catchments of South China: Applicability of the InVEST model. Landscape and Urban Planning, 182: 133-143.

[64]
Yang G Z, Lv K, Li F, 2022a. Spatial and temporal correlation analysis of land use change and ecosystem service value in Nanchang city based on grid scale. China Land Science, 36(8): 121-130.

[65]
Yang J, Xie B, Zhang D et al., 2021. Climate and land use change impacts on water yield ecosystem service in the Yellow River Basin, China. Environmental Earth Sciences, 80: 72.

[66]
Yang L, Li Y, Jia L et al., 2023. Ecological risk assessment and ecological security pattern optimization in the middle reaches of the Yellow River based on ERI + MCR model. Journal of Geographical Sciences, 33(4): 823-844.

[67]
Yang R, Chen H, Chen S et al., 2022b. Spatiotemporal evolution and prediction of land use/land cover changes and ecosystem service variation in the Yellow River Basin, China. Ecological Indicators, 145: 109579.

[68]
Yang S, Yuan Z, Ye B et al., 2024. Impacts of landscape pattern on plants diversity and richness of 20 restored wetlands in Chaohu Lakeside of China. Science of the Total Environment, 906: 167649.

[69]
Yin H, Pflugmacher D, Li A et al., 2018. Land use and land cover change in Inner Mongolia: Understanding the effects of China’s re-vegetation programs. Remote Sensing of Environment, 204: 918-930.

[70]
Yu Y, Xiao Z, Bruzzone L et al., 2024. Mapping and analyzing the spatiotemporal patterns and drivers of multiple ecosystem services: A case study in the Yangtze and Yellow river basins. Remote Sensing, 16(2): 411.

[71]
Yuan D, Du M, Yan C et al., 2024. Coupling coordination degree analysis and spatiotemporal heterogeneity between water ecosystem service value and water system in Yellow River Basin cities. Ecological Informatics, 79: 102440.

[72]
Zeng Z W, Yang H, Ning Q M et al., 2022. Temporal and spatial evolution of land use intensity and its impact on ecosystem services in Dongting Lake zone. Economic Geography, 42(9): 176-185. (in Chinese)

[73]
Zhai T, Zhang D, Zhao C, 2021. How to optimize ecological compensation to alleviate environmental injustice in different cities in the Yellow River Basin? A case of integrating ecosystem service supply, demand and flow. Sustainable Cities and Society, 75: 103341.

[74]
Zhang B F, Miao C H, 2020. Spatiotemporal changes and driving forces of land use in the Yellow River Basin. Resources Science, 42(3): 460-473.

[75]
Zhang C Y, Bai Y P, Yang X D et al., 2022a. Identification of ecosystem service bundles in Ningxia Plainunder multi-scenario simulation. Geographical Research, 41(12): 3364-3382. (in Chinese)

[76]
Zhang Y, Zhao Z, Fu B et al., 2022b. Identifying ecological security patterns based on the supply, demand and sensitivity of ecosystem service: A case study in the Yellow River Basin, China. Journal of Environmental Management, 315: 115158.

[77]
Zhao H B, Gu T S, Sun D Q et al., 2023. Dynamic evolution and influencing mechanism of urban human settlements in the Yellow River Basin from the perspective of “production-living-ecological” function. Acta Geographica Sinica, 78(12): 2973-2999. (in Chinese)

[78]
Zhao L, Du M, Zhang W et al., 2022a. Functional zoning in national parks under multifactor trade-off guidance: A case study of Qinghai Lake National Park in China. Journal of Geographical Sciences, 32(10): 1969-1997.

[79]
Zhao X Q, Shi X Q, Li Y H et al., 2022b. Spatio-temporal pattern and functional zoning of ecosystem services in the karst mountainous areas of southeastern Yunnan. Acta Geographica Sinica, 77(3): 736-756. (in Chinese)

[80]
Zhao Y, Liu S, Liu H et al., 2024. Nature’s contributions to people responding to landscape stability in a typical karst region, southwest China. Applied Geography, 163: 103175.

[81]
Zheng H, Peng J, Qiu S et al., 2022. Distinguishing the impacts of land use change in intensity and type on ecosystem services trade-offs. Journal of Environmental Management, 316: 115206.

[82]
Zhou W, Xi Y, Zhai L et al., 2023. Zoning for spatial conservation and restoration based on ecosystem services in highly urbanized region: A case study in Beijing-Tianjin-Hebei, China. Land, 12(4): 733.

[83]
Zhu Y H, Hou Z D, Xu C X et al., 2023. Ecological risk identification and management based on ecosystem service supply and demand relationship in the Bailongjiang River Watershed of Gansu province. Geographical Science, 43(3): 423-433. (in Chinese)

[84]
Zhuang D F, Liu J Y, 1997. Study on the model of regional differentiation of land use degree in China. Journal of Natural Resources, 12(2): 10-16. (in Chinese)

Outlines

/