Special Issue: Human, Civilization Evolution and Environmental Interaction

Distribution of prehistoric human land use in the Liaohe River Valley as related to climate change

  • YU Yanyan , 1 ,
  • YU Jie 1 ,
  • ZHANG Wenchao 2 ,
  • WU Haibin 1, 3 ,
  • GUO Zhengtang 1
Expand
  • 1. State Key Laboratory of Lithospheric and Environmental Coevolution, Institute of Geology and Geophysics, CAS, Beijing 100029, China
  • 2. School of Earth Sciences and Resources, China University of Geosciences (Beijing), Beijing 100083, China
  • 3. University of Chinese Academy of Sciences, Beijing 100049, China

Yu Yanyan (1980-), Associate Professor, specialized in past human activity and carbon cycle. E-mail:

Received date: 2024-08-31

  Accepted date: 2024-12-04

  Online published: 2025-09-04

Supported by

Global Change Program of National Key Research and Development Program of China(2020YFA0607700)

National Natural Science Foundation of China(T2192954)

National Natural Science Foundation of China(42488201)

National Natural Science Foundation of China(42177180)

Abstract

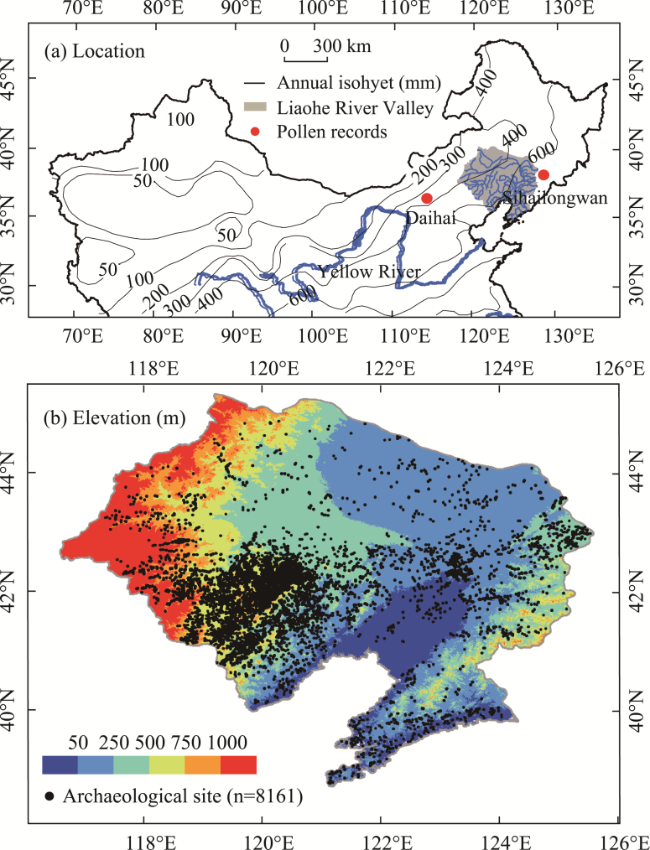
The Liaohe River Valley was one of the key centers of the origination and development of agriculture in northern China during the Holocene. To understand the long-term interaction among the evolutions of climate, agriculture, and human activities, it is essential to quantitatively reconstruct the spatiotemporal changes in regional prehistoric human land use. In this study, known archaeological sites and a prehistoric land use model (PLUM) were combined to reconstruct changes in land use in the Liaohe River Valley during 8-2 ka BP from a quantitative perspective. The land use area experienced two stages of increase (during 8-5 ka BP and after 4 ka BP) and one stage of decrease (during 5-4 ka BP); these periods were characterized by spatial expansions and contractions. The land use intensity level differed significantly in the western and eastern parts of the valley before 4 ka BP, but the situation changed as the distribution center of the human activity shifted to the southern part of the valley around 5-4 ka BP. Overall, the spatial and temporal changes in the land use areas in both the western and eastern parts of the valley responded well to variations in precipitation during 8-2 ka BP, which potentially provides useful insights into understanding the responses of human activity to future climate change.

Cite this article

YU Yanyan , YU Jie , ZHANG Wenchao , WU Haibin , GUO Zhengtang . Distribution of prehistoric human land use in the Liaohe River Valley as related to climate change[J]. Journal of Geographical Sciences, 2025 , 35(8) : 1695 -1713 . DOI: 10.1007/s11442-025-2390-8

1 Introduction

Understanding the relationships among past climate evolution, culture development, and human activity is a key reference for reasonably addressing the issue of the human-environment interaction under current and future global climate changes. During the long evolution process of human society, the settled lifestyle, such as that in modern times, did not become widely adopted until the Holocene, and this coincided with the development of agriculture. Therefore, studying the relationship between humans and the environment during the Holocene is particularly meaningful.
The influences of climate change and cultural development on human activity in the Holocene have been studied from local to global scales, and the correlations between these variables over time have been widely revealed (Zheng et al., 2008; He et al., 2010; Bevan et al., 2017; Ralf et al., 2022). However, the factors controlling human activity are usually difficult to determine, as the reactions of human activity to climate change among different regions and periods usually varied, especially after the Middle-Late Holocene when social resilience improved (Ren et al., 2021). Currently, comparisons of the curves of different climatic, cultural, and human activity variables over time have been adopted in most studies (Wang et al., 2014; Bevan et al., 2017), which cannot clarify their relationships from the spatial perspective. Some studies have analyzed the spatiotemporal changes in archaeological records, but these point records cannot supply enough quantitative information about human activity (Dong et al., 2017; He et al., 2022). Overall, these shortcomings have hampered the evaluation of the different contributions of climate, culture, and other factors to the evolution of human activity in the Holocene.
Land use has been the primary mode of human activity since the development of agriculture during the Holocene; therefore, quantitative reconstruction of its spatiotemporal changes in the Holocene could provide new spatially continuous data, which are useful for evaluating the spatial correlations among the changes in climate, culture, and human activities on long timescales. Currently, modeling approaches have usually been adopted in quantitative Holocene land use reconstructions at different spatial scales because documents from the prehistoric period are still lacking. Extrapolations of the historical population and the relationship among the distributions of modern land use, population, and environmental variables to the prehistoric period have been applied on regional to global scales (Olofsson and Hickler, 2008; Lemmen, 2009; Goldewijk et al., 2011, 2017; Kaplan et al., 2011), and the spatiotemporal changes in world land use areas during the Holocene have been obtained using such hindcasting techniques. However, the accuracy of these studies still needs to be improved because of the lack of direct evidence of prehistoric human activity. Models established based on pollen records and mechanistic or analogy methods are a useful approach to evaluating the intensity of past human disturbances on land cover (Sugita, 2007; Fyfe et al., 2010); however, it is still challenging to distinguish between many types of cereal pollen at the species level, which makes it difficult to differentiate anthropogenic biotypes from natural plant communities.
Recently, the importance of applying archaeological records in prehistoric human land use reconstructions has become gradually recognized because they provide direct evidence of prehistoric human activities (such as the intensity and distribution) (ArchaeoGLOBE Project, 2019). Using archaeological data, the prehistoric land use model (PLUM) has been developed and applied in several typical dry and rice cultivation areas in the Yellow and Yangtze river valleys in China (Yu et al., 2012, 2016, 2022; Luan et al., 2024), providing a useful method for reconstructing spatiotemporal changes in land use on long timescales from a quantitative perspective. The temporal fluctuations and spatial migration of prehistoric human activity can be more accurately reflected by these archaeological control points.
In addition to the two key centers of the origination and development of agriculture (the Yellow River Valley and Yangtze River Valley) in China, the Liaohe River Valley was another key center of the origination and development of agriculture in China (Zhao, 2005; Hu et al., 2008), but high-resolution land use reconstruction is still lacking. Numerous archaeological records were discovered in the valley during the second national cultural survey, providing a valuable database for reconstruction of the land use using the PLUM.
In this study, the spatiotemporal changes in human land use in the Liaohe River Valley from 8 to 2 ka BP were reconstructed for the first time using archaeological data and the PLUM to quantitatively evaluate the prehistoric human activity intensity. Then, the responses of the land use evolution to climate change in different parts of the valley were revealed from both temporal and spatial perspectives to clarify the controlling climatic factor in regional human activity.

2 Study area

The Liaohe River Valley is located in northeastern China (38.72°-45.00°N, 116.50°- 125.78°E) and covers a total area of 21.9×10⁴ km2 (Figure 1) (Meng et al., 2007). The altitude of the Liaohe River Valley is higher in the west and east and lower in the middle (https://www.geodata.cn/). The modern annual mean temperature in the valley ranges from about −3℃ to 11℃, while the annual precipitation ranges from about 360 mm to 1080 mm (https://www.worldclim.org/data/v1.4/). The natural vegetation in the valley includes temperate meadow grassland in the north, warm temperate deciduous broad-leaved forest in the west and south, and temperate coniferous and broad-leaved mixed forest in the eastern mountainous areas (Meng et al., 2007). Currently, the cultivation area covers about 39% of the total area of the valley (https://www.geodata.cn/). Brown earth, aeolian sandy soils, chestnut soils, moisture soils, and meadow soils are the main soil types (http://www.resdc.cn/).
Figure 1 Locations of the Liaohe River Valley and pollen records (a); distribution of archaeological sites (b)
The period from ~8 to 2 ka BP is addressed in this study since the earliest crop seed (millet) was discovered at the Xinglonggou site in the Liaohe River Valley at about 8 ka BP (Zhao, 2005), and there are few archaeological sites with ages younger than 2 ka BP because of the richness of documents for the historical period. Table 1 presents the cultural sequences developed in different parts of the Liaohe River Valley.
Table 1 Information about the cultural sequences developed in the Liaohe River Valley
Culture types Age (a BP) Distribution in the valley References Assigned period
(ka BP)
Xiaohexi 8200 Western part National Heritage Board, 2003 8-7
Xinglongwa 8200-7400 Western and central parts National Heritage Board, 2003, 2009, 2013 8-7
Zhaobaogou 7200-6200 Western part National Heritage Board, 2003 8-7 and 7-6
Fuhe 7200-6200 Western part National Heritage Board, 2003 8-7 and 7-6
Hongshan 6700-5000 Western and central parts National Heritage Board, 2003, 2009, 2013 7-6 and 6-5
Xiaoheyan 5000-4500 Western and central parts National Heritage Board, 2003, 2009 5-4
Lower Xinle 7000-6000 Central part National Heritage Board, 2009 8-7 and 7-6
Pianbao 5000 Central part National Heritage Board, 2009 6-5 and 5-4
Lower Xiaozhushan 7000-6000 Eastern part National Heritage Board, 2009 8-7 and 7-6
Middle Xiaozhushan 5000 Eastern part National Heritage Board, 2009 6-5
Upper Xiaozhushan 4000 Eastern part National Heritage Board, 2009 5-4
Lower Houwa 7000-6000 Eastern part National Heritage Board, 2009 7-6
Upper Houwa 5000 Eastern part National Heritage Board, 2009 6-5 and 5-4
Bronze Age 4000-2000 Western, central and eastern parts National Heritage Board, 1993, 2003, 2009, 2013 4-3 and 3-2
Chunqiu-Zhanguo 2770-2221 Western, central and eastern parts National Heritage Board, 1993, 2003, 2009, 2013 3-2
Lower Xiajiadian 4300-3500 Western and central parts National Heritage Board, 2003, 2009, 2013 4-3
Upper Xiajiadian 3200-2300 Western and central parts National Heritage Board, 2003, 2009, 2013 3-2
Weiyingzi 3500 Western part National Heritage Board, 2003 4-3
Gaotaishan 4300-3500 Central part National Heritage Board, 2003, 2009 4-3
Machengzi 4070-3046 Central part National Heritage Board, 2009 4-3
Upper Xinle Central part National Heritage Board, 2009 4-3 and 3-2
Shunshantun 3000 Central part National Heritage Board, 2009 4-3
Wanghua Central part National Heritage Board, 2009 4-3
Liangquan Central part National Heritage Board, 2009 3-2
Shuangtuozi Eastern part National Heritage Board, 2009 4-3

3 Materials and methods

3.1 PLUM model

In the PLUM, the reconstruction of prehistoric human land use areas and distributions based on archaeological and environmental data is conducted quantitatively using three sub-models (land use requirement, residential area distribution, and land use allocation sub-models). Detailed information about the model has been presented by Yu et al. (2012). The framework of the model is shown in Figure S1.
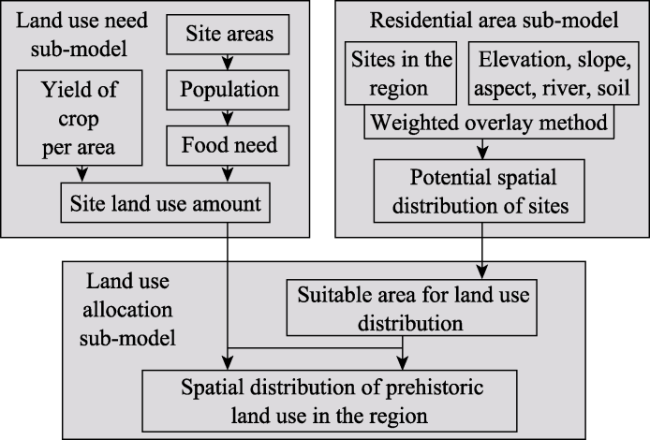
Figure S1 Workflow of the prehistoric land use model (PLUM)
In the first step, the total residential and cultivated area in the study area is calculated using the land use requirement sub-model. The estimation assumes that human survival relied entirely on cultivated plants because it is still difficult to quantitatively assess the amounts of natural plant and animal resources in prehistoric human food sources using the available archaeological records. The equation for calculating the total human land use (Al) is as follows:
A l = A r + A r A p × F p Y × T f + T c T c
where Ar and Ap are the total residential area and the average residential area per person inside the archaeological sites, Fp is the food requirement per person, Y is the yield per unit area, and Tf and Tc are the intervals of fallow and tillage during one cultivation cycle. These variables can be obtained from published archaeological research.
In the second step, the potential distribution of humans is predicted using the residential area distribution sub-model. A weighted overlay method is adopted to make the prediction according to the relationship between the distributions of the archaeological sites and various environmental variables. Two types of weights (class and spot weights) are set for all of the grids in the study area and are used to represent the degrees to which human activities depend on the environmental variables and the different ranges of these variables, respectively. The class weights are set based on the differences in the cumulative frequency distributions of the environmental variables between grids in the study area and known archaeological sites. A higher weight corresponds to a greater difference. The spot weights are set based on the percentage of archaeological sites distributed in the different sub-ranges of each specific environmental variable, and the weights are positively correlated with the percentages. The class and spot weights for a specific environmental variable are multiplied to obtain the total weight, and then, the total weighted grid layers in the study area for the different environmental variables are summed and standardized to the range of 0-100% to create a single layer, which shows the potential distribution of human occupation across the study area from low to high.
In the final step, the land use area of the archaeological sites (estimated using land use requirement sub-model) is allocated to the appropriate grids in the study area using the land use allocation sub-model. Because the distance humans can walk in 1 day is limited, the allocation process starts with the assumption that humans always selected the grids around the archaeological site within a threshold distance, and the grids with higher standardized total weight values according to the residential area distribution sub-model were selected first. The process ends when the total land use areas of the archaeological sites are all distributed to suitable grids.

3.2 Inputs of archaeological data

A total of 8161 archaeological sites in the Liaohe River Valley were used as the inputs of land use requirement sub-model. The information for these sites was obtained from the published Chinese Cultural Relics atlases for Liaoning province, Jilin province, Hebei province, and the Inner Mongolia autonomous region (National Heritage Board, 1993, 2003, 2009, 2013). The information is presented in Table S1. These archaeological sites were documented during the second national cultural survey undertaken in the 1980s, and the related information (e.g., the name, location, area, culture type, culture depth, and archaeological remains) for the sites was attached in the atlases.
About 97% of the archaeological sites belong to specific cultural types (Table 1), which occurred in a period of less than 2000 years according to their absolute ages, and all of these sites were assumed to exist continuously during the corresponding entire cultural periods (Tables 1 and S1). As for 3% of the sites under unclear Neolithic culture types, they were randomly attributed to different 1000-year time windows during 8-4 ka BP based on the number of archaeological sites under clear cultural types in each millennium (Table S1). This attribution technique is acceptable because the percentages of the sites with clear cultural types are overwhelming, and they can be used to determine the pattern of the temporal changes in the sites. The specific culture types and time periods that have been assigned to the archaeological sites are presented in Table S1.
The residential areas of 88% of the archaeological sites were documented. For each cultural type, the median value of the area of the known sites was used for the sites of the same type without documented values. As some of the known sites that existed during different cultural periods only had one documented area value, these sites were excluded during the calculation of the residential areas of the unknown sites.
Several socioeconomic parameters were adopted in the land use requirement and land allocation sub-models, and these data were mainly based on the results presented in the published literature. Table 2 presents the corresponding values for the Liaohe River Valley.
Table 2 Socioeconomic parameters used in the PLUM (prehistoric land use model) for the Liaohe River Valley
Age
(ka BP)
Residential area
per person (m2)
Food need per
person (kg/yr)
Yield per
unit area (g/m2)
Fallow
period (yr)
Tillage
period (yr)
8-7 496 (412-580) 300 (200-400) 45 (37.5-52.5) 42 3
7-6 235 (220-250) 300 (200-400) 55.5 (48-63) 17 3
6-5 177 (167-209) 300 (200-400) 66 (58.5-73.5) 15 3
5-4 144 (137-151) 300 (200-400) 76.5 (69-84) 9 3
4-3 116 (87-145) 300 (200-400) 87 (79.5-94.5) 6 3
3-2 100 (75-125) 300 (200-400) 97.5 (90-105) 3 3
The average value of the residential area per person and its range were set according to a study on typical excavated archaeological sites in the Yellow River Valley in northern China (Wang, 2011).
The average food need per person and its range were calculated according to the minimum annual nutritional requirements of an individual, and the value of 300 (200-400) kg/year estimated by Araus et al. (2003) was taken as a constant during the study period since human physiognomy and physiology changed insignificantly during the Holocene (Wu, 1995).
The average value and range of the yield per unit area for millet cultivation were estimated based on archaeological research, historical documents, and modern slash and burn agriculture observations (Song, 1982; Wu, 1985; Gao and Min, 2008; Zheng et al., 2009).
The time periods of the fallow and tillage intervals before 5 ka BP were obtained from studies of typical archaeological sites that belonged to different types of fallow vegetation (forest, bushes, and short fallows) (Wang, 1997), while the corresponding value for 3-2 ka was obtained from studies on the Han Dynasty and modern slash and burn agriculture (Guo, 1994; Yang et al., 2018). These values were further used to estimate the corresponding value during 4-3 ka BP through linear interpolation.
As cultivation usually occurred within a certain distance from the archaeological sites, the threshold value of the distance (10 km) was set based on the maximum time (2 h) that a human can potentially spend on walking to cultivated fields in 1 day (Zheng et al., 2008).

3.3 Inputs of environmental data

Modern spatial environmental data (altitude, soil type, and water system) throughout the Liaohe River Valley were needed for the residential area distribution sub-model. The grid layer of the altitude (90 m × 90 m horizontal resolution and 1 m vertical resolution) was obtained from the website of the Shuttle Radar Topography Mission (http://srtm.csi. cgiar.org/). The vector layers of the soil type (1:1,000,000) and water system (1:4,000,000) were obtained from the National Earth System Science Data Center (http://www. geodata.cn/). The grid layer of the slope was extracted from the altitude data using ArcGIS 10.2, a geographic information system (GIS) software. The grid layers of the horizontal and vertical distances to the water system were calculated based on the data for the altitude and water system using ArcGIS. All of the layers of the environmental variables mentioned above were finally converted or resampled to grid data with the same resolution of 0.01°×0.01° under the uniform projection WGS_1984.

3.4 Pollen data and paleoclimate reconstructions

Fossil pollen data are widely accepted geological records for conducting reliable quantitative paleoclimate reconstruction. In consideration of the data quality of the records (e.g., number of dates, duration of the record, and sampling resolution), two pollen records from Daihai (Xiao et al., 2004) and Sihailongwan (Stebich et al., 2015) in the western and eastern parts of the Liaohe River Valley were selected from the published literature and were used to reflect the climate changes in the western and eastern parts of the valley, respectively. More than five independent radiocarbon dates have been reported for each of these two pollen records. The durations of all of the records exceed the entire Holocene, and the samples younger than 1 ka BP used for the anomaly calculation are also included in the records. The sampling resolutions of the records are less than 60 years, and each sample contains >200 pollen counts.
The modern pollen dataset utilized in this study includes 1863 surface pollen samples from Li et al. (2009) and the East Asian Pollen Database (Zheng et al., 2014). This dataset was used to establish the transfer function during the climate reconstruction. These surface pollen samples are distributed across China, covering climate conditions from cold temperate zone to tropical zone. Such wide climatic and ecological ranges span the changes in the climate in the Liaohe River Valley during the Holocene. Modern spatial climate data of the whole valley were from a 30-second gridded monthly mean climate dataset (1960-1990) (https://www.worldclim.org/data/v1.4/worldclim14.html).
The climatic factors in the pollen records for Daihai and Sihailongwan have been quantitatively reconstructed in previous studies using different methods (Xu et al., 2010; Stebich et al., 2015). In this study, to reduce the uncertainty of the comparison between the records based on different reconstruction methods, the modern analogy technique (MAT), which is implemented in the R package Rioja (Juggins, 2020), was applied to both records to reconstruct their annual mean temperature and annual precipitation (ANNT and ANNP). In this study, the MAT was based on the scores of the plant functional type (PFT, i.e., plant group characterized by common phenological and climate constraints) because the application of PFTs rather than pollen taxa can decrease the amount of poor analogue cases and reduce non-climatic influences (Prentice et al., 1992; Peyron et al., 1998; Davis et al., 2003).
The reconstruction process for each pollen record was as follows. First, all of the radiocarbon dates in the pollen records were recalibrated based on the IntCal20 calibration curve and were interpolated to sample levels using the R package clam (Blaauw, 2010; Reimer et al., 2020). Then, the fossil pollen samples with different ages were matched with modern pollen datasets using the dissimilarity of the biome score compositions according to the squared chord distance (Overpeck et al., 1985), and the risk of non-analogy bias was decreased by using a dissimilarity threshold value (T=0.06) for the non-analogy/analogy definition. Finally, the climatic conditions under which the sample in the pollen record was deposited were reconstructed according to the dissimilarity-weighted mean climate of the seven closest modern analogues (Simpson, 2012).
All of the significant climate reconstructions in the records from the Daihai and Sihailongwan sites were converted to anomalies through comparison with the mean value of their latest 1000 years of reconstructions. The reconstructed anomalies of the samples were further linearly interpolated to 200-year bins, which were finally averaged into different 1000-year intervals (Marsicek et al., 2018). To visualize the spatial changes in the climate during the past millennia, the anomalies of the Daihai and Sihailongwan records in different 1000-year intervals were overlaid onto the layers of the modern climatic variables (temperature and precipitation) in the western and eastern parts of the Liaohe River Valley, respectively.

4 Results

4.1 Spatiotemporal changes in archaeological sites and human population

The number of archaeological sites in the Liaohe River Valley increased from 321 to 3481 between 8 and 2 ka BP (Figures 2 and S2), and the total residential areas of the sites increased from 14.6 km2 during 8-7 ka BP to 70.6 km2 during 3-2 ka BP. In addition, the human population increased from 3.4×10⁴ individuals (average of 2.5×10⁴-4.2×10⁴) during 8-7 ka BP to 75.8×10⁴ individuals (average of 56.5×10⁴-97.3×10⁴) during 3-2 ka BP, indicating that the total population increased by a factor of more than 20. The changes in the above three variables during 8-2 ka BP were further divided into three stages. First, the site numbers, residential areas, and population size in the valley all slowly increased during 8-5 ka BP. Then, they synchronously decreased significantly during 5-4 ka BP. Finally, these variables all increased significantly after 4 ka BP.
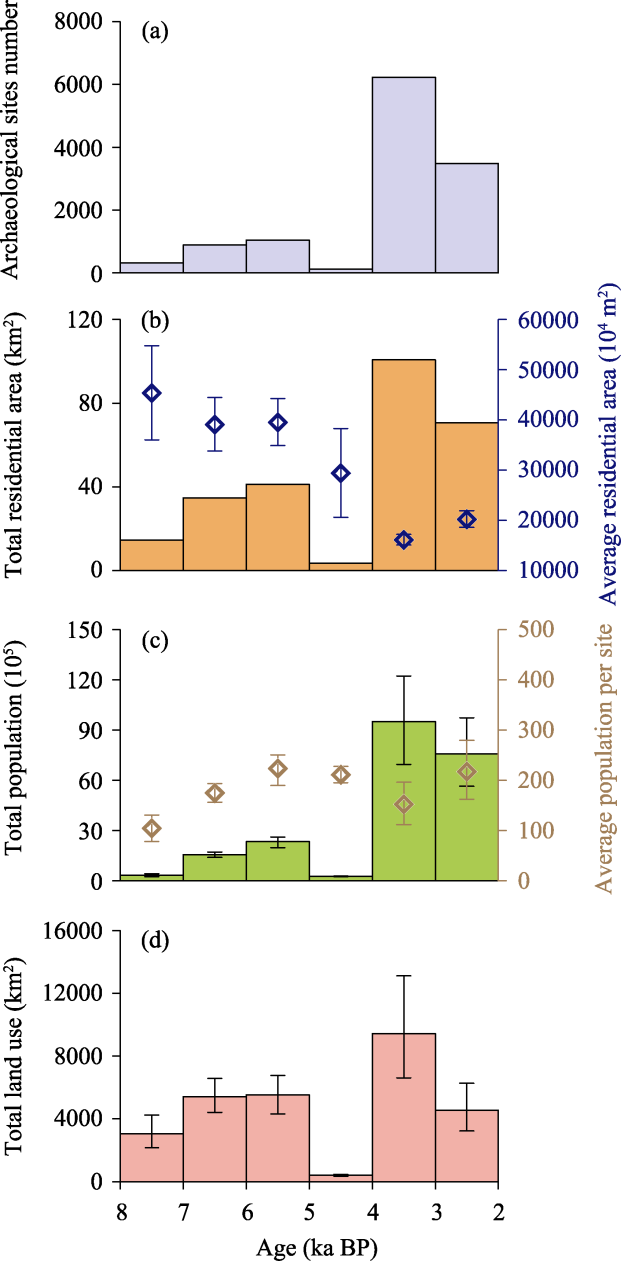
Figure 2 Changes in human activity in the Liaohe River Valley during 8-2 ka BP: (a) number of archaeological sites; (b) total and average values of residential areas (the ranges of the values are denoted as average ± SEM, SEM is Standard Error of Mean); (c) total and average values of population (the ranges of the values are denoted as average ± SEM); (d) total land use areas (the range of the values is denoted as average ± SEM.)
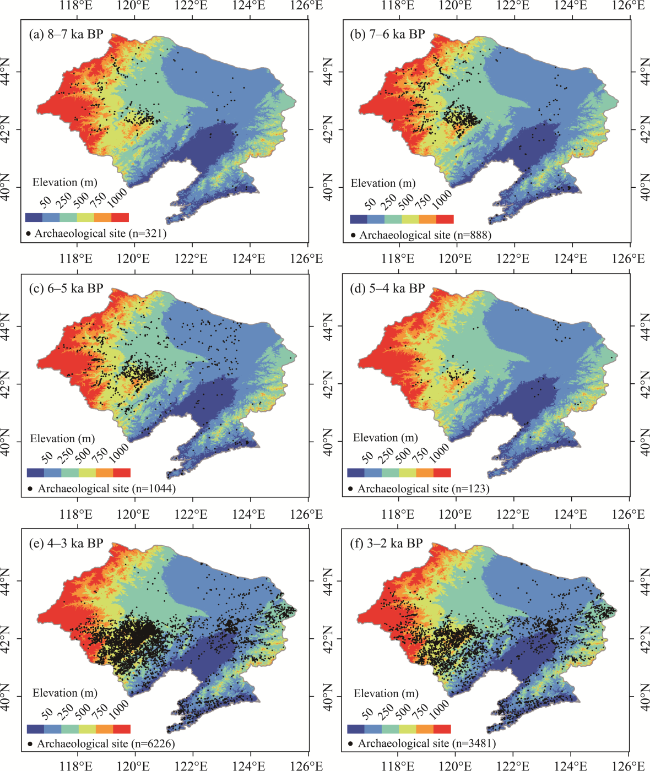
Figure S2 Distribution of archaeological sites and elevation in the Liaohe River Valley from 8 to 2 ka BP
Regarding the average human activity intensity at the different archaeological sites in the valley, the average residential area decreased overall with time, while the average human population remained relatively stable, within the range of 100-200 individuals. Because the population size of each archaeological site was estimated according to its total residential area and the corresponding value per person, the synchronous decreases in these two variables during 8-2 ka BP caused the small variations in the average population.
Spatially, the changes in the distribution of the archaeological sites with time can also be divided into three stages (Figure S2). Before 5 ka BP, most of the archaeological sites were distributed in the western part of the Liaohe River Valley, and the distribution of the sites experienced an expansion process from higher altitude to different altitudes. During 5-4 ka BP, the range of the distribution of the archaeological sites contracted significantly to small areas in the western part of the valley. After 4 ka BP, the spatial distribution of the archaeological sites expanded again, and the density of the sites increased more significantly in the southern part of the valley. There was an obvious boundary near 42.5°N, and the densities of the site distribution on the two sides of this boundary were obviously different.

4.2 Spatiotemporal changes in prehistoric human land use

The temporal changes in the reconstructed total human land use area in the Liaohe River Valley during 8-2 ka BP exhibited characteristics similar to the changes in the archaeological sites and population in the valley (Figure 2). First, it gradually increased from 3053 km2 to 5411 km2 to 5531 km2 between 8 and 5 ka BP; then, it sharply decreased to 398 km2 during 5-4 ka BP, and finally, it rebounded to values as high as 9428 km2 and 4556 km2 during 4-2 ka BP. Overall, the variation range of the human land use was smaller than those of the number of sites and population size during 8-2 ka BP.
The reconstructed average land use area among the different archaeological sites continuously decreased from 8 to 2 ka BP. Before 5 ka BP, <50% of the archaeological sites had land use areas <1 km2 during each millennium, while >7% of the sites had land use areas >10 km2. In contrast, >77% of the archaeological sites had land use areas <1 km2 during 4-2 ka BP, and <2% of the sites had land use areas >10 km2. These differences may be partly due to an increase in land use efficiency.
Regarding the spatial changes in the land use from 8 to 2 ka BP (Figure 3), the reconstruction indicates that the areas with higher percentages of land use were mainly distributed around the archaeological sites in the northwestern part of the valley during 8-6 ka BP. The land use expanded across the entire western part of the valley during 6-5 ka BP. However, the distribution of the land use contracted significantly, which is consistent with the changes in the archaeological sites during 5-4 ka BP. After 4 ka BP, the land use was widely distributed in the southern part of the valley, and the areas with high land use intensities more frequently appeared in the areas around 42°N from west to east. Overall, the significant differences in the land use distribution in the east-west direction were disrupted.
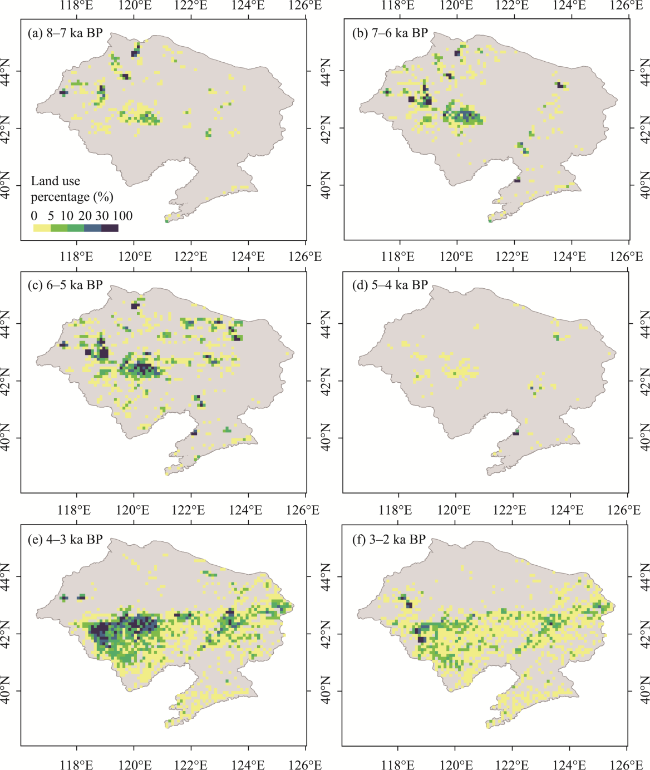
Figure 3 Spatial changes in human land use reconstructed in the Liaohe River Valley using the PLUM: (a) during 8-7 ka BP; (b) during 7-6 ka BP; (c) during 6-5 ka BP; (d) during 5-4 ka BP; (e) during 4-3 ka BP; (f) during 3-2 ka BP
Currently, the human land use within the Liaohe River Valley accounts for about 39% of the total area (https://www.geodata.cn/), while based on the reconstruction conducted using the PLUM, it only accounted for 3% of the area from 8 to 2 ka BP, which indicates that prehistoric human activity intensity was low before 2 ka BP. However, after 4 ka BP, the spatial pattern of the land use distribution became similar to the current pattern (https://www. geodata.cn/). It should be noted that our population and human land use reconstructions based on the discovered archaeological sites in the Liaohe River Valley only reveal the lower limits of the actual human activity during the prehistoric period because fluvial erosion, human disturbances, and other taphonomic factors also affect the preservation of archaeological sites.

5 Discussion

5.1 Comparison with previous land use reconstructions

The history database of the global environment version 3.2 (HYDE3.2) and the Global Land Use and Environment Lab (GLUE) database have been widely utilized to quantitatively reconstruct the cultivated land use during the Holocene (Lemmen, 2009; Goldewijk et al., 2017). For HYDE3.2, the prehistoric land use area was calculated via extrapolations of the population and land use per capita during the historic period, while the land use distribution was reconstructed based on the modern distributions of the population and environmental variables (Goldewijk et al., 2017). The same principle for land use reconstruction was adopted for GLUE; however, for the GLUE dataset, the prehistoric population was estimated according to model simulations (Lemmen, 2009). From the temporal perspective, the reconstructions conducted using the PLUM (our study), HYDE3.2 (Goldewijk et al., 2017), and GLUE (Lemmen, 2009) have similar levels of land use size during 8-2 ka BP; however, the variations among the three reconstructions during this period were different (Figure 4a). An overall increase was revealed by the reconstructions of the PLUM and HYDE3.2, but the land use area was much lower in the reconstruction of HYDE3.2. Additionally, according to the HYDE3.2 reconstruction, the land use growth was persistent, while the PLUM reconstruction indicates that it temporarily decreased during 5-4 ka BP. Unlike the two reconstructions above, the GLUE reconstruction indicates that the land use area sharply increased during 5-4 ka BP, while it remained stable in the other periods (Figure 4a).
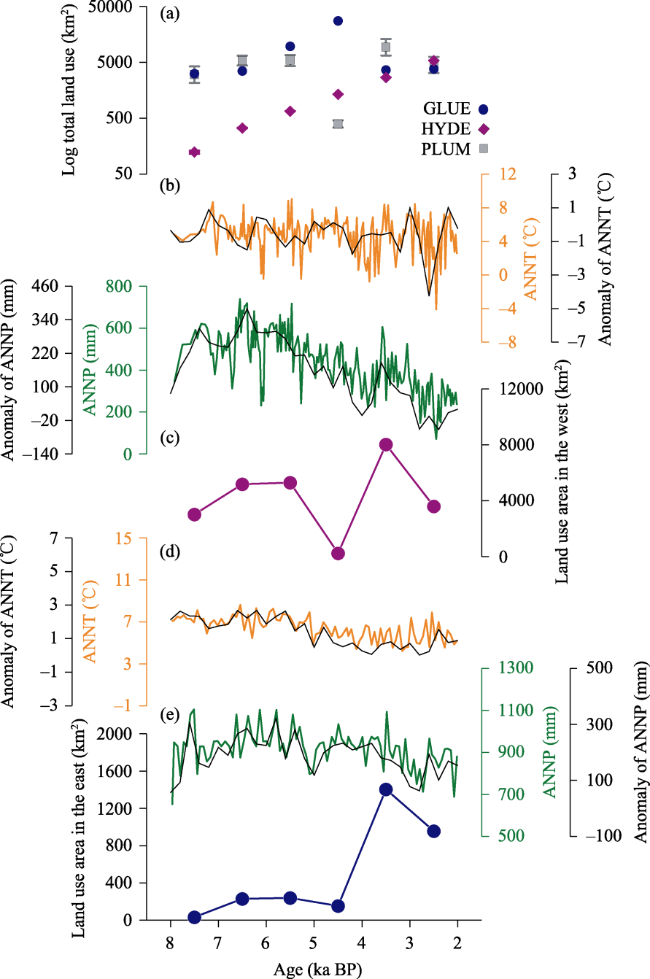
Figure 4 Correlations between the temporal changes in human land use and climatic factors in different parts of the Liaohe River Valley from 8 to 2 ka BP: (a) reconstructions of the land use areas in the Liaohe River Valley conducted in different studies (the ranges of the values are reflected by the minimum, average, and maximum values); (b) reconstructions of the absolute values and anomalies of the ANNT and ANNP (annual mean temperature and annual precipitation) relative to modern values based on pollen data for the western part of the valley; (c) reconstruction of the land use areas in the western part of the valley; (d) reconstruction of the absolute values and anomalies of the ANNT and ANNP relative to modern values based on pollen data in the eastern part of the valley; and (e) reconstruction of the land use areas in the eastern part of the valley.
Regarding the spatial changes, the distribution of the land use in the HYDE3.2 reconstruction indicates a continuous dependence on low elevation and sloping land, and the land use percentage was always higher in the plain areas in the middle and eastern parts of the Liaohe River Valley, which is consistent with the pattern during the recent period (Figure S3). The spatial resolution of the GLUE reconstruction is low, which indicates that there were no significant differences in the land use intensity throughout the valley (Figure S3). In contrast, our reconstruction using the PLUM indicates that the human land use areas were predominantly located in the relatively high-altitude areas in the western part of the valley in the earlier stages of the study period, while a pattern of north-south differentiation occurred during the later stage of the study period.
Figure S3 Distribution of reconstructed land use by HYDE and GLUE in the Liaohe River Valley from 8 to 2 ka BP
The adoption of direct prehistoric human activity evidences (archaeological sites) as control points in the PLUM improved the accuracy of the quantitative land use reconstruction because the properties of the archaeological sites (number, size, and distribution) can represent the differences in the population and land use efficiency on local scales, as well as human migration on large spatial scales. Compared with extrapolations of historical and modern human activity information to the prehistoric period conducted in previous studies, the temporal fluctuations and spatial variations in our land use reconstruction conducted using the PLUM are more reliable.
Our reconstruction results are also supported by previous studies of prehistoric human activity in and around the Liaohe River Valley based on various archaeological and geological records. For example, the analysis of starch residues revealed that the proportion of domesticated millet continuously increased in the western part of the Liaohe River Valley during the Neolithic period, indicating strengthening of agricultural activities (Ma et al., 2016). A geochemical study of an archeological site in the Liaohe River Valley revealed that human agricultural practices potentially caused the higher C4 biomass in the cultural layers during the process of millet domestication (Wang et al., 2020). Different pollen records in and around the Liaohe River Valley have also revealed that disturbances of vegetation caused by early human activities began as early as 6000 years ago and intensified since 4 ka BP at local and regional scales, while the high correlation between the microfossil charcoal influx and the occurrence of crop remains indicates that human burning was an important means of vegetation clearance and agriculture development (Li et al., 2006; Yang et al., 2020; Niu et al., 2024). Spatial differences in the human activity intensity have also been revealed through synthesis research on pollen records (Ren, 2000; Li et al., 2020), and the results of these studies indicate the expansion of agriculture from the western part of the valley to the eastern part. Compared with the above semi-quantitative studies, the series of spatially continuous maps of human land use reconstructed using the PLUM in this study is favorable for better quantitative evaluation of the changes in human activity from the spatiotemporal perspective.

5.2 Roles of climatic factors in the evolution of the prehistoric land use pattern

In our study, the residential and cultivated human land use areas were reconstructed using the PLUM; however, the cultivated land use accounted for over 99% of the total human land use in the Liaohe River Valley during 8-2 ka BP. Because different crop types have suitable temperature and precipitation ranges for growth (Zhou et al., 2020), the distribution and size of the cultivated land use areas in the valley were directly related to changes in the climatic condition.
According to crop seed remains from archaeological sites (Ma et al., 2016), millet was the main crop cultivated in the Liaohe River Valley during the prehistoric period, and the optimum climatic conditions for its growth are 500-750 mm of precipitation and more than 60 days with temperatures >16°C in 1 year (Zhou et al., 2020). Regarding the modern temperature and precipitation distributions, almost the entire Liaohe River Valley falls within the optimum temperature range for millet cultivation (Figure 5a), while only the southern and central-eastern parts of the valley fall within the optimum precipitation range (Figure 5b). Therefore, the variations in temperature and precipitation during 8-2 ka BP would have affected the distribution of the millet cultivation areas. Paleoclimate reconstructions based on pollen records in and around the valley have revealed that it was warmer and wetter during 8-2 ka BP than in modern times (Xu et al., 2010; Stebich et al., 2015), and thus the temperature was not the restricting factor for regional millet cultivation. However, the land use distribution was potentially sensitive to changes in precipitation in the valley. This deduction is confirmed by the comparisons of the time series and spatial evolutions of the reconstructed land use, temperature, and precipitation between 8 and 2 ka BP in different parts of the Liaohe River Valley (Figures 4b-4e and 5c-5f).
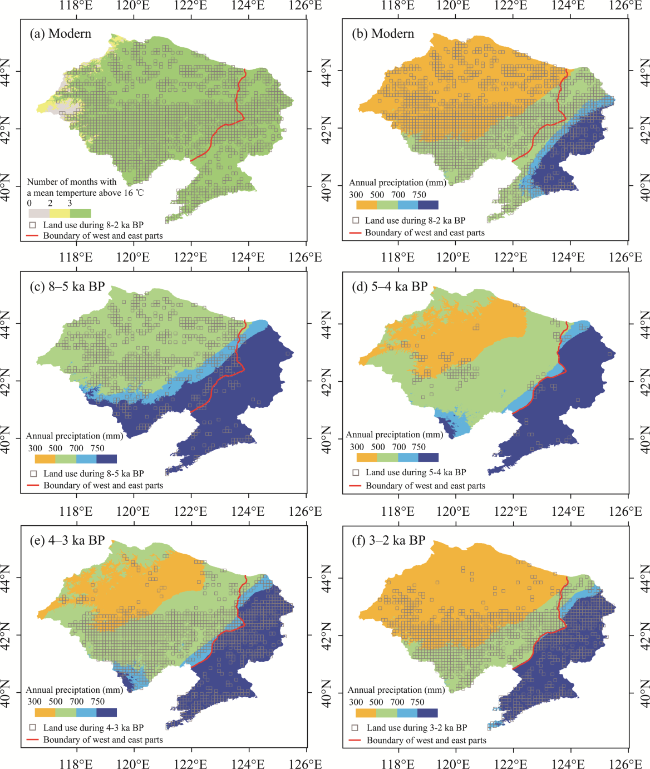
Figure 5 Spatial distribution of climatic factors and human land use in the Liaohe River Valley during (a) 8-2 ka BP; (b) 8-2 ka BP; (c) 8-5 ka BP; (d) 5-4 ka BP; (e) 4-3 ka BP; (f) 3-2 ka BP
From the temporal perspective, synchronous changes in human land use and precipitation occurred in both the western and eastern parts of the valley during 8-2 ka BP, while the variations in temperature were insignificant in both parts of the valley. In addition, the decreases of land use occurred in both parts of the valley during 5-4 ka BP; however, the more obvious decrease in the land use area in the western part of the valley than in the eastern part of the valley also corresponded to the different levels of precipitation decline in the two parts of the valley (Figure 4).
From the spatial perspective, the comparisons of the reconstructed spatial distributions of the climatic factors and land use areas during the different millennia further revealed that the ranges of human activity corresponded well with the optimum range of precipitation for millet cultivation during 8-3 ka BP. Before 5 ka BP, the optimum range of precipitation for millet cultivation mainly occurred in the western part of the valley, and this part of the valley also had a high human land use intensity (Figure 5c). After 5 ka BP, the land use distribution patterns changed obviously around 5-4 ka BP, and the core regions of land use shifted from the western part of the valley to the southern part of the valley (Figure 3). This shift was directly related to the retreat of the optimum precipitation range in the northwestern part of the valley, and the northern boundary of the area with a high percentage of land use coincided with the area with the optimum precipitation range for millet cultivation in the western part of the valley during 5-3 ka BP (Figures 5d and 5e). In the eastern part of the valley, the human land use widely and quickly expanded after 4 ka BP, and the precipitation conditions were higher than the optimal range for millet cultivation in this region; therefore, the regional land use expansion was potentially accelerated by the population pressure from the western valley at this time. In addition, the further aridification in the western part of the valley after 3 ka BP did not significantly affect the range of the land use distribution, which may have been due to some of the non-climatic factors, such as the transition between different subsistence strategies and the development of agricultural technology (Su and Chen, 2008; Jia et al., 2016b; Zheng et al., 2021).
The strong correlations between climate change and prehistoric human activity in the Holocene have been revealed in many previous studies conducted in and around the Liaohe River Valley (Hu et al., 2002; Jia et al., 2017; Guo et al., 2018; Zhao et al., 2019; Zheng et al., 2021; Wang et al., 2024). In the western part of the Liaohe River Valley, the significant decrease in the human activity intensity during 5-4 ka BP has always been attributed to the change in the climate to colder and drier conditions in accordance with more frequent wind and sand activity (Hu et al., 2002; Guo et al., 2018). In the eastern part of the valley, the responses of the regional hydrological conditions to climate changes have been concluded to be a direct driver of the human activity distribution (Zhao et al., 2019). In addition to climatic factors, previous studies have also clarified the roles that non-climatic factors played in the evolution of the human activity in this region. For example, the unbalanced distribution of the human activity between the northern and southern parts of the Liaohe River Valley during 8-2 ka BP (especially after 4 ka BP) was also related to the migration of the population from the Yellow River Valley (Hu et al., 2002; Leipe et al., 2019). In addition, the pattern of human activity was sometimes determined by the subsistence strategies of the society, which were further affected by the different environmental conditions (e.g., the landforms and water system) (Jia et al., 2016a; Wang et al., 2016; Zhao et al., 2019). Compared with previous studies, our study provides not only comparisons of the temporal curves for different climate and human activity variables from the qualitative perspective but also a series of maps that illustrate the spatial reactions of prehistoric human activity to climate change from the quantitative perspective. Furthermore, we clarified that precipitation was the key climatic factor affecting the changes in the human activities in the valley.

6 Conclusions

In this study, the prehistoric land use in the Liaohe River Valley in northeast China was quantitatively reconstructed based on archaeological data and the PLUM model, and the roles that climatic factors played in the temporal and spatial changes in the land use in the study area from 8 to 2 ka BP were also determined. Before 5 ka BP, the human land use was mostly distributed in the areas within the optimum precipitation range in the western part of the valley. During 5-4 ka BP, the contraction of the land use corresponded to the retreat of the precipitation optimum range in the western valley. After 4 ka BP, the land use significantly expanded in the southern part of the valley, and its northern boundary also coincided with the distribution of the optimum precipitation range; however, the impacts of climatic factors on the evolution of the land use decreased during 3-2 ka BP because of the enhanced effect of cultural factors.
Overall, the introduction of archaeological data to the PLUM improves the accuracy of prehistoric human activity intensity reconstructions from the spatiotemporal perspective, and the spatially continuous land use distribution output by the model enables semi-quantitative evaluation of the relationships between climatic factors and the land use area distributions. However, it should be noted that the precision of the input data and parameters (e.g., altitude, distance to the river system, and yield and fallow periods) for the PLUM still needs to be improved. In addition to cultivation, other types of human lifestyle and production should be considered in the PLUM to obtain more reliable land use per capita data for estimation of the land use area.
In the future, as the completeness of the archeological database and the PLUM model are improved, quantitative prehistoric land use reconstruction can be conducted on larger regional scales. The results our study provide an important reference for understanding the responses of human activities to climate change and the impact of human activities on global change from the spatiotemporal perspective.
[1]
Araus J L, Slafer G A, Buxó R et al., 2003. Productivity in prehistoric agriculture: Physiological models for the quantification of cereal yields as an alternative to traditional approaches. Journal of Archaeological Science, 30(6): 681-693.

[2]
ArchaeoGLOBE Project, 2019. Archaeological assessment reveals Earth’s early transformation through land use. Science, 365: 897-902.

[3]
Bevan A, Colledge S, Fuller D et al., 2017. Holocene fluctuations in human population demonstrate repeated links to food production and climate. Proceedings of the National Academy of Sciences of the United States of America, 114: E10524-E10531.

[4]
Blaauw M, 2010. Methods and code for ‘classical’ age-modelling of radiocarbon sequences. Quaternary Geochronology, 5: 512-518.

[5]
Davis B A S, Brewer S, Stevenson A C et al., 2003. The temperature of Europe during the Holocene reconstructed from pollen data. Quaternary Science Reviews, 22: 1701-1716.

[6]
Dong G H, Liu F W, Chen F H, 2017. Environmental and technological effects on ancient social evolution at different spatial scales. Science China: Earth Sciences, 60(12): 2067-2077.

[7]
Fyfe R, Roberts N, Woodbridge J, 2010. A pollen-based pseudobiomisation approach to anthropogenic land-cover change. The Holocene, 20(7): 1165-1171.

[8]
Gao Z Y, Min H Y, 2008. A study on the changes of human land relations of the Dulong Ethnic Group in the 20th century. Frontline of Thought, (4): 31-35. (in Chinese)

[9]
Goldewijk K K, Beusen A, Doelman J et al., 2017. Anthropogenic land use estimates for the Holocene: HYDE 3.2. Earth System Science Data, 9: 927-953.

[10]
Goldewijk K K, Beusen A, Van Drecht G et al., 2011. The HYDE 3.1 spatially explicit database of human-induced global land-use change over the past 12,000 years. Global Ecology and Biogeography, 20: 73-86.

[11]
Guo L C, Xiong S F, Ding Z L et al., 2018. Role of the mid-Holocene environmental transition in the decline of late Neolithic cultures in the deserts of NE China. Quaternary Science Reviews, 190: 98-113.

[12]
Guo W T, 1994. Research on the History of Chinese Farming System. Nanjing: Hohai University Press. (in Chinese)

[13]
He F N, Li K, Liu H L, 2010. The influence of historical climate change on agriculture in ancient China. Geographical Research, 29(12): 2289-2297. (in Chinese)

[14]
He K Y, Lu H Y, Zhang J P et al., 2022. Holocene spatiotemporal millet agricultural patterns in northern China: A dataset of archaeobotanical macroremains. Earth System Science Data, 14: 4777-4791.

[15]
Hu J M, Cui H T, Li Y Y, 2002. Reconstruction of the evolution history of man-land system since the Holocene in the Xiliao River Basin. Scientia Geographica Sinica, 22(5): 535-542. (in Chinese)

DOI

[16]
Hu Y W, Wang S G, Luan F S et al., 2008. Stable isotope analysis of humans from Xiaojingshan site: Implications for understanding the origin of millet agriculture in China. Journal of Archaeological Science, 35: 2960-2965.

[17]
Jia X, Lee H F, Zhang W C et al., 2016a. Human-environment interactions within the West Liao River Basin in northeastern China during the Holocene Optimum. Quaternary International, 426: 10-17.

[18]
Jia X, Sun Y G, Wang L et al., 2016b. The transition of human subsistence strategies in relation to climate change during the Bronze Age in the West Liao River Basin, Northeast China. The Holocene, 26(5): 781-789.

[19]
Jia X, Yi S W, Sun Y G et al., 2017. Spatial and temporal variations in prehistoric human settlement and their influencing factors on the south bank of the Xar Moron River, northeastern China. Frontiers of Earth Science, doi: 10.1007/s11707-016-0572-5.

[20]
Juggins S, 2020. Rioja: Analysis of Quaternary science data. https://cran.r-project.org/package=rioja

[21]
Kaplan J O, Krumhardt K M, Ellis E C et al., 2011. Holocene carbon emissions as a result of anthropogenic land cover change. The Holocene, 21: 775-791.

[22]
Leipe C, Long T, Sergusheva E A et al., 2019. Discontinuous spread of millet agriculture in eastern Asia and prehistoric population dynamics. Science Advances, 5: eaax6225.

[23]
Lemmen C, 2009. World distribution of land cover changes during pre- and protohistoric times and estimation of induced carbon releases. Géomorphologie: Relief, Processus, Environnement, 4: 303-312.

[24]
Li F Y, 2020. Towards quantification of Holocene anthropogenic land-cover change in temperate China: A review in the light of pollen-based REVEALS reconstructions of regional plant cover. Earth-Science Reviews, 203: 103119.

[25]
Li Q, Wu H B, Yu Y Y et al., 2019. Large-scale vegetation history in China and its response to climate change since the Last Glacial Maximum. Quaternary International, 500: 108-119.

[26]
Li Y Y, Willis K J, Zhou L P et al., 2006. The impact of ancient civilization on the northeastern Chinese landscape: palaeoecological evidence from the Western Liaohe River Basin, Inner Mongolia. The Holocene, 16(8): 1109e1121.

[27]
Luan Y J, Yu Y Y, Yin H Y, 2024. Spatiotemporal changes in prehistoric land use in upper and middle reaches of Yellow River Valley. Land, 13(6): 784.

[28]
Ma Z K, Yang X Y, Zhang C et al., 2016. Early millet use in West Liaohe area during early-middle Holocene. Science China Earth Sciences, 59: 1554-1561,

[29]
Marsicek J, Shuman B N, Bartlein P J et al., 2018. Reconciling divergent trends and millennial variations in Holocene temperatures. Nature, 554: 92-96.

[30]
Meng W, Zhang Y, Zheng B H, 2007. Study of aquatic ecoregion in Liao River Basin. Acta Scientiae Circumstantiae, 27(6): 911-918. (in Chinese)

[31]
National Heritage Board, 1993. Atlas of Chinese Cultural Relics:Jilin Branch. Beijing: China Map Publishing House. (in Chinese)

[32]
National Heritage Board, 2003. Atlas of Chinese Cultural Relics:Inner Mongolia Branch. Xi’an: Xi’an Map Publishing House. (in Chinese)

[33]
National Heritage Board, 2009. Atlas of Chinese Cultural Relics:Liaoning Branch. Xi’an: Xi’an Map Publishing House. (in Chinese)

[34]
National Heritage Board, 2013. Atlas of Chinese Cultural Relics:Hebei Branch. Beijing: Cultural Relics Publishing House. (in Chinese)

[35]
Niu H B, Sun Y H, Wang J Y et al., 2024. Drivers of land cover and plant compositional changes in Northeast China since the mid-Holocene: Climate versus human activities. Journal of Archaeological Science, 163: 105938.

[36]
Olofsson J, Hickler T, 2008. Effects of human land-use on the global carbon cycle during the last 6,000 years. Vegetation History and Archaeobotany, 17: 605-615.

[37]
Overpeck J T, Webb T III, Prentice I C, 1985. Quantitative interpretation of fossil pollen spectra: Dissimilarity coefficients and the method of modern analogs. Quaternary Research, 23: 87-108.

[38]
Peyron O, Guiot J, Cheddadi R et al., 1998. Climatic reconstruction in Europe for 18,000 yr B.P. from pollen data. Quaternary Research, 49: 183-196.

[39]
Prentice I C, Cramer W, Harrison S P et al., 1992. A global biome model based on plant physiology and dominance, soil properties and climate. Journal of Biogeography, 19: 117-134.

[40]
Ralf S, Stefan K, Edgar P et al., 2022. Agriculture and food security under a changing climate: An underestimated challenge. iScience, 25(12): 105551.

[41]
Reimer P J, Austin W E N, Bard E et al., 2020. The IntCal20 Northern Hemisphere radiocarbon age calibration curve (0-55 cal kBP). Radiocarbon, 62: 725-757.

DOI

[42]
Ren G Y, 2000. Decline of the mid- to late Holocene forests in China: Climatic change or human impact? Journal of Quaternary Science, 15(3): 273-281.

[43]
Ren X L, Xu J J, Wang H et al., 2021. Holocene fluctuations in vegetation and human population demonstrate social resilience in the prehistory of the Central Plains of China. Environmental Research Letters, 16(5): 055030.

[44]
Simpson G L, 2012. Analogue methods in palaeolimnology. In: Tracking Environmental Change Using Lake Sediments. Springer, 495-522.

[45]
Song Z L, 1982. The agriculture of the Mosuo people by the Lugu Lake. Agriculture Archaeology, 1: 114-121, 196. (in Chinese)

[46]
Stebich M, Rehfeld K, Schlützet F et al., 2015. Holocene vegetation and climate dynamics of NE China based on the pollen record from Sihailongwan Maar Lake. Quaternary Science Reviews, 124: 275-289.

[47]
Su L, Chen F, 2008. Characteristics analysis of Chinese traditional agricultural technology evolution. Chinese Agricultural Science Bulletin, 24(4): 472-478. (in Chinese)

[48]
Sugita S, 2007. Theory of quantitative reconstruction of vegetation (I): Pollen from large sites REVEALS regional vegetation. The Holocene, 17: 229-241.

[49]
Wang C, Lu H Y, Zhang J P et al., 2014. Prehistoric demographic fluctuations in China inferred from radiocarbon data and their linkage with climate change over the past 50,000 years. Quaternary Science Reviews, 98: 45-59.

[50]
Wang J, Zhou X Y, Xu H et al., 2020. Relationship between C4 biomass and C4 agriculture during the Holocene and its implications for millet domestication in Northeast China. Geophysical Research Letters, 48: e2020GL089566.

[51]
Wang J H, 2011. Study on the Prehistoric Population in the Middle and Lower Reaches of the Yellow River. Beijing: Science Press. (in Chinese)

[52]
Wang J Y, Yan A, Jie D M et al., 2024. Middle to late Holocene human societies on the eastern margin of the Eurasian Steppe, and their adaptation to environmental changes. Palaeogeography, Palaeoclimatology, Palaeoecology, 649: 112331.

[53]
Wang L, Wu H, Jia X, 2016. Study on the temporal-spatial evolution of prehistoric settlements and its correlation with subsistence strategy and climate history in the Western Liao River area. Advances in Earth Science, 31(11):1159-1171. (in Chinese)

DOI

[54]
Wu H, 1985. Research on Grain Yield per mu in Chinese History. Beijing: Agricultural Publishing House. (in Chinese)

[55]
Wu R K, 1995. Thoughts on the whole course of human evolution. Acta Anthropologica Sinica, 14(4): 285-296. (in Chinese)

[56]
Xiao J L, Xu Q H, Nakamura T et al., 2004. Holocene vegetation variation in the Daihai Lake region of north-central China: a direct indication of the Asian monsoon climatic history. Quaternary Science Reviews, 23: 1669-1679.

[57]
Xu Q H, Xiao J L, Li Y C et al., 2010. Pollen-based quantitative reconstruction of Holocene climate changes in the Daihai Lake area, Inner Mongolia, China. Journal of Climate, 23: 2856-2868.

[58]
Yang Q J, Zhou X Y, Zhao C et al., 2020. Human occupation, slash-burning and vegetation response from the final Pleistocene to the middle Holocene, Daling River Basin, NE China. Review of Palaeobotany and Palynology, 275: 104158.

[59]
Yang Q Y, Chen Z T, Xin G X et al., 2018. The historical evolution of Chinese cultivation system and some thoughts on the current land fallow and crop rotation policy. West Forum, 28(2): 1-8. (in Chinese)

[60]
Yu J, Yu Y Y, Wu H B et al., 2022. Spatiotemporal changes in early human land use during the Holocene throughout the Yangtze River Basin, China. The Holocene, 32(4): 334-345.

[61]
Yu Y Y, Guo Z T, Wu H B et al., 2012. Reconstructing prehistoric land use change from archeological data: Validation and application of a new model in Yiluo valley, northern China. Agriculture, Ecosystems & Environment, 156: 99-107.

[62]
Yu Y Y, Wu H B, Finke P et al., 2016. Spatial and temporal changes of prehistoric human land use in the Wei River valley, northern China. The Holocene, 26(11): 1788-1801.

[63]
Zhang P Z, Cheng H, Edwards R L et al., 2008. A test of climate, sun, and culture relationships from an 1810-year Chinese cave record. Science, 322: 940-942.

DOI PMID

[64]
Zhao Q, Yao T, Lu D et al., 2019. Spatial and temporal distribution characteristics and natural environmental background of the middle Holocene settlements in the northeastern Liaoning province. Scientia Geographica Sinica, 39(9): 1516-1524. (in Chinese)

DOI

[65]
Zhao Z J, 2005. Discussion on Chinese dry crop agriculture from flotation results in Xinglonggou Site. In: Department of Cultural Relics and Museology (ed.). Dongya Guwu. Beijing: Cultural Relics Press, 188-199. (in Chinese)

[66]
Zheng C G, Zhu C, Zhong Y S et al., 2008. The temporal and spatial distribution of archeological sites and natural environment from Paleolithic Age to Tang and Song dynasties in reservoir region of Chongqing. Chinese Science Bulletin, 53: 93-111. (in Chinese)

[67]
Zheng Y F, Sun G P, Qin L et al., 2009. Rice fields and modes of rice cultivation between 5000 and 2500 BC in east China. Journal of Archaeological Science, 36(12): 2609-2616.

[68]
Zheng Y H, Yu S Y, Fan T Y et al., 2021. Prolonged cooling interrupted the Bronze Age cultures in northeastern China 3500 years ago. Palaeogeography, Palaeoclimatology, Palaeoecology, 574: 110461.

[69]
Zheng Z, Wei J H, Huang K Y et al., 2014. East Asian pollen database: modern pollen distribution and its quantitative relationship with vegetation and climate. Journal of Biogeography, 41: 1819-1832.

[70]
Zhou X Y, Lin Z, Spengler R N et al., 2020. Water management and wheat yields in ancient China: Carbon isotope discrimination of archaeological wheat grains. The Holocene, 31(2): 285-293.

Outlines

/