Special Issue: Human, Civilization Evolution and Environmental Interaction

Late Pleistocene vegetation succession, climate change and hominin adaptation in Sandinggai site, central South China

  • LU Lili , 1 ,
  • ZHAO Keliang , 1, 5, 6, * ,
  • LI Yiyuan 2 ,
  • LI Hao 3 ,
  • LIU Junchi 1 ,
  • BAI Guangyi 1, 6 ,
  • XIAO Peiyuan 3 ,
  • YANG Qingjiang 4 ,
  • LI Xiaoqiang 1, 6
Expand
  • 1. Key Laboratory of Vertebrate Evolution and Human Origins, Institute of Vertebrate Paleontology and Paleoanthropology, CAS, Beijing 100044, China
  • 2. Hunan Provincial Institute of Cultural Relics and Archaeology, Changsha 410008, China
  • 3. State Key Laboratory of Tibetan Plateau Earth System, Resources and Environment (TPESER), Institute of Tibetan Plateau Research, CAS, Beijing 100101, China
  • 4. College of Resources and Environment, Chengdu University of Information Technology, Chengdu 610041, China
  • 5. Australian Research Centre for Human Evolution, Griffith University, Brisbane QD 4111, Australia
  • 6. Department of Earth and Planetary Science, University of Chinese Academy of Sciences, Beijing 100049, China
*Zhao Keliang (1982-), PhD and Professor, specialized in environmental archaeology and Quaternary environmental change research. E-mail:

Lu Lili (1993-), PhD, specialized in environmental archaeology. E-mail:

Received date: 2024-09-03

  Accepted date: 2025-02-12

  Online published: 2025-09-04

Supported by

National Natural Science Foundation of China(42471185)

National Natural Science Foundation of China(T2192952)

National Key Research and Development Program of China(2022YFF0801502)

Abstract

The paleoenvironmental changes and adaptation strategies of hominins during the Late Pleistocene are crucial for understanding the evolution, dispersal, and behavioral shifts of early modern humans. Despite South China’s significance as a nexus for hominin dispersal and handaxe technology diffusion, quantitative reconstructions of paleoenvironments linked to archaeological records remain scarce. The Sandinggai site (96.6-13.3 ka BP) in central South China, with its well-preserved stratigraphy and abundant lithic artefacts, is notable for providing valuable insights. In this study, quantitative reconstruction of the vegetation succession and climate change sequences at the site was conducted using palynological and isotopic data. The results indicated a shift from a warm-temperate evergreen and deciduous broadleaf mixed forest to a temperate deciduous broadleaf forest, with the climate transitioning from warm and humid to cooler and drier conditions. During the early phase, an increase in lithic production suggested favorable conditions for hominin survival. In the later phase, decreased lithic production and the replacement of large handaxe tools by smaller flake tools, indicated that hominins adapted to the cooler, drier climate and more open landscapes through lithic miniaturization. These findings highlight the environment-driven adaptation of lithic technology and hominin behavior, thereby shedding light on human survival adaptation strategies.

Cite this article

LU Lili , ZHAO Keliang , LI Yiyuan , LI Hao , LIU Junchi , BAI Guangyi , XIAO Peiyuan , YANG Qingjiang , LI Xiaoqiang . Late Pleistocene vegetation succession, climate change and hominin adaptation in Sandinggai site, central South China[J]. Journal of Geographical Sciences, 2025 , 35(8) : 1642 -1666 . DOI: 10.1007/s11442-025-2387-3

1 Introduction

The hominin living environments and their environmental adaptation strategies are key issues in archaeology and paleoenvironmental studies (Darwin, 1871; deMenocal, 2011; Potts et al., 2020; Cohen et al., 2022; Plummer et al., 2023). Understanding these aspects not only illuminates how hominins adjusted their behaviors, migrations, and technologies in response to changing climatic conditions (Hou et al., 2000; Scerri et al., 2018) but also reveals the pivotal role of environmental pressures in shaping human cultural and biological evolution (Potts, 1998; Yue et al., 2021).
The Late Pleistocene represents a critical era for human evolution and cultural transformation (Liu et al., 2015; Bae et al., 2017; Hu et al., 2019; Zhang et al., 2022; Yang et al., 2024). During this period, early modern humans spread across the globe from Africa (Bae et al., 2017), resulting in a high diversity of hominin fossils and stone artefacts in East Asia. The Late Pleistocene was characterized by significant climatic fluctuations, including multiple glacial and interglacial cycles (Wang et al., 2001) and several millennial-scale climatic events (Held et al., 2024), which had profound impacts on human migration, settlement, and subsistence strategies (Higham et al., 2014; Yue et al., 2020; Cohen et al., 2022).
Due to its unique geographic location and complex climatic conditions, South China served as a crucial area for the survival and dispersal of early modern humans (Figure 1a, Bae et al., 2017; Li, 2022), as well as the transmission and distribution of handaxe technology during the Late Pleistocene (Figure 1a, Li et al., 2024), and therefore has become an ideal region for studying the survival environments of hominins and their strategies for environmental adaptation. However, previous research on the hominin habitats in this area has often been qualitative (Jin et al., 2009; Li et al., 2017; Li et al., 2019b; Guo et al., 2024). For instance, the discovery of early modern human teeth dating to 120-80 ka BP at Fuyan Cave in Daoxian, Hunan (Liu et al., 2015), prompted Li et al. (2019b) to qualitatively analyze the survival environment using geochemical methods, suggesting a warm and humid forest environment. In Zhiren Cave, Guangxi, the discovery of early modern human fossils dating to approximately 100 ka BP (Liu et al., 2010), along with associated mammalian fossils primarily composed of tropical-subtropical species, revealed a relatively dry environment with more grassland-type animals compared to the forest-type (Jin et al., 2009). Similarly, early modern humans at Luna Cave, Guangxi (120-70 ka BP, Bae et al., 2014) inhabited a C3-dominated forest with a warm and humid climate (Li et al., 2017; Huang et al., 2020). The lack of quantitative reconstructions of vegetation and climate has hindered a comprehensive and profound understanding of human adaptations to environmental changes in the Late Pleistocene.
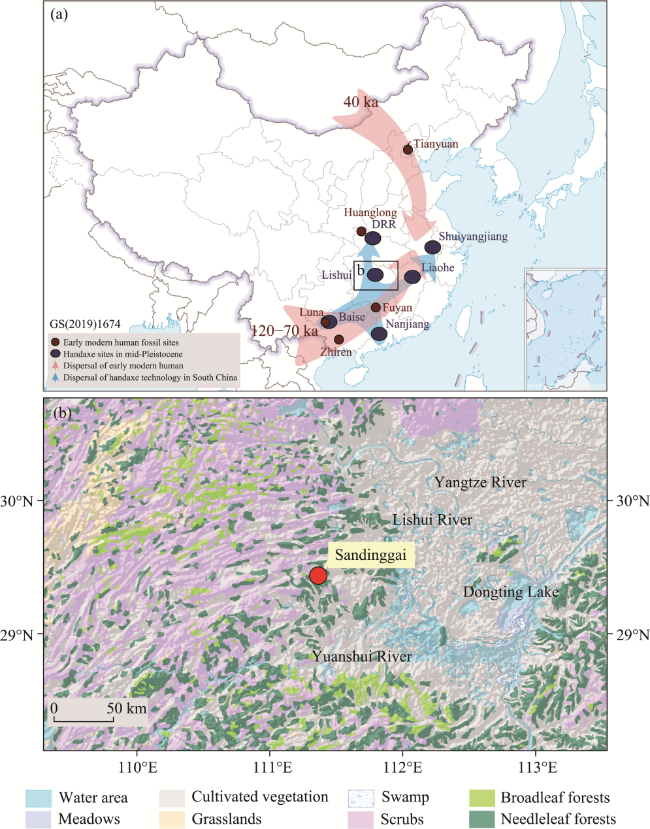
Figure 1 Distribution of early modern humans and handaxe technology in southern China and the geographical location of the Sandinggai site (a. Red dots indicate representative fossil sites of early modern humans in China during the Late Pleistocene (Shang et al., 2007; Liu et al., 2010; Liu et al., 2015; Bae, 2017), and red arrows represent their possible diffusion routes (Bae et al., 2017). Blue ovals indicate representative sites of handaxe technology from the Middle to Late Pleistocene in southern China (Li and Xu, 1991; Hou et al., 2000; Dong et al., 2019; Li et al., 2022; Dai, 2023; Li and Song, 2023), with blue arrows showing their potential dispersal routes (Li et al., 2024); b. Geographic location of the Sandinggai site, displaying the surrounding topography and vegetation (Editorial Committee of China Vegetation Map CAS, 2001).)
The Sandinggai site, located in the Lishui River Region, lies in the core area of the southern tributaries of the middle Yangtze River (Figure 1b). This area connects the Jianghan Basin in the north, the Jiangnan Hills in the south, the lower Yangtze to the east, and the Yunnan-Guizhou Plateau to the west. It is not only adjacent to the transitional zone between North and South China but also lies between the central and western regions of South China, making it a key hub for cultural migration and exchange across the north-south and east-west directions of China (Li, 2020). As a representative Paleolithic site in South China, the Sandinggai features continuous and complete stratigraphy and abundant stone artefacts showing variations in both quantity and technology. Luminescence dating based on quartz and feldspar indicated that the site dates from approximately 96.6 ± 5.1 ka BP to 13.3 ± 0.3 ka BP (Li et al., 2022), spanning from MIS 5c to the end of the last deglacial period, thereby providing a continuous chronological framework for understanding changes in human survival environments and adaptation strategies in response to environmental changes.
In this study, the paleovegetation and paleoclimate sequences at the Sandinggai site were quantitatively reconstructed using palynological and isotopic evidence, tracing the changes in hominin living conditions. By integrating the shifts in the quantity and technology of stone artefacts over the continuous temporal sequence, insights were further provided into the driving factors behind the technological and behavioral changes of hominins, contributing to a better understanding of human adaptation to the Late Pleistocene environmental changes.

2 Materials and methods

2.1 Geographic setting

The Sandinggai site (29°25.70′N, 111°22.50′E, ~110 m asl.) is situated in Linli county, Changde City, Hunan Province. Geographically, it lies on the third terrace of the Daoshui River (a primary tributary of the Lishui River), with the Daoshui River and its tributaries flowing to the north and west of the site. The site is surrounded by hilly terrain (Figure 1b) and experiences a subtropical monsoon climate and distinct seasonal variations in temperature and precipitation. The mean annual temperature is 16.7°C, and the annual precipitation is 1650 mm (https://www.weather-atlas.com/zh/china/changde-climate). The natural vegetation predominantly consists of pure evergreen coniferous forests of Pinus massoniana (Pinaceae) and Cunninghamia lanceolata (Cupressaceae), subtropical deciduous broadleaf forests dominated by Betula luminifera (Betulaceae) and Populus adenopoda (Salicaceae), and subtropical evergreen-deciduous broadleaf shrubs dominated by Castanea seguinii (Fagaceae) and Quercus fabri (Fagaceae) (Editorial Committee of China Vegetation Map CAS, 2001).

2.2 Sampling

Excavations were conducted at Sandinggai in 2017 and 2019 respectively. Lithic, geochemical and palaeomagnetic data have been reported from the 2019 excavation trench (Li et al., 2022). The stratigraphic section sampled for this study is located approximately 2 m west of the excavation area dated by Li et al. (2022) (Figure 2a). The stratigraphy of these two sections is continuous, permitting comparisons of chronology, lithics, and other proxies. The topsoil thickness in this study is 5 cm, in contrast to 30 cm in the Li et al. (2022) excavation trench (Figure 2b).
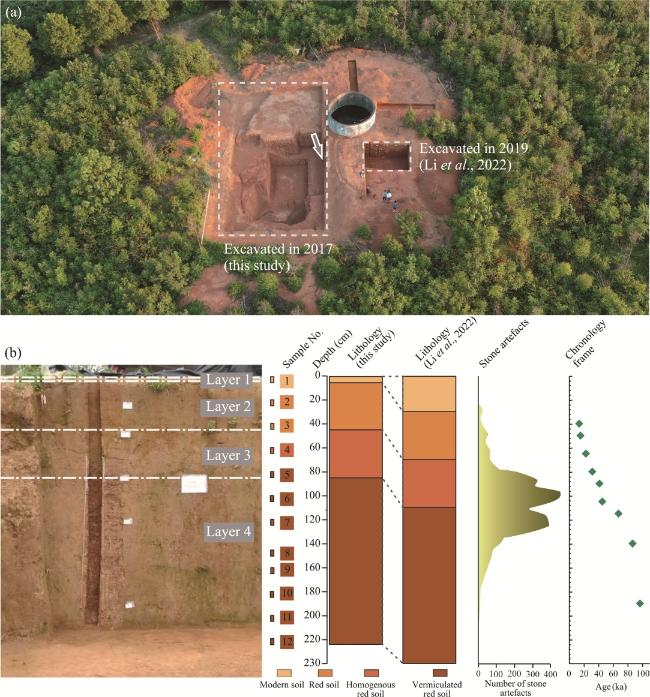
Figure 2 Basic information of sampling at the Sandinggai site (a. Location of excavated trenches, modified from Li et al. (2022). The arrow indicates the sampling section of this study. b. Stratigraphy, lithology, pollen samples, lithic artefact distribution, and chronological sequence (Li et al., 2022).)
The stratigraphy of this section is divided into four layers from top to bottom: Layer 1, 0-5 cm, topsoil; Layer 2, 5-45 cm, upper cultural layer, consisting of yellowish-red silty clay with few lithic artefacts; Layer 3, 45-85 cm, middle cultural layer, composed of homogenous reddish brown silty clay, with a gradual increase in lithic artefacts from top to bottom; Layer 4, 85-225 cm, lower cultural layer, featuring dark reddish brown silty clay, with a gradual decrease in lithic artefacts from top to bottom (Li et al., 2021; Li et al., 2022).
A total of 12 samples were obtained, spanning four stratigraphic layers (Figure 2). Layer 1 (modern topsoil): Sample 1; Layer 2 (upper cultural layer): Samples 2-3; Layer 3 (middle cultural layer): Samples 4-5; Layer 4 (lower cultural layer): Samples 6-12.

2.3 Chronological framework

The present study profile differs from that of Li et al. (2022) by approximately 25 cm in depth due to the variation in topsoil thickness. The chronological framework of these two profiles is comparable because the stratigraphy below the topsoil layer is continuous. Optically Stimulated Luminescence (OSL) techniques can be well employed to date open-air sites in South China (Zhang et al., 2019). According to published OSL dating results (Li et al., 2022), the corresponding OSL depths and ages for this study were determined as follows: 15 cm (13.3 ± 0.3 ka), 25 cm (15 ± 0.5 ka), 40 cm (22.4 ± 0.6 ka), 55 cm (31.2 ± 3.4 ka), 65 cm (41 ± 4.6 ka), 80 cm (44.9 ± 7.2 ka), 90 cm (67.1 ± 2.6 ka), 115 cm (86.4 ± 4.1 ka), and 165 cm (96.6 ± 5.1 ka). These OSL dates were calibrated using the Bayesian age-depth model ‘rbacon 3.2.0’ R package, with the corresponding pollen sample chronological sequence inferred through sedimentation rates (Figure 3 and Table 1).
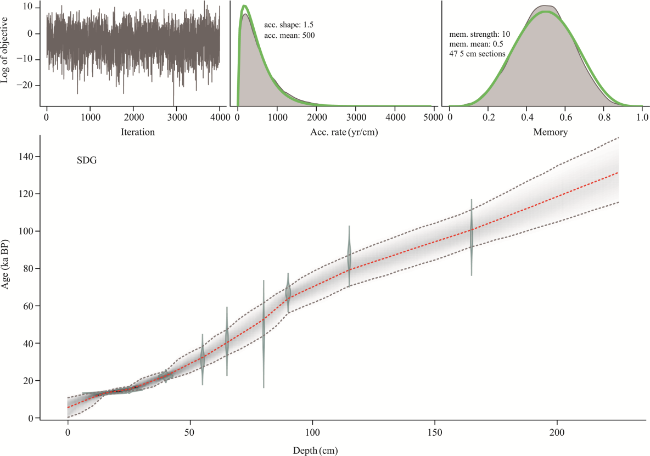
Figure 3 Age framework of pollen samples calculated using the Bacon age-depth model
Table 1 Depth, age, pollen counts and pollen concentration data for each sample from Sandinggai section
Sample No. Depth (cm) Age (ka) Sum (grains) Concentration (grains/g)
Layer 1 (0-5 cm) 1 5 9.355 436 4034
Layer 2 (5-45 cm) 2 25 15.313 341 32
3 45 25.808 427 31
Layer 3 (45-85 cm) 4 65 40.5 144 7
5 85 58.219 80 3
Layer 4 (85-225 cm) 6 105 73.098 134 5
7 125 83.486 189 4
8 150 94.172 107 3
9 165 100.53 428 16
10 185 110.489 70 2
11 205 120.67 37 1
12 225 130.921 35 1

2.4 Palynological analysis

2.4.1 Experimentation and identification

The samples were processed according to the standard palynological analysis method (SY/T 5915-2000) (China National Petroleum Corporation, 2000). Each sample, with an average weight of approximately 60 g, was prepared for pollen analysis. The samples were crushed to a particle size of approximately 0.5 mm and subsequently treated with hydrochloric acid (15% HCl) by slowly adding the acid until the reaction was complete. Next, hydrofluoric acid (HF) was gradually added until a full reaction occurred. The samples were boiled in dilute HCl and heated in a water bath for approximately 30 min. After boiling, the samples were sieved through a 7 µm screen. Finally, the treated material was collected by centrifugation at 2500 rpm for 10 min.
A tablet of Lycopodium spores (batch: 2,013,001; 27,560 ± 2643 spores/tablet) was added to each sample before treatment to calculate pollen concentration. At least 130 pollen grains were counted for eight samples and up to 100 pollen grains were counted in four samples, in addition to Lycopodium spores (Table 1), under a Leica DM 2500 light microscope at a magnification of 400×. Palynomorphs were identified by comparison with palynological monographs (Institute of Botany CAS, 1982; Wang et al., 1995). The relative abundance and pollen concentration were calculated, and the pollen diagram was plotted using TILIA 1.7.16 software. Pollen extraction and identification were conducted at the Institute of Vertebrate Paleontology and Paleoanthropology, Chinese Academy of Sciences.

2.4.2 Biomization

For pollen-based biome reconstruction, biome scores were calculated to identify potential vegetation types (Prentice et al., 1996; Ni et al., 2010; Ni et al., 2014). Pollen taxa were assigned to plant function types (PFTs) based on their ecological and biogeographical features (Table S1). Biomes were defined by their characteristic PFTs (Table S2). The affinity scores for all SDG pollen samples were calculated using formula (1):
A i k = j δ i j max 0 , p j k θ j
where Aik was the affinity score of the SDG pollen sample k for biome i; the summation was overall taxa j; δij was the entry for biome i and taxon j in the biome taxon matrix; pjk was the pollen percentages and j was a pollen percentage threshold (0.5%) (Prentice et al., 1996; Ni et al., 2010). Each pollen sample was assigned to the biome with the highest affinity score.

2.4.3 Principal Component Analysis

Principal Component Analysis (PCA) is a dimensionality reduction technique employed to identify a limited number of composite factors (i.e., principal components) to represent numerous variables, ensuring these factors reflect the original data as accurately as possible while remaining uncorrelated (Birks and Gordon, 1984). PCA was conducted using Origin Pro 2023 software on the ten pollen taxa with relative abundances of 1% or more (Pinus, Artemisia, Caryophyllaceae, Chenopodiaceae, Fabaceae, Liquidambar, Poaceae, Quercus, Ranunculaceae and Ulmus) to investigate the relationships between pollen samples, pollen assemblages, and environmental factors. Further analysis of nine major biomes was conducted (see Table S2 for details) to examine the relationships between pollen samples, biomes, and environmental factors.

2.4.4 Biodiversity evaluation

The abundant plant taxa within the forest likely provided diverse food sources during the hominin era. The plant diversity of each sample was assessed using palynological data to investigate the changes in plant diversity and its response to climatic change during the hominin habitation period. Plant diversity (Simpson index, Shannon-Wiener index, and Evenness index) in samples from varying depths was quantified using the community ecology package ‘vegan 2.6-4’ in R.

2.4.5 Quantitative climate reconstruction

Pollen data were analyzed using the coexistence approach (CoA, Mosbrugger and Utescher, 1997), and the following climatic parameters for the Sandinggai site: the mean annual temperature (MAT), to estimate mean warmest monthly temperature (MWMT), the mean coldest monthly temperature (MCMT), the temperature difference between the coldest and warmest months (DT), the mean annual precipitation (MAP), the mean maximum monthly precipitation (MMaP), and the mean minimum monthly precipitation (MMiP).
In the calculation of the numerical ranges of palaeoclimatic parameters using the CoA, reference was made to the mean annual temperature variation ranges of the nearest recent relatives (NRLs) of fossil plants in the Palaeoflora Database (http://www.geologie.uni-bonn. de/Palaeoflora_home.htm) alongside the modern climatic data of the distribution regions of each taxon (Wu and Ding, 1999) based on the Surface Meteorological Data of China (1951-1980) (IDoBM Center, 1983). Climatic data from all distribution areas of each taxon were then superimposed to calculate the range of climatic parameters. Finally, the coexistence intervals of the climatic parameters for all plant taxa were calculated.

2.5 Carbon isotopic analysis of organic matter

The same samples were utilized for isotope and pollen analyses in this study. The pre-treatment and analysis of stable carbon isotopes were performed at the Institute of Vertebrate Paleontology and Paleoanthropology, Chinese Academy of Sciences. To completely remove carbonates, the samples were ground, sieved, and treated with 2 mol/L HCl until effervescence ceased. The final reaction solution was tested with pH strips to confirm the absence of carbonates.
A total of 12 samples at an average spacing of ~20 cm were prepared for the δ13CTOC analysis. The samples were oven-dried at 40°C, ground to pass a 0.15 μm mesh, and treated with 2 mol/L HCl for 24 h to remove any inorganic carbonates. Samples with low organic matter content underwent HF enrichment. The samples were subsequently combusted for over 4 h at 900°C in sealed quartz tubes in the presence of Cu, CuO, and Ag foil. The released CO2 was purified via cryogenic distillation and measured using a Flash2000 elemental analyzer interfaced with a 253 Plus continuous flow isotope ratio mass spectrometer (IRMS). Standard reference materials, including Urea#1 (δ13C = -34.1‰, VPDB), Urea#2 (δ13C = -8.0‰, VPDB), Urea#3 (δ13C = 11.7‰, VPDB) and an international isotope reference material (IAEA-CH3; δ13C = -24.7‰, VPDB), were employed to ensure analytical accuracy, with a standard deviation for repeated δ13C measurements of less than ± 0.2‰.

3 Results

3.1 Pollen assemblages

The pollen assemblages of the stratigraphic section at the Sandinggai site were diverse and abundant, comprising 2428 pollen grains and representing 52 palynomorphs (Figures 4 and 5). 46 palynomorphs from 36 families of angiosperms (32.33%), with woody plants accounting for 10.17% (Quercus 1.85%, Liquidambar 1.31% and Ulmus 1.07%) and herbaceous plants for 22.16% (Artemisia 6.88%, Poaceae 4.16% and Chenopodiaceae 3.50%); and 6 palynomorphs from 4 families of gymnosperms (67.67%), with Pinus contributing 66.67%. The pollen assemblage suggested that the Sandinggai site was surrounded by a warm-temperate evergreen and deciduous broadleaf mixed forest, dominated by Quercus and Ulmus. Combined with the hilly terrain of the study area (Figure 1b), it could be inferred that the vegetation exhibited vertical zonation, with extensive Pinus forests at higher elevations, followed by deciduous broadleaf forests and evergreen-deciduous broadleaf mixed forests at lower elevations. Xerophytic taxa, including Artemisia, Chenopodiaceae, and Poaceae, were found in grasslands on sunny slopes of hillsides (Figures 4 and 5).
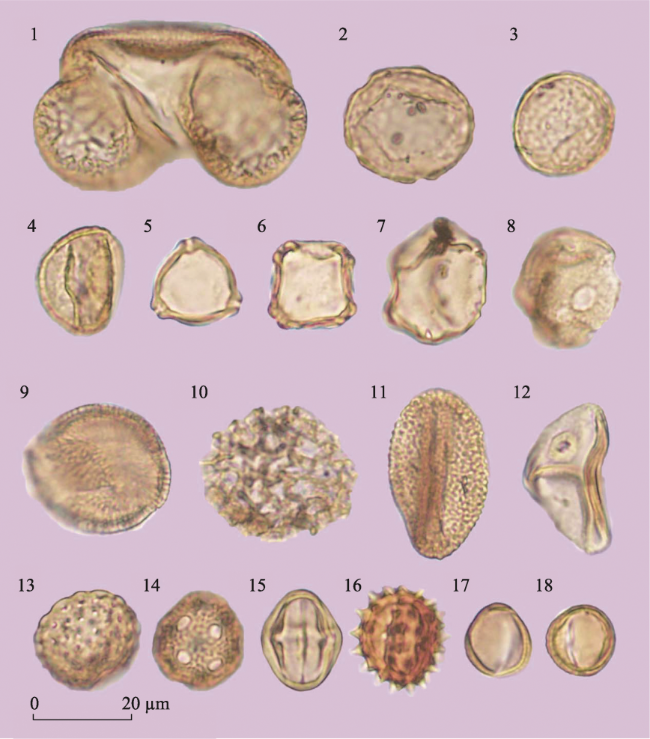
Figure 4 Major palynomorphs from the Sandinggai section (1. Pinus; 2-3. Ulmus; 4. Quercus; 5. Betula; 6. Alnus; 7. Juglans; 8. Liquidambar; 9. Hamamelidaceae; 10. Polygonum; 11. Fagopyrum; 12. Poaceae; 13. Chenopodiaceae; 14. Caryophyllaceae; 15. Rosaceae; 16. Asteraceae (excl. Artemisia); 17-18. Artemisia)
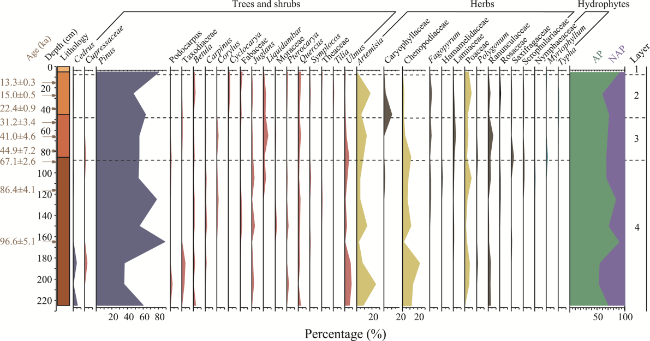
Figure 5 Diagram showing changes in the relative abundances of the major palynomorphs recovered from the Sandinggai section
The palynological sequence has been divided into four zones based on the four cultural layers (Figure 5):
Layer 4 (225-85 cm, 131-58 ka BP): A total of 1000 pollen grains were identified, with an average of 143 grains per sample and an average pollen concentration of 4 grains/g. The assemblage included 36 palynomorphs from 26 families of angiosperms (27.20%), with woody plants accounting for 8.60% (Ulmus 1.70%, Quercus 1.50% and Juglans 1.10%) and herbaceous plants accounting for 18.60% (Chenopodiaceae 6.20%, Artemisia 5.60% and Poaceae 3.20%); and 6 palynomorphs from 4 families of gymnosperms (72.80%), with Pinus contributing 71.40%. During this period, high forest coverage indicated by the presence of Pinus, Ulmus, Quercus, and Juglans, which were high tree taxa typical of the warm-temperate to temperate regions of the Northern Hemisphere, suggests a warm and humid environment.
Layer 3 (85-45 cm, 58-26 ka BP): A total of 244 pollen grains were identified, with an average of 122 grains per sample and an average pollen concentration of 5 grains/g. The assemblage included 18 palynomorphs from 15 families of angiosperms (43.75%), with woody plants accounting for 12.95% (Liquidambar 4.02%, Ulmus 2.68% and Quercus 2.23%) and herbaceous plants accounting for 30.80% (Artemisia 11.61%, Chenopodiaceae 5.80% and Ranunculaceae 4.91%); and 4 palynomorphs from 4 families of gymnosperms (56.25%), with Pinus contributing 54.91%. During this phase, the decrease in the relative abundance of Pinus pollen, a species adapted to cooler habitats, coupled with an increase in broadleaf woody plant pollen, suggests a warmer climate. Simultaneously, the increase in herbaceous pollen from drought-tolerant taxa indicates a reduction in humidity.
Layer 2 (45-5 cm, 26-13 ka BP): A total of 768 pollen grains were identified, with an average of 384 grains per sample, and a pollen concentration of 62 grains/g. This layer comprised 37 palynomorphs from 30 families of angiosperms (42.84%), with woody plants contributing 10.29% (Liquidambar 2.34% and Quercus 1.69%) and herbaceous plants contributing 32.55% (Artemisia 10.93%, Caryophyllaceae 6.64% and Chenopodiaceae 5.80%). Gymnosperms were represented by five palynomorphs from four families (57.16%), with Pinus constituting 56.25%. During this period, the increased relative abundance of Pinus pollen, alongside a reduction in broadleaf woody plant pollen, indicated a decline in temperature. Concurrently, the continued increase in drought-tolerant herbaceous pollen suggested further decreases in humidity. Overall, this pointed to a decrease in forest cover, increased vegetation openness, and a relatively cooler, drier climate.
Layer 1 (5-0 cm, 13 ka BP-Present): A total of 436 pollen grains were identified, with a pollen concentration of 4034 grains/g. This layer comprises 27 palynomorphs from 22 families of angiosperms (19.72%), with woody plants contributing 12.16% (Quercus 2.75%, Fabaceae 2.52%, and Cyclocarya 1.83%) and herbaceous plants contributing 7.57% (Poaceae 4.36%). Gymnosperms were represented by 1 palynomorphs from 1 family (Pinus 80.28%). During this phase, the significant increase in the relative abundance of Pinus pollen suggested a drop in temperature. Concurrently, the decrease in drought-tolerant herbaceous pollen implies an increase in humidity.

3.2 Qualitative analysis of paleoenvironments

To more clearly illustrate the relationship between the pollen samples, pollen assemblages, and environmental factors, 10 taxa with relative abundances greater than 1% in the pollen assemblages were selected for principal component analysis (Figure 6a). It was found that the first principal component (PC1) accounted for 41.6% of the variance in the pollen assemblage. The positive axis was dominated by Ulmus, Chenopodiaceae, and Artemisia, which preferred warmer habitats, while the negative axis was dominated by Pinus, which preferred relatively cooler habitats. This suggests that the first principal component represented a temperature gradient, with taxa arranged from cooler (negative axis) to warmer (positive axis) conditions. Therefore, pollen assemblages of the Sandinggai section were primarily influenced by temperature. The second principal component (PC2), accounting for 22.4% of the variance, had its positive axis dominated by taxa such as Liquidambar and Quercus, which were associated with relatively humid habitats, while its negative axis was dominated by Chenopodiaceae, which are associated with relatively arid habitats. Thus, the second PC likely represents a humidity gradient, with taxa arranged from dry (negative axis) to wet (positive axis) conditions.
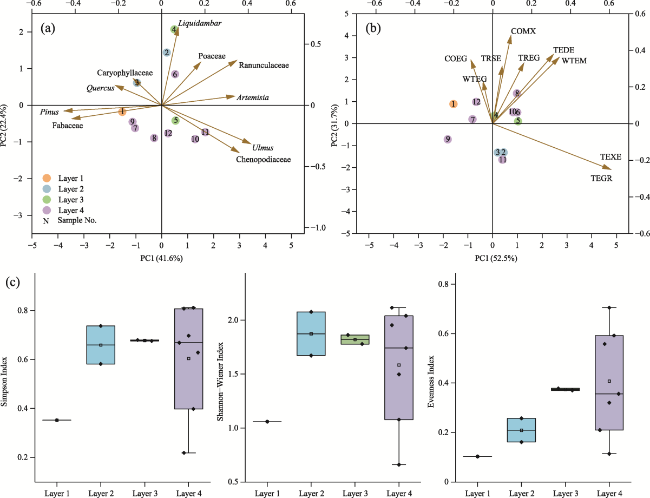
Figure 6 Palaeoenvironmental analyses of palynomorphs, biomes and plant diversity data from the Sandinggai section (a. Principal component analysis of 12 pollen samples and 10 palynomorphs with relative abundance greater than 1%; b. Principal component analysis of 12 pollen samples and 9 major biomes; c. Box plot showing the distribution of plant diversity indices (Simpson Index, Shannon-Wiener Index and Evenness Index) across four layers)
In addition, the principal component analysis of data from nine major biomes (Table S2) showed that the first two principal components accounted for 52.5% and 31.4% of the total variance, respectively (Figure 6b). The positive axis of PC1 was characterized by temperate and warm-temperate elements associated with warmer environments, while the negative axis was characterized by coniferous vegetation associated with cooler environments. This suggests that PC1 represented a temperature gradient ranging from cooler (negative axis) to warmer (positive axis) conditions across the biomes. The positive axis of PC2 was associated with forests requiring higher humidity, while the negative axis was associated with shrubland and grassland in drier environments. This suggests that PC2 represented a humidity gradient ranging from dry (negative axis) to wet (positive axis) conditions.
Combining these results, the inferred paleoenvironmental changes over time are as follows: Layer 4 (a generally warm and humid environment), Layer 3 (relatively warm and humid conditions), Layer 2 (relatively cool and dry conditions with increased vegetation openness), and Layer 1 (relatively cool conditions). These trends are consistent with the changes in pollen relative abundances over time and the climate change trends inferred from the biome reconstructions.
Moreover, box plots of plant diversity indices at different layers (Figure 6c) showed that modern plant diversity is the lowest. On average, the Simpson Index and Evenness Index were highest in Layer 3, indicating higher plant diversity. This correlates with a higher number of stone artefacts and potentially higher human activity intensity during this phase.

3.3 Quantitative vegetation reconstruction

Since approximately 100 ka BP, the dominant biomes at the Sandinggai site have been warm-temperate evergreen broadleaf and mixed forest, and temperate deciduous broadleaf forest (Figure 7). This study focused on the periods associated with human activity as indicated by lithic presence, whereas the lower part of Layer 4, which lacks lithics and has low pollen content, is not discussed in detail. Based on changes in the number of stone artefacts (Li et al., 2022), the periods of lithic presence can be divided into a phase of increasing lithics (Period I, ca. 83-50 ka, ca. 125-75 cm, Layer 4-Layer 3) and a period of decreasing lithics (Period II, ca. 50-15 ka, ca. 75-25 cm, Layer 3-Layer 2) (Figure 7).
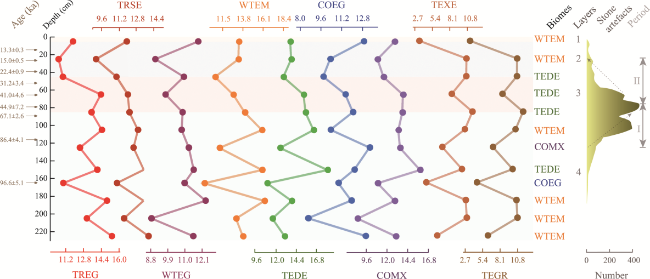
Figure 7 Biome score sequences and vegetation reconstruction of the Sandinggai site (TREG: tropical evergreen broadleaf forest; TRSE: tropical semi-evergreen broadleaf forest; WTEG: warm-temperate evergreen broadleaf forest; WTEM: warm-temperate evergreen broadleaf and mixed forest; TEDE: temperate deciduous broadleaf forest; COMX: cool mixed forest; COEG: cool evergreen needleleaf forest; TEXE: temperate xerophytic shrubland; TEGR: temperate grassland. Period I: a phase of increasing lithics; Period II: a phase of decreasing lithics)
Period I: The dominant biomes were cool mixed forest (COMX), warm-temperate evergreen broadleaf and mixed forest (WTEM), and temperate deciduous broadleaf forest (TEDE). Warm-adapted components such as tropical evergreen broadleaf forest (TREG), warm-temperate evergreen broadleaf and mixed forest (WTEM), temperate deciduous broadleaf forest (TEDE), temperate xerophytic shrubland (TEXE), temperate grassland (TEGR) all increased, whereas cooler and wetter forest components, such as cool mixed forest (COMX) decreased, indicating environmental warming.
Period II: The dominant biomes were TEDE-WTEM. Nearly all forest components decreased, while shrubland and grassland components such as temperate xerophytic shrubland (TEXE) and temperate grassland (TEGR) increased, indicating environmental drying.

3.4 Quantitative paleoclimate reconstruction

Building on the qualitative descriptions, a quantitative coexistence analysis was employed to reconstruct seven climate parameters based on 52 seed plant taxa identified in the sediment profile from the Sandinggai site (Figure 8). The MAT was defined as 18.6-13.3°C (mean 15.95°C) based on the delimited taxa Corylus and Liquidambar, while the MAP was defined as 1255-798 mm (mean 1026 mm) based on the delimited taxa Myriophyllum and Podocarpus. Overall, the climate was cooler and drier than the present, corresponding to conditions typical of the current subtropical humid zone.
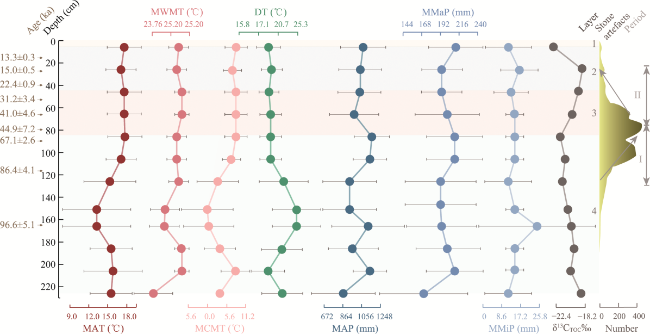
Figure 8 Changes in seven climatic parameters and total organic carbon isotopes at the Sandinggai site (MAT: the mean annual temperature; MWMT: the mean warmest monthly temperature; MCMT: the mean coldest monthly temperature; DT: the temperature difference between the coldest and warmest months; MAP: the mean annual precipitation; MMaP: the mean maximum monthly precipitation; MMiP: the mean minimum monthly precipitation. Period I: a phase of increasing lithics; Period II: a phase of decreasing lithics)
Period I: The mean MAT increased by 4.4°C, the mean MWMT by 0.9°C, the mean MCMT by 8.65°C, and the DT decreased by 6.3°C, indicating a warming environment with reduced seasonal temperature variability. The mean MAP increased by 227 mm, and the mean MMaP by 18 mm, indicating a slight increase in precipitation. The increase in temperature and precipitation might have provided favorable conditions for greater human activity intensity, as evidenced by the larger number of stone artefacts.
Period II: The mean MAT decreased by 0.6°C, the mean MCMT by 1.1°C, and the DT increased by 0.2°C, indicating a slight cooling with seasonal interannual temperature variability. The mean MAP increased by 118 mm, while the mean MMaP decreased by 17 mm. The cooler and drier climate corresponded to a reduction in the number of stone artefacts.

3.5 Total organic carbon isotopes

Total organic carbon isotopes of the Sandinggai site ranged from -18.59‰ to -22.73‰, with an average value of -20.41‰ (Figure 8). Most of the organic matter in sediments is derived from terrestrial plant detritus. Due to carbon isotope fractionation during the degradation of organic matter, the carbon isotope composition of organic matter in the sediments is more positive than that of vegetation isotopes (Ågren et al., 1996; Feng, 2002; Poage and Feng, 2004; Wang et al., 2015; Zeng et al., 2024). It is generally accepted that soil total organic carbon isotopes are approximately 2.3‰ (1.8‰-2.8‰) higher than those of plant isotopes (Wang et al., 2008). Therefore, it can be inferred that the carbon isotopic composition of surface vegetation at that time ranged between -20.89‰ and -25.03‰, with an average of approximately -22.71‰. Given the different carbon isotope fractionation mechanisms in the photosynthesis of C3 and C4 plants (Farquhar et al., 1982; Farquhar, 1983; Shang et al., 2007), which result in significant differences in their carbon isotope compositions, the global carbon isotope composition range for C3 plants is -20‰ to -35‰ with an average of -27‰, whereas for C4 plants is -9‰ to -16‰ with an average of -13‰ (Deines, 1980). Therefore, it can be inferred that the surface vegetation at that time consisted largely of C3 plants, with a small distribution of C4 plants.

4 Discussion

4.1 Hominin habitats at the Late Pleistocene Sandinggai site

The Late Pleistocene period encompasses the Last Interglacial (MIS 5) and the Last Glacial Period (MIS 4-2, 75-11 ka BP) (Liu et al., 2001). MIS 3, a relatively warm phase within the Last Glacial Period, was characterized by a series of climatic oscillations, such as millennial-scale Heinrich events and the Dansgaard-Oeschger cycles (Heinrich, 1988; Dansgaard et al., 1993; Bond et al., 1997; Held et al., 2024).
A preliminary sequence of paleoenvironmental changes during the hominin occupation period at the Sandinggai site has been reconstructed based on palynological, isotopic, geochemical, and paleomagnetic data, using principal component analysis, biome reconstruction, coexistence analysis, and multidisciplinary indicator comparison. This study focuses on the stages of lithic persistence representing hominin activity, which has been divided into two periods: increased lithic production (Period I) and decreased lithic production (Period II) (Figure 9).
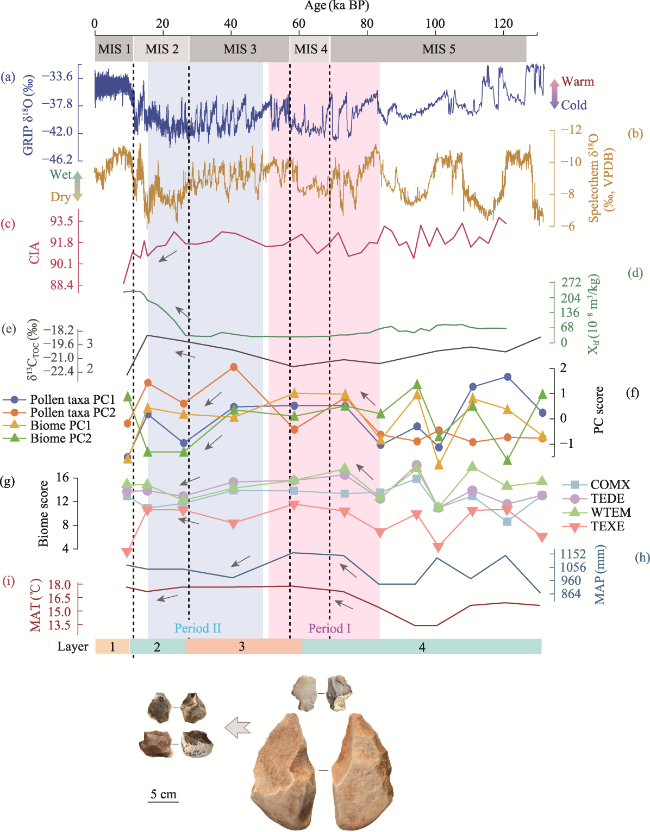
Figure 9 Multidisciplinary indicators for comparing palaeoenvironmental changes at the Sandinggai site (a. Late Pleistocene climatic change recorded in the Greenland Ice Core Project (GRIP, Johnsen et al., 1997); b. Late Pleistocene climatic change documented in Chinese speleothems at the Sanbao, Hulu and Dongge caves (Cheng et al., 2018); c. CIA (Li et al., 2022); d. Magnetic susceptibility (Li et al., 2022); e. Total organic carbon isotope (this study); f. PC value (this study); g. Main biome scores (this study); h. MAP (this study); i. MAT (this study))
Period I (ca. 83-50 ka, ca. 125-75 cm, Layer 4-Layer 3) spanned MIS 5, MIS 4, and MIS 3, during which global temperatures exhibited a trend of initial increase, followed by a decrease, and then another increase (Figure 9a). Similarly, speleothem records from South China indicated a trend of drying, followed by wetting, and then drying again (Figure 9b). The paleoenvironment of the Sandinggai site, while broadly consistent with global temperature and regional humidity changes, also exhibited distinctive regional characteristics.
(1) PCA of pollen data yielded PC1 values (Pollen taxa PC1 and Biome PC1) that reflect temperature changes, showing initial warming followed by cooling. The PC2 values (Pollen taxa PC2 and Biome PC2), which reflect humidity changes, initially increased and then decreased during MIS 4 (Figure 9f). (2) The primary biomes associated with warmer habitats (TEDE, WTEM, and TEXE) first increased and then decreased during MIS 4 (Figure 9g). (3) The MAT obtained from CoA showed a continuous rise; while the MAP increased first and then decreased (Figure 9h).
A relatively warm and humid environmental condition was inferred through the above pollen data, corresponding with the other evidence. (1) The lowest value in δ13CTOC suggests the presence of dense forest (Figure 9e). (2) The Chemical Index of Alteration (CIA) effectively indicates the chemical weathering conditions during sediment formation (Nesbitt and Young, 1982). High CIA values are typically associated with warm and humid climates that favour intense chemical weathering (Feng et al., 2003). The CIA trend during this period corresponded well with global temperature and regional humidity patterns (Figure 9c, Li et al., 2022). (3) Magnetic susceptibility remained relatively stable (Figure 9d, Li et al., 2022). (4) The lithology of the early stage (Layer 4) comprised reticulate red clay, formed during the warm and humid Last Interglacial (Cai et al., 2012; Du, 2014; Li et al., 2022).
Contrary to the global cooling and regional drying from MIS 5 to MIS 4, the Sandinggai area experienced a warming and increased humidification trend in the late MIS 5, highlighting the uniqueness of its local environment. Overall, during this period of increased lithic production, hominins inhabited a warm temperate evergreen and deciduous broadleaf mixed forest dominated by Ulmus and Liquidambar, with MAT of approximately 17°C and MAP of about 1050 mm (Figures 5 and 9). The environmental conditions in Sandinggai with a warm and humid climate, dense forest, relatively high plant diversity, and abundant food sources, probably act as a refuge for hominin populations (Yang et al., 2020; Faith et al., 2021; Lu et al., 2023).
Period II (ca. 50-15 ka, ca. 75-25 cm, Layer 3-Layer 2): This stage included the mid-to-late MIS 3 to the early-mid MIS 2 (LGM). During this period, Global temperatures decreased, regional humidity reduced, and the paleoenvironmental trends at the Sandinggai site followed a similar pattern (Figure 9).
(1) PC values indicated a decrease in both temperature and precipitation. (2) The forest component of the biome decreased, while the shrub component increased (Figure 9g). (3) MAT decreased and MAP remained at a relatively low level. (Figures 9h and 9i).
A cooling and drying trend, derived from the pollen data, aligned with the other environmental evidence. (1) The continuous increase in δ13CTOC suggested a rise in C4 plants and an expansion of vegetation openness (Figure 9e). (2) The decrease in CIA suggested a reduction in chemical weathering intensity in the study area, indicative of a colder and drier environment (Figure 9c, Li et al., 2022). (3) Magnetic susceptibility substantially increased, consistent with the trend observed in South China, where it rose with decreasing MAT and MAP (Lu et al., 1994), suggesting an environmental shift toward colder and drier conditions (Figure 9d, Li et al., 2022), possibly associated with increased seasonality (Zhu et al., 2011). (4) The aeolian red clays may imply hominin occupation in highlands (Lai et al., 2021), while the lithology changes from homogeneous reddish-brown silty clay to yellowish-red silty clay suggested weaker soil weathering and a colder and drier climate (Cai et al., 2012; Du, 2014; Li et al., 2022).
Overall, during this period, hominins inhabited a temperate deciduous broadleaf forest dominated by Quercus and Liquidambar, with MAT of approximately 17°C and MAP of about 1020 mm. The climate was relatively cool and dry, forest openness increased, and plant diversity decreased (Figures 5 and 9).

4.2 Adaptation strategies of Late Pleistocene hominins to environmental changes at the Sandinggai site

Throughout evolution, humans have adapted to diverse environments (Kelly, 1983; Zeller et al., 2023). In response to adverse environmental changes, hominins either migrated or developed innovative survival strategies (Shipton et al., 2018). In the absence of direct evidence, stone artefacts can serve as reliable proxies, as the number of lithics reflects the intensity of human activities (Li et al., 2022), while changes in lithic technology may indicate shifts in resource use and production strategies in response to environmental changes (Kuhn, 1995).
Period I. As temperature and precipitation conditions improved in the Sandinggai area, forests expanded, and species richness and diversity increased, providing a favourable environment for hominin occupation. Correspondingly, the number of lithic artefacts increased. Lithic analysis by Li et al. (2022) revealed two distinct lithic technological systems during this period (Figures 9 and 10): (1) a Large Cutting Tool (LCT) techno-complex based mainly on coarse-grained quartz sandstone; (2) a small flake and flake tool production system based on chert. The handaxes in South China were likely used as large chopping tools for obtaining abundant plant resources in the forest, reflecting human adaptation to the forest environment (Figure 10, Li et al., 2022).
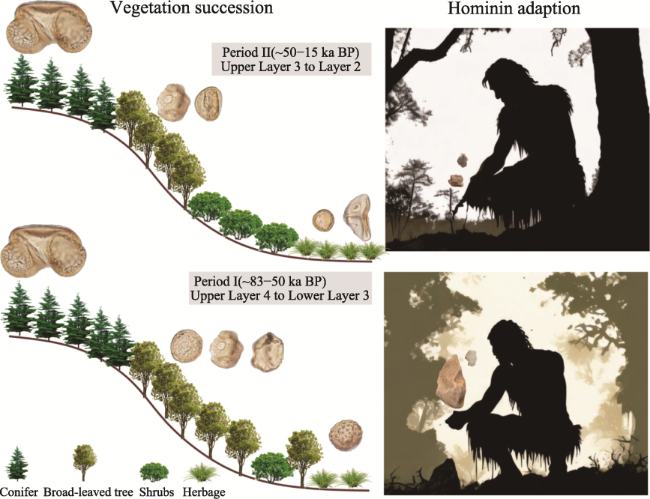
Figure 10 Vegetation succession and hominin adaptations at the Sandinggai site during the Late Pleistocene. The left column schematically represents vegetation succession, while the right column shows the adaptation of stone artefacts used by hominins in response to increasingly open vegetation. The background images in the right column are sourced from AI Creations (https://image.baidu.com/).
Period II. As temperature and precipitation conditions deteriorated in the Sandinggai area, vegetation openness increased, while plant diversity decreased. Correspondingly, the number of lithic artefacts decreased. In the later stage of this period (Layer 2), the proportion of quartz sandstone decreased, while that of chert increased, and handaxe-like LCTs were completely replaced by small flake tools simultaneously (Li et al., 2022). Evidence suggests that more than 30 Paleolithic sites have been found in the Daoshui Region, covering an area of approximately 30 km2 (Li et al., 2022). A trend of lithic miniaturization was generally observed at these sites during the Late Pleistocene, possibly reflecting an adaptive strategy to the increasingly cold and dry climate, as well as the gradual fragmentation of resources (Li et al., 2023). The emergence of microblade technology in northern China has been suggested as an adaptation to the cold, dry climate and the specific forest-steppe environment of the Last Glacial Maximum (LGM) (Wang, 2018; Chen and Ye, 2019; Yue et al., 2021).
Although the lithic technology at the Sandinggai site shows some variation from the bottom to the top layers, these changes do not indicate fundamental innovation but rather continuity and stability (Li et al., 2022). The paleoenvironmental reconstruction results also suggest that while the vegetation and climate fluctuated at Sandinggai, no extreme changes occurred, and the biomes remained continuous (Figures 7-9). Based on the correspondence between lithics and the environment, it can be hypothesized that the disappearance of lithics at Sandinggai was attributed to increased local hominin mobility facilitated by environmental changes during the LGM (Guo et al., 2024).

4.3 Lithic miniaturization and environmental changes around the LGM

The Late Pleistocene cooling-aridification trend culminated during the LGM (22-19 ka BP) (Yokoyama et al., 2000; Clark et al., 2009; Osman et al., 2021). Multi-proxy climate reconstructions indicate that the MAT in China was approximately 5 (3-8)°C lower than today (Lu et al., 2024). Model simulations and palynological data analysis suggest that South China was characterized by extensive warm-temperate deciduous broadleaf forests (Yu et al., 2000; Guedes et al., 2016; Wang et al., 2017, 2019), with relatively high vegetation openness at that time (Li et al., 2019a). Meanwhile, a global population contraction has been observed (Klein et al., 2021; Buvit et al., 2022; Villalba-Mouco et al., 2023). In Europe, for instance, reduced temperatures, decreased precipitation, forest retreat, and grassland expansion may have collectively led to a contraction in the range of prehistoric human activities during this period (Banks et al., 2009).
The phenomenon of lithic miniaturization was widespread globally (Elston and Kuhn, 2002). Increased resource utilization intensity partially explains lithic miniaturization, which has been hypothesized to be related to group mobility, population density, and technological organization (Dibble and Mellars, 1992). Factors influencing mobility strategies and foraging behavior ultimately shaped the technological strategies of hunter-gatherers (Kuhn, 1995; Riel-Salvatore and Barton, 2004; Barton and Riel-Salvatore, 2014; Mackay et al., 2014; Wilkins et al., 2017). From an economic perspective, reducing the size of stone tools can enhance their portability and utility, thereby increasing the efficiency of raw material use and reducing costs (Hiscock, 2015).
From the perspective of population dynamics, increased population density intensifies resource utilization. Evidence from the Late Pleistocene-Holocene site of Nasera in Tanzania indicated that higher population density led to increased resource utilization intensity, reflected in improved flake production efficiency (i.e., bipolar reduction and bladelet production) and increased core thinning (Tryon and Faith, 2016).
From an environmental perspective, human survival resources are often distributed in patches (Chen, 2006). When environmental conditions are stable, long-term residential stability may emphasize high-quality rock material sources, leading to a more intensive reduction of cores and flakes (Dibble and Lenoir, 1995). Conversely, when environmental conditions worsened and the distance between resource patches increased to the point where benefits no longer offset the costs, prehistoric humans, as hunter-gatherers, might have opted to remain within a resource patch and expand the variety and quantity of usable resources (Chen, 2006). This is evidenced at archaeological sites by frequent activities within a limited area (e.g., site clusters) and the appearance of easily portable tool assemblages (Binford, 2001).
This study finds that the lithic miniaturization at the Sandinggai site during the LGM represents an adaptation to climate cooling, drying and increased vegetation openness (Figure 11b). Contemporaneously, increased fragmentation of resources in Southeast Asia may have similarly driven lithic miniaturization at the Jurreru Valley site (Figure 11c, Petraglia et al., 2009). In contrast, the warming and humidification of the climate from the LGM to the B-A warm period at Fodongdi Cave on the southeastern edge of the Tibetan Plateau corresponded with a decrease in the proportion and quantity of small tools, while the number and variety of stone artefacts representing other subsistence activities increased (Figure 11d, Huan et al., 2024).
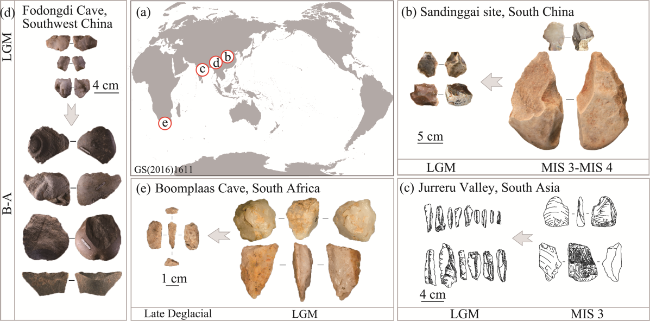
Figure 11 Snapshots of lithic miniaturisation at representative sites globally around the LGM (a. Site distribution; b. Sandinggai site (Li et al., 2022); c. Jurreru Valley, South Asia (Petraglia et al., 2009); d. Fodongdi Cave (Huan et al., 2024); e. Boomplaas Cave, South Africa (Pargeter and Faith, 2020))
Environmental instability is also reflected in seasonal variations. In strong seasonal environments, resource-rich periods were shorter and more distinct, leading hominins to expend more time and energy searching for and obtaining resources (Harpending and Davis, 1977; Bousman, 1993). As a result, there was a need to enhance the efficiency of resource utilization in the existing environment. For instance, evidence from the Boomplaas Cave in South Africa indicated that lithic miniaturization was related to increased resource utilization intensity driven by Late Pleistocene seasonal precipitation changes and rapid sea-level rise (Figure 11e, Pargeter and Faith, 2020).

5 Conclusion

The vegetation and climate during the hominin occupation of the Sandinggai site were quantitatively reconstructed. Overall, the climate was warm and humid, with a MAT ranging from 18.6 to 13.3°C (mean 15.95°C) and a MAP ranging from 1255 to 798 mm (mean 1026 mm). The vegetation transitioned from warm-temperate evergreen and deciduous broadleaf mixed forests dominated by Ulmus, Liquidambar and Quercus, to temperate deciduous broadleaf forests dominated by Quercus and Liquidambar, as the climate shifted from warm and humid to cooler and drier. Additionally, the adaptive strategies of hominins at the Sandinggai site were explored in the context of environmental changes through case studies. As temperature and precipitation conditions improved, broadleaf forests expanded, coniferous forests contracted, and plant biodiversity increased, leading to heightened human activity. Conversely, during the LGM, characterized by climate cooling, drying, increased vegetation openness, and reduced plant diversity, human activity decreased, and lithic miniaturization was employed to enhance resource utilization efficiency as an adaptation to environmental changes. These findings offer valuable insights into the relationships between lithic technology, environmental conditions, and human behavior during the Late Pleistocene in South China. Further research and archaeological discoveries are necessary to explore the possible connections between these changes and the broader patterns of human migration and cultural diffusion during this period.

Acknowledgements

The authors would like to extend their sincere gratitude to Dr. JU Dan from the Institute of Vertebrate Paleontology and Paleoanthropology, Chinese Academy of Sciences, for his invaluable assistance in refining the language and presentation of this manuscript. The authors are also grateful to Dr. YUE Jianping from the same institute for his insightful discussions and valuable suggestions.

Supplementary Information for

Late Pleistocene vegetation succession, climate change and hominin adaptation in Sandinggai site, central South China

This supplementary file includes:

Table S1 Plant function types (PFTs) and the pollen taxa assigned to them (Prentice et al., 1996; Tarasov et al., 1998; Ni et al., 2010)
Codes Plant functional type Main pollen taxa included
wt.e.n.t Warm-temperate evergreen needle-leaved tree Cedrus, Pinus, Podocarpus, Taxodiaceae, Tsuga
eu.e.n.t Eurythermic evergreen needle-leaved tree Cupressaceae, Pinus
wt.d.n.t Warm-temperate deciduous needle-leaved tree Taxodiaceae
wt.e.sb.t Warm-temperate evergreen sclerophyll
broad-leaved tree
Euphorbiaceae, Fabaceae, Oleaceae, Quercus
wt.e.mb.t Warm-temperate evergreen malacophyll
broadleaf tree
Apocynaceae, Araliaceae, Fabaceae, Hamamelidaceae, Moraceae, Oleaceae, Quercus, Scrophulariaceae, Symplocos, Theaceae
tr.e.sb.t Tropical evergreen sclerophyll broadleaf tree Euphorbiaceae, Fabaceae, Oleaceae
tr.e.mb.t Tropical evergreen malacophyll broadleaf tree Apocynaceae, Araliaceae, Euphorbiaceae,
Fabaceae, Moraceae, Oleaceae, Scrophulariaceae, Tilia, Ulmus
te-fa.cd.mb.t Temperate (spring-frost avoiding) cold-deciduous malacophyll broadleaf tree Carpinus, Euphorbiaceae, Fabaceae, Lamiaceae, Oleaceae, Quercus, Rosaceae, Scrophulariaceae, Ulmus
te-ft.cd.mb.t Temperate (spring-frost tolerant) cold-deciduous malacophyll broadleaf tree Acer, Alnus, Betula, Corylus, Fabaceae, Quercus, Rosaceae, Tilia, Ulmus
te-fi.cd.mb.t Temperate (spring-frost intolerant) cold-deciduous malacophyll broadleaf tree Acer, Betula, Caprifoliaceae, Carpinus, Carya, Fabaceae, Hamamelidaceae, Juglans, Liquidambar, Moraceae, Pterocarya, Quercus, Rosaceae, Tilia
wt.cd.mb.t Warm-temperate cold-deciduous malacophyll
broadleaf tree
tr-m.dd.mb.t Tropical mesic drought-deciduous malacophyll
broadleaf tree
tr-x.dd.mb.t Tropical xeric drought-deciduous malacophyll
broadleaf tree
Euphorbiaceae, Fabaceae, Tilia
sl.t Small-leaved tree Alnus, Caprifoliaceae, Carya, Cyclocarya,
Euphorbiaceae, Fabaceae, Hamamelidaceae, Juglans, Liquidambar, Moraceae, Pterocarya, Rosaceae, Ulmus
dt.sl.lhs Drought-tolerant small-leaved low or high shrub Euphorbiaceae, Fabaceae, Oleaceae, Tilia, Ulmus
wt.e.sb.lhs Warm-temperate evergreen sclerophyll
broadleaf low or high shrub
Euphorbiaceae, Fabaceae, Hamamelidaceae, Oleaceae, Quercus, Theaceae
wt.e.mb.lhs Warm-temperate evergreen malacophyll
broadleaf low or high shrub
Apocynaceae, Araliaceae, Caprifoliaceae, Chloranthus, Euphorbiaceae, Fabaceae, Moraceae, Oleaceae, Quercus, Scrophulariaceae, Symplocos, Viburnum
tr.e.mb.lhs Tropical evergreen malacophyll broadleaf low or high shrub Apocynaceae, Araliaceae, Corylus, Fabaceae, Moraceae, Oleaceae, Scrophulariaceae
te.cd.mb.lhs Temperate cold-deciduous malacophyll
broadleaf low or high shrub
Alnus, Betula, Caprifoliaceae, Carpinus, Euphorbiaceae, Hamamelidaceae, Lamiaceae, Moraceae, Oleaceae, Quercus, Rosaceae, Scrophulariaceae, Tilia, Ulmus, Viburnum
wt.cd.mb.lhs Warm-temperate cold-deciduous malacophyll broadleaf low or high shrub Caprifoliaceae, Euphorbiaceae, Fabaceae, Hamamelidaceae, Moraceae, Rosaceae, Ulmus
eu-x.dd.mb.lhs Eurythermic xeric drought-deciduous
malacophyll low or high shrub
Artemisia, Asteraceae (excl.Artemisia), Brassicaceae, Euphorbiaceae, Fabaceae
tr-dt.lv Tropical drought-tolerant liana or vine Euphorbiaceae, Fabaceae, Oleaceae
tr-di.lv Tropical drought-intolerant liana or vine Apocynaceae, Fabaceae, Moraceae, Oleaceae, Ranunculaceae
te-dt.fb Temperate drought-tolerant forb Artemisia, Asteraceae (excl.Artemisia), Brassicaceae, Caryophyllaceae, Euphorbiaceae, Fabaceae, Lamiaceae, Polygonum, Rosaceae, Saxifragaceae, Scrophulariaceae
eu-dt.fb Eurythermic drought-tolerant forb Chenopodiaceae
g Grass graminoid Poaceae
lsuc Leaf succulent Chenopodiaceae
ssuc Stem succulent Euphorbiaceae
Table S2 Main biome definitions in terms of plant functional type (Ni et al., 2010)
Biomes Codes PFTs
Cool evergreen needleleaf forest COEG eu.e.n.t, te-ft.cd.mb.t
Cool mixed forest COMX eu.e.n.t, te-fa.cd.mb.t, te-ft.cd.mb.t, te.cd.mb.lhs
Temperate deciduous broadleaf forest TEDE eu.e.n.t, te-fa.cd.mb.t, te-fi.cd.mb.t, te.cd.mb.lhs
Warm-temperate evergreen broadleaf and mixed forest WTEM wt.e.n.t, eu.e.n.t, wt.d.n.t, wt.e.sb.t, wt.e.mb.t, te-fi.cd.mb.t,
wt.cd.mb.t, wt.e.sb.lhs, wt.e.mb.lhs, wt.cd.mb.lhs
Warm-temperate evergreen broadleaf forest WTEG wt.e.n.t, eu.e.n.t, wt.e.sb.t, wt.e.mb.t, wt.e.sb.lhs, wt.e.mb.lhs
Tropical semi-evergreen broadleaf forest TRSE wt.e.n.t, wt.d.n.t, wt.e.sb.t, wt.e.mb.t, tr.e.mb.t, tr-m.dd.mb.t, tr.e.mb.lhs, tr-dt.lv
Tropical evergreen broadleaf forest TREG wt.e.n.t, wt.d.n.t, wt.e.sb.t, wt.e.mb.t, tr.e.sb.t, tr.e.mb.t, tr.e.mb.lhs, tr-di.lv
Temperate xerophytic shrubland TEXE sl.t, dt.sl.lhs, te-dt.fb, g
Temperate grassland TEGR te-dt.fb, eu-dt.fb, g
References
Ni J, Yu G, Harrison S P et al., 2010. Palaeovegetation in China during the late Quaternary: Biome reconstructions based on a global scheme of plant functional types. Palaeogeography, Palaeoclimatology, Palaeoecology, 289(1-4): 44-61.
Prentice C, Guiot J, Huntley B et al., 1996, Reconstructing biomes from palaeoecological data: A general method and its application to European pollen data at 0 and 6 ka. Climate Dynamics, 12185-12194.
Tarasov P E, Cheddadi R, Guiot J et al., 1998, A method to determine warm and cool steppe biomes from pollen data; application to the Mediterranean and Kazakhstan regions. Journal of Quaternary Science, 13(4): 335- 344.
[1]
Ågren G I, Bosatta E, Balesdent J, 1996. Isotope discrimination during decomposition of organic matter: a theoretical analysis. Soil Science Society of America Journal, 60(4): 1121-1126.

[2]
Bae C J, 2017. Late Pleistocene human evolution in eastern Asia: Behavioral perspectives. Current Anthropology, 58(S17): S514-S526.

[3]
Bae C J, Douka K, Petraglia M D, 2017. On the origin of modern humans: Asian perspectives. Science, 358(6368): eaai9067.

[4]
Bae C J, Wang W, Zhao J X et al. 2014. Modern human teeth from Late Pleistocene Luna Cave (Guangxi, China). Quaternary International, 354169-354183.

[5]
Banks W E, Zilhão J, d'Errico F, et al., 2009. Investigating links between ecology and bifacial tool types in Western Europe during the Last Glacial Maximum. Journal of Archaeological Science, 36(12): 2853-2867.

[6]
Barton C M, Riel-Salvatore J, 2014. The formation of lithic assemblages. Journal of Archaeological Science, 46334-46352.

[7]
Binford L R, 2001. Constructing Frames of Reference: An Analytical Method for Archaeological Theory Building Using Hunter-gatherer and Environmental Data Sets. University of California Press.

[8]
Birks H J B, Gordon A D, 1984. Numerical Methods in Quaternary Pollen Analysis. London: Academic Press.

[9]
Bond G, Showers W, Cheseby M et al., 1997. A pervasive millennial-scale cycle in North Atlantic Holocene and glacial climates. Science, 278(5341): 1257-1266.

[10]
Bousman C B, 1993. Hunter-gatherer adaptations, economic risk and tool design. Lithic Technology, 1859-1886.

[11]
Buvit I, Rasic J T, Izuho M, 2022, Archaeological evidence shows widespread human depopulation of Last Glacial Maximum Northeast Asia. Archaeological and Anthropological Sciences, 14(7): 125.

[12]
Cai F P, Hu X F, Du Y et al., 2012. Pedogenesis of the yellow-brown earth-red clay profile in Langxi county, Anhui province and paleoclimatic change in the Yangtze River Valley, Southeast China in the Late Quaternary period. Acta Pedologica Sinica, 49(2): 220-229. (in Chinese)

[13]
Chen S Q, 2006. Modeling hunter-gatherers of China. Acta Anthropologica Sinica, 25(1): 42. (in Chinese)

[14]
Chen S Q, Ye C Y, 2019. Theoretical retrospection on the origin of microblade technology. Acta Anthropologica Sinica, 38(4): 547-562. (in Chinese)

[15]
Cheng H, Edwards R L, Southon J et al., 2018. Atmospheric 14C/12C changes during the last glacial period from Hulu Cave. Science, 362(6420): 1293-1297.

[16]
China National Petroleum Corporation, 2000. Analysis and Identification on Spore-pollens. Beijing: National Petroleum and Chemical Industry Administration. (in Chinese)

[17]
Clark P U, Dyke A S, Shakun J D et al., 2009. The Last Glacial Maximum. Science, 325(5941): 710-714.

[18]
Cohen A S, Campisano C J, Arrowsmith J R, et al., 2022. Reconstructing the environmental context of human origins in eastern Africa through scientific drilling. Annual Review of Earth and Planetary Sciences, 50(1): 451-476.

[19]
Dai Y T, 2023. New findings from the 2021 Palaeolithic archaeological survey in the Nanjiang Basin, Guangdong province. Hakka Cultural Heritage Vision, (3): 69-73. (in Chinese)

[20]
Dansgaard W, Johnsen S J, Clausen H B et al., 1993. Evidence for general instability of past climate from a 250-kyr ice-core record. Nature, 364(6434): 218-220.

[21]
Darwin C, 1871. The Descent of Man, and Selection in Relation to Sex. London: John Murray.

[22]
Deines P, 1980. The isotopic composition of reduced organic carbon. In: Fritz P, Ch Fontes J eds. The Terrestrial Environment, A. Amsterdam: Elsevier, 329-406.

[23]
deMenocal P B. 2011. Climate and human evolution. Science, 331(6017): 540-542.

[24]
Dibble H L, Lenoir M, 1995. The Middle Paleolithic Site of Combe-Capelle Bas (France). Philadelphia: UPenn Museum of Archaeology.

[25]
Dibble H L, Mellars P, 1992. The Middle Paleolithic: adaptation, behavior, and variability. Dibble H L, Mellars P eds. Philadelphia: University of Pennsylvania Museum of Archaeology and Anthropology.

[26]
Dong Z, Pei S W, Yuan S F, 2019. A preliminary report on the Paleolithic survey in Shuiyangjiang River system, Anhui province in 2017. Acta Anthropologica Sinica, 38(2): 223-231. (in Chinese)

[27]
Du Y, 2014. OSL dating of the Quaternary red clay distributed in the reaches of the Yangtze River and paleoclimatic changes since the Last Interglacial period in mid-subtropical Southeast China. Shanghai: Shanghai University. (in Chinese)

[28]
Editorial Committee of China Vegetation Map CAS, 2001. 1:1,000,000 Scale Vegetation Distribution Map of China. Beijing: Science Press. (in Chinese)

[29]
Elston R G, Kuhn S L, 2002. Thinking Small: Global Perspectives on Microlithization. Washington, DC.: American Anthropological Association.

[30]
Faith J T, Du A, Behrensmeyer A K, et al., 2021. Rethinking the ecological drivers of hominin evolution. Trends in Ecology & Evolution, 36(9): 797-807.

[31]
Farquhar G D, 1983. On the nature of carbon isotope discrimination in C4 species. Australian Journal of Plant Physiology, 10(2): 205-226.

[32]
Farquhar G D, O'Leary M H, Berry J A, 1982. On the relationship between carbon isotope discrimination and the intercellular carbon dioxide concentration in leaves. Functional Plant Biology, 9(2): 121-137.

[33]
Feng L J, Zhu X L, Zhang Q R et al., 2003. Chemical index of alteration (CIA) and its application to Neoproterozoic clastic rocks. Earth Science Frontiers, (4): 539-544. (in Chinese)

[34]
Feng X H, 2002. A theoretical analysis of carbon isotope evolution of decomposing plant litters and soil organic matter. Global Biogeochemical Cycles, 16(4): 66-61-66-11.

[35]
Guedes J d A, Austermann J, Mitrovica J X, 2016. Lost foraging opportunities for East Asian hunter-gatherers due to rising sea level since the Last Glacial Maximum. Geoarchaeology, 31(4): 255-266.

[36]
Guo A P, Mao L J, Li Y Y et al., 2024. Environmental change and human occupation during Late Pleistocene in Hunan province, South China. Journal of Earth Science, https://link.cnki.net/urlid/42.1788.p.20240415.1914.002

[37]
Harpending H C, Davis H, 1977. Some implications for hunter-gatherer ecology derived from the spatial structure of resources. World Archaeology, 8276-8286.

[38]
Heinrich H, 1988. Origin and consequences of cyclic ice rafting in the Northeast Atlantic Ocean during the past 130,000 years. Quaternary Research, 29(2): 142-152.

[39]
Held F, Cheng H, Edwards R L, et al., 2024. Dansgaard-Oeschger cycles of the penultimate and last glacial period recorded in stalagmites from Türkiye. Nature Communications, 15(1): 1183.

[40]
Higham T, Douka K, Wood R et al., 2014. The timing and spatiotemporal patterning of Neanderthal disappearance. Nature, 512(7514): 306-309.

[41]
Hiscock P, 2015. Making it small in the Palaeolithic: Bipolar stone-working, miniature artefacts and models of core recycling. World Archaeology, 47(1): 158-169.

[42]
Hou Y M, Potts R, Yuan B Y, et al., 2000. Mid-Pleistocene Acheulean-like stone technology of the Bose Basin, South China. Science, 287(5458): 1622-1626.

[43]
Hu Y, Marwick B, Zhang J F et al., 2019. Late Middle Pleistocene Levallois stone-tool technology in southwest China. Nature, 565(7737): 82-85.

[44]
Huan F X, Yang S X, Gao F et al., 2024. Technological diversity in the tropical-subtropical zone of Southwest China during the terminal Pleistocene: Excavations at Fodongdi Cave. Archaeological and Anthropological Sciences, 16(1): 25.

[45]
Huang S, Hong H, Liao W et al., 2020. Late Pleistocene paleoenvironment of southern China: Clay mineralogical and geochemical analyses from Luna cave, Guangxi, China. Quaternary International, 563: 78-86.

[46]
IDoBM Center, 1983. Land Climate Data of China (1951-1980). Beijing: China Meteorological Press.

[47]
Institute of Botany CAS, 1982. Angiosperm Pollen Flora of Tropic and Subtropic China. Beijing: Science Press. (in Chinese)

[48]
Jin C Z, Pan W S, Zhang Y Q et al., 2009. The Homo sapiens Cave hominin site of Mulan Mountain, Jiangzhou District, Chongzuo, Guangxi with emphasis on its age. Chinese Science Bulletin, 54(19): 2848-2856. (in Chinese)

[49]
Johnsen S J, Clausen H B, Dansgaard W et al., 1997. The δ18O record along the Greenland Ice Core Project deep ice core and the problem of possible Eemian climatic instability. Journal of Geophysical Research: Oceans, 102(C12): 26397-26410.

[50]
Kelly R L, 1983. Hunter-gatherer mobility strategies. Journal of Anthropological Research, 39(3): 277-306.

[51]
Klein K, Wegener C, Schmidt I et al., 2021. Human existence potential in Europe during the Last Glacial Maximum. Quaternary International, 581/582: 7-27.

[52]
Kuhn S L, 1995. Mousterian Lithic Technology:An Ecological Perspective. Princeton, New Jersey: Princeton University Press.

[53]
Lai H C, Zhang J F, Li Y Y et al., 2021. Origin and provenance of red clay in north Hunan province, China: Inferred from grain-size analysis and end-member modelling. Aeolian Research, 51100714.

[54]
Li C R, Xu C Q, 1991. Paleolithics from the Liao River in Anyi, Jiangxi province. Acta Anthropologica Sinica, (1): 34-41, 89-90. (in Chinese)

[55]
Li D W, Wang W, Hu C Y et al., 2017. Paleoenvironment background research in Luna Cave, Guangxi. Quaternary Sciences, 37(4): 877-884. (in Chinese)

[56]
Li H, 2022. A probe into the southern dispersal route of early modern humans. Acta Anthropologica Sinica, 41(4): 630-648. (in Chinese)

[57]
Li H, Li Y Y, Yu L P et al., 2022. Continuous technological and behavioral development of Late Pleistocene hominins in central South China: Multidisciplinary analysis at Sandinggai. Quaternary Science Reviews, 298107850.

[58]
Li H, Wang S J, Lotter M G et al., 2024. The evolution of handaxe technology in China: Recent progress and future questions. Science Bulletin, S2095927324002962.

[59]
Li H, Zhang Y Z, Li Y Y et al., 2021. Sediment characteristics and the formation processes of Paleolithic sites. Acta Anthropologica Sinica, 40(3): 363-377. (in Chinese)

[60]
Li Q, Wu H B, Yu Y Y et al., 2019a. Large-scale vegetation history in China and its response to climate change since the Last Glacial Maximum. Quaternary International, 500108-500119.

[61]
Li W C, Song G D, 2023. Chronology and lithic technological progresses of those Paleolithic sites in Danjiangkou Reservoir Region. Acta Anthropologica Sinica, 42(2): 277-287. (in Chinese)

[62]
Li X L, Xing S, Wang X M et al., 2019b. Preliminary study on the living environment of hominin occupation at Fuyan Cave, Daoxian county, Hunan. Quaternary Sciences, 39(6): 11. (in Chinese)

[63]
Li Y Y, 2020. Lithic Industries and Adaptation Behaviors:The Late Pleistocene Hominin Culture in the Lishui River Valley. Shanghai: Shanghai Chinese Classics Publishing House. (in Chinese)

[64]
Li Y Y, Li H, Sumner A et al., 2023. Lithic technological strategies of Late Pleistocene hominins in the Daoshui River valley, Hunan province, central South China. Frontiers in Earth Science, 11.

[65]
Liu J Q, Ni Y Y, Chu G Q, 2001. Main palaeoclimatic events of the Quaternary. Quaternary Sciences, (3): 239-248. (in Chinese)

[66]
Liu W, Jin C Z, Zhang Y Q et al., 2010. Human remains from Zhirendong, South China, and modern human emergence in East Asia. Proceedings of the National Academy of Sciences, 107(45): 19201-19206.

[67]
Liu W, Martinón-Torres M, Cai Y J et al., 2015. The earliest unequivocally modern humans in southern China. Nature, 526(7575): 696-699.

[68]
Lu H Y, Han J M, Wu N Q et al., 1994. Analysis of modern soil magnetisation in China and its palaeoclimatic significance. Scientia Sinica Terrae, (12): 1290. (in Chinese)

[69]
Lu H Y, Zhao Y, Yang X D et al., 2024. A preliminary integrated analysis of regional paleoclimate variations in China over the past -21 ka. Global and Planetary Change, 240104510.

[70]
Lu L L, Yao Y F, Wang G A et al., 2023. Palaeobotanical evidence reveals the living conditions of Miocene Lufengpithecus in East Asia. BMC Plant Biology, 23(1).

[71]
Mackay A, Stewart B A, Chase B M, 2014. Coalescence and fragmentation in the Late Pleistocene archaeology of southernmost Africa. Journal of Human Evolution, 7226-7251.

[72]
Mosbrugger V, Utescher T, 1997. The coexistence approach: A method for quantitative reconstructions of Tertiary terrestrial palaeoclimate data using plant fossils. Palaeogeography, Palaeoclimatology, Palaeoecology, 134(1-4): 61-86.

[73]
Nesbitt H W, Young G M, 1982. Early Proterozoic climates and plate motions inferred from major element chemistry of lutites. Nature, 299715-299717.

[74]
Ni J, Cao X Y, Jeltsch F et al., 2014. Biome distribution over the last 22,000 yr in China. Palaeogeography, Palaeoclimatology, Palaeoecology, 40933-40947.

[75]
Ni J, Yu G, Harrison S P et al., 2010. Palaeovegetation in China during the late Quaternary: Biome reconstructions based on a global scheme of plant functional types. Palaeogeography, Palaeoclimatology, Palaeoecology, 289(1-4): 44-61.

[76]
Osman M B, Tierney J E, Zhu J et al., 2021. Globally resolved surface temperatures since the Last Glacial Maximum. Nature, 599(7884): 239-244.

[77]
Pargeter J, Faith J T, 2020. Lithic miniaturization as adaptive strategy: A case study from Boomplaas Cave, South Africa. Archaeological and Anthropological Sciences, 12(9): 225.

[78]
Petraglia M, Clarkson C, Boivin N et al., 2009. Population increase and environmental deterioration correspond with microlithic innovations in South Asia ca. 35,000 years ago. Proceedings of the National Academy of Sciences, 106(30): 12261-12266.

[79]
Plummer T W, Oliver J S, Finestone E M et al., 2023. Expanded geographic distribution and dietary strategies of the earliest Oldowan hominins and Paranthropus. Science, 379(6632): 561-566.

[80]
Poage M A, Feng X H, 2004. A theoretical analysis of steady state δ13C profiles of soil organic matter. Global Biogeochemical Cycles, 18(2): 1-13.

[81]
Potts R, 1998. Variability selection in hominid evolution. Evolutionary Anthropology: Issues, News, and Reviews, 7(3): 81-96.

[82]
Potts R, Dommain R, Moerman J W et al., 2020. Increased ecological resource variability during a critical transition in hominin evolution. Science Advances, 6(43): eabc8975.

[83]
Prentice C, Guiot J, Huntley B et al., 1996. Reconstructing biomes from palaeoecological data: A general method and its application to European pollen data at 0 and 6 ka. Climate Dynamics, 12185-12194.

[84]
Riel-Salvatore J, Barton C M 2004. Late Pleistocene technology, economic behavior, and land-use dynamics in southern Italy. American Antiquity, 69(2): 257-274.

[85]
Scerri E M L, Thomas M G, Manica A et al., 2018. Did our species evolve in subdivided populations across Africa, and why does it matter? Trends in Ecology & Evolution, 33(8): 582-594.

[86]
Shang H, Tong H W, Zhang S Q et al., 2007. An early modern human from Tianyuan Cave, Zhoukoudian, China. Proceedings of the National Academy of Sciences, 104(16): 6573-6578.

[87]
Shipton C, Roberts P, Archer W et al., 2018. 78,000-year-old record of Middle and Later Stone Age innovation in an East African tropical forest. Nature Communications, 9(1): 1832.

[88]
Tarasov P E, Cheddadi R, Guiot J et al., 1998. A method to determine warm and cool steppe biomes from pollen data: Application to the Mediterranean and Kazakhstan regions. Journal of Quaternary Science, 13(4): 335-344.

[89]
Tryon C A, Faith J T, 2016. A demographic perspective on the Middle to Later Stone Age transition from Nasera rockshelter, Tanzania. Philosophical Transactions of the Royal Society B: Biological Sciences, 371(1698): 20150238.

[90]
Villalba-Mouco V, Van De Loosdrecht M S, Rohrlach A B et al., 2023. A 23,000-year-old southern Iberian individual links human groups that lived in Western Europe before and after the Last Glacial Maximum. Nature Ecology & Evolution, 7(4): 597.

[91]
Wang F X, Qian N F, Zhang Y L et al., 1995. Pollen Morphology of Chinese Plants. 2nd ed. Beijing: Science Press. (in Chinese)

[92]
Wang G, Feng X, Han J et al., 2008. Paleovegetation reconstruction using δ13C of soil organic matter. Biogeosciences, 5(5): 1325-1337.

[93]
Wang G A, Jia Y F, Li W, 2015. Effects of environmental and biotic factors on carbon isotopic fractionation during decomposition of soil organic matter. Scientific Reports, 5(1): 11043.

[94]
Wang S Y, Xu X T, Shrestha N et al., 2017. Response of spatial vegetation distribution in China to climate changes since the Last Glacial Maximum (LGM). PLoS ONE, 12(4): e0175742.

[95]
Wang W M, Li C H, Shu J W et al., 2019. Changes in vegetation cover in southern China. Scientia Sinica Terrae, 49(8): 1308-1320. (in Chinese)

[96]
Wang Y J, Cheng H, Edwards R L et al., 2001. A high-resolution absolute-dated Late Pleistocene monsoon record from Hulu Cave, China. Science, 294(5550): 2345-2348.

[97]
Wang Y P, 2018. Emergence and dispersal of the micro-blade technology in North China. Acta Anthropologica Sinica, 37(4): 565-576. (in Chinese)

[98]
Wilkins J, Brown K S, Oestmo S et al., 2017. Lithic technological responses to Late Pleistocene glacial cycling at Pinnacle Point Site 5-6, South Africa. PLoS ONE, 12(3): e0174051.

[99]
Wu Z Y, Ding T Y, 1999. Seed Plants of China. Kunming: Yunnan Science and Technology Press.

[100]
Yang S X, Yue J P, Zhou X Y et al., 2020. Hominin site distributions and behaviours across the Mid-Pleistocene climate transition in China. Quaternary Science Reviews, 248.

[101]
Yang S X, Zhang J F, Yue J P et al., 2024. Initial upper Palaeolithic material culture by 45,000 years ago at Shiyu in northern China. Nature Ecology & Evolution, 8(3): 552-563.

[102]
Yokoyama Y, Lambeck K, De Deckker P et al., 2000, Timing of the Last Glacial Maximum from observed sea-level minima. Nature, 406(6797): 713-716.

[103]
Yu G, Chen X, Ni J et al., 2000. Palaeovegetation of China: A pollen data-based synthesis for the mid-Holocene and last glacial maximum. Journal of Biogeography, 27(3): 635-664.

[104]
Yue J P, Yang S X, Hou Y M et al., 2020. Late Pleistocene lithic technology and human adaptation in Northeast China: A case study from Taoshan site. Quaternary International, 53548-53557.

[105]
Yue J P, Yang S X, Li Y Q et al., 2021. Human adaptations during MIS 2: Evidence from microblade industries of Northeast China. Palaeogeography, Palaeoclimatology, Palaeoecology, 567110286.

[106]
Zeller E, Timmermann A, Yun K-S et al., 2023. Human adaptation to diverse biomes over the past 3 million years. Science, 380(6645): 604-608.

[107]
Zeng Y Q, Li X S, Liu Y J et al., 2024. Quantification of Holocene temperatures in the eastern Hunshandake Sandy Land using δ13C of loess organic matter. Global and Planetary Change, 237104457.

[108]
Zhang J F, Li Y Y, Han Y S et al., 2019. Luminescence dating of weathered sediments from the Paleolithic site of Fengshuzui in northern Hunan province, China. Quaternary Geochronology, 49: 211-217.

[109]
Zhang X M, Ji X P, Li C M et al., 2022. A Late Pleistocene human genome from Southwest China. Current Biology, 32(14): 3095-3109.

[110]
Zhu L D, Jiang Y J, Zhang M Q et al., 2011. Characteristics of magnetic susceptibility and its paleoenvironmental records from JL red earth section, Lushan Area. Journal of Mountain Science, 29(4): 385-394. (in Chinese)

Outlines

/