Research Articles

Chinese investment promoted economic growth while reducing inequality in African countries

  • GUO Tongze , 1 ,
  • DONG Guanpeng 2, 3 ,
  • YANG Dongyang , 2, 3, * ,
  • LIU Dexin 2
Expand
  • 1. College of Resources and Environment, University of Chinese Academy of Sciences, Beijing 100049, China
  • 2. Faculty of Geographical Science and Engineering, Henan University, Zhengzhou 450046, China
  • 3. Key Research Institute of Yellow River Civilization and Sustainable Development, Henan University, Kaifeng 475001, Henan, China
* Yang Dongyang, Associate Professor, E-mail:

Guo Tongze, Master Degree, E-mail:

Received date: 2024-04-05

  Accepted date: 2025-04-23

  Online published: 2025-08-28

Supported by

National Natural Science Foundation of China(42101424)

National Natural Science Foundation of China(42001115)

Abstract

Since 2000, China’s investment in Africa has grown rapidly, following a steady upward trajectory. However, this influx of Chinese capital has sparked both economic and political controversies. By integrating multi-source data—from micro-level individual projects to national statistics—this study examines the impact of Chinese investment on African economic development between 2000 and 2022. The results reveal a significant positive correlation between Chinese investment and economic growth across different scales, with investment-intensive regions achieving stronger economic outcomes. The DID analysis indicates that the Belt and Road Initiative has contributed positively to Africa’s economic development. Both static and dynamic panel models confirm that Chinese investment significantly stimulates growth, exhibiting notable lag effects. Furthermore, β-convergence models demonstrate that Chinese investment fosters economic convergence among African countries. Regarding regional inequality, the findings suggest that Chinese investment helps to narrow disparities across Africa, promoting a more balanced economic landscape. Overall, this research underscores the constructive role of China’s investment in fostering economic growth and reducing inequality within the African context.

Cite this article

GUO Tongze , DONG Guanpeng , YANG Dongyang , LIU Dexin . Chinese investment promoted economic growth while reducing inequality in African countries[J]. Journal of Geographical Sciences, 2025 , 35(6) : 1263 -1285 . DOI: 10.1007/s11442-025-2366-8

1 Introduction

Persistent underdevelopment and economic disparities across most African nations (Gyimah-Brempong, 2002; Shimeles and Nabassaga, 2018) pose significant challenges to global economic rebalancing and the achievement of several United Nations Sustainable Development Goals. China’s engagement with Africa spans nearly seven decades, dating back to the founding of the People’s Republic of China. A pivotal milestone occurred during the 2006 Beijing Summit of the Forum on China-Africa Cooperation (FOCAC), where China introduced a series of pragmatic cooperation initiatives aimed at elevating China-Africa relations to a broader and more substantive level. Since then, both the scale and pace of Chinese investment in Africa have expanded significantly. In 2013, the launch of the Belt and Road Initiative marked a new phase, aiming to strengthen economic partnerships along its route. Consequently, Chinese government bodies and enterprises have continuously increased their investments and aid efforts across Africa, ushering in a new era of high-quality collaboration.
Today, China stands as a major trading partner for Africa (Cui, 2022), and strengthened China-Africa ties have contributed notably to Africa’s socio-economic development (Duggan, 2023). By the end of 2020, China’s cumulative investment in Africa surpassed USD 43.4 billion, cementing China’s role as a significant investor on the continent (Opoku and Song, 2023). These investments have expanded infrastructure coverage and quality (Zhao et al., 2024), stimulated economic growth (Zhao et al., 2022), alleviated unemployment through labor-intensive projects, and helped mitigate internal conflicts (Huang et al., 2016). Moreover, Chinese investments have facilitated technology transfer, advancing the technological capacities of host nations (Jiang et al., 2018; Park and Tang, 2021).
Despite being rich in resources, Africa remains one of the least economically developed regions globally (Jerven, 2010). Since the 20th century, African nations have actively pursued partnerships with global actors, achieving notable economic progress—evident in the impressive 4.7% average annual growth rate between 2000 and 2017 (African Union Commission and OECD, 2018). Nevertheless, the past decade has seen widening inequalities both between and within countries (Van De Walle, 2009; African Union Commission and OECD, 2018), with regional disparities particularly pronounced (Kaulihowa and Adjasi, 2018). China’s approach to cooperation emphasizes mutual benefit. Its foreign direct investment (FDI) is widely recognized for promoting economic growth and inclusive development across Africa (Sylvaire et al., 2022). However, debates persist regarding the broader impacts of Chinese investment, with some evidence suggesting potential negative effects (Cooper, 2019; Munjal et al., 2022).
Given these conflicting perspectives, the effects of Chinese investment on Africa’s economic development have become a critical area of inquiry. This study investigates how Chinese investment affects both economic growth and regional inequality across Africa. Specifically, we analyze temporal trends in economic growth and Chinese investment, explore spatial correlations between investment and economic outcomes, and apply panel data models to identify causal impacts. By focusing on economic growth and inequality, this research provides fresh insights into the developmental consequences of Chinese investment in Africa. The structure and key concerns of this study are introduced in the following sections.

2 Context and literature review

Following the conclusion of the Second World War, a wave of African nations embarked on the path to independence, creating a new group of sovereign states. During this pivotal period, China strengthened its engagement with emerging African nations. The Bandung Conference of 1954 marked a major turning point, where China introduced the Five Principles of Peaceful Coexistence: mutual respect for sovereignty, non-aggression, non-interference in internal affairs, equality and mutual benefit, and peaceful coexistence. These principles laid the foundation for China’s diplomatic relations with Africa (Muekalia, 2004). China’s investment in Africa began in the late 1950s (Li, 2006), initially driven by political motives and largely structured as unilateral aid. Over time, China’s approach evolved from purely political considerations to economic-oriented strategies, combining aid with commercial investments.
Particularly in the 21st century, under the “going global” strategy, China’s investments expanded rapidly. The establishment of FOCAC in 2000 symbolized a milestone, propelling Chinese investment in Africa into a phase of unprecedented growth (Kobylinski, 2012). The volume of Chinese FDI soared from USD 100 million in 2000 to USD 1 billion by 2006, and the number of investment projects grew from 100 to over 9000 by 2022, positioning China as a key investment partner in Africa.
Theoretical frameworks have long linked foreign direct investment (FDI) to economic development. The Two-Gap Model (Chenery and Strout, 1967) argues that foreign capital can bridge savings and foreign exchange gaps in developing economies, thus facilitating growth. Neoclassical growth theories, such as the Solow-Swan model (Solow, 1956), view FDI as a component of capital accumulation, influencing short-term growth. Meanwhile, endogenous growth theories (Lucas, 1988; Romer, 1990; Aghion and Howitt, 1992) emphasize FDI’s role in promoting long-term growth through technology transfer, managerial expertise, and human capital development. Spatial economic theories (Krugman, 1991) further argue that FDI can drive regional growth but may also exacerbate inequality depending on absorption capacities.
Empirical evidence generally supports a positive relationship between FDI and economic development (Agosin and Machado, 2005; Hansen and Rand, 2006; Mehic et al., 2013; Wu et al., 2020; Hu et al., 2021). FDI contributes through capital accumulation (Bengoa and Sanchez-Robles, 2003), technology spillovers (Borensztein et al., 1998), and improvements in capital efficiency (Suyanto and Salim, 2010). Liu and Zou’s research highlights that the spillover effects of FDI in China are unevenly distributed across different regions (Liu and Zou, 2008). However, research also highlights that FDI’s impact depends on host-country conditions, including governance quality, absorptive capacity, and development stage (Asongu and Odhiambo, 2020; Odhiambo, 2022; Udeh, 2025). Methodologically, while traditional econometric techniques like regression and panel data models dominate, more advanced methods—such as instrumental variable (IV) approaches and Difference-in- Differences (DID)—and dynamic panel models are increasingly utilized to uncover causal mechanisms.
Regarding Chinese FDI in Africa, studies generally report positive effects. For instance, Donou-Adonsou and Lim (2018) compared the impact of China’s FDI to that of the U.S., France, and Germany on Africa’s economic performance and found that China’s FDI had a positive impact on income in Africa. Sylvaire et al. (2022) documented that China’s FDI promotes the African economy through direct investments. Abekah-Koomson and Eugene Chinweokwu (2020) used the Pesaran Autoregressive Distributive lag model, and identified a negative growth link between China’s FDI to African economic growth, but documented that there was no short-term effect. The above studies typically include specific development indicators, such as the employment index, openness level, inflation coefficient, financial development, etc., as control variables. However, urbanization level and industrial structure reflect the stage and model of economic development, and they have a significant impact on economic growth. There may be substantial differences between countries in terms of these factors. By controlling for urbanization level and industrial structure, we can more accurately assess the independent impact of FDI on economic growth and capture the heterogeneity of its effects across different regions. In addition to economic growth, regional inequality is a critical facet of economic development. Fleisher et al. (2010) have demonstrated early that FDI and human capital promote economic convergence in China. However, empirical studies the impacts of China’s FDI on regional inequality in Africa have been limited, with only a handful of studies tentatively involved this issue. For example, Zheng (2015) conducted empirical research on the poverty reduction effect of China’s FDI in Africa, using data from 21 African countries during 2003-2011, and found an inverted U-shaped relationship between China’s FDI and poverty (GDP per capita), suggesting that once China’s FDI reaches a specific threshold, it can significantly reduce poverty in Africa. Obobisa et al. (2021) noted that China’s FDI can stimulate economic growth in low-middle and low-income countries in Africa but showed a significant negative relationship in upper-middle-income African countries. Abekah-Koomson and Eugene Chinweokwu (2020) used the Gini index as a proxy variable for income inequality to explore the relationship between China’s FDI and income inequality in Africa and concluded that China’s FDI had a limited effect on promoting equitable income distribution in Africa.
There is still inconsistency in the existing literature regarding the long-term and short-term impacts of Chinese investment on economic growth in Africa. In particular, the spatial correlation between Chinese investment and African economic growth, as well as the impacts of Chinese investment on economic inequality in Africa, remain significant gaps in the current literature. Hence, this study aims to delve further into the following questions: Has China’s investment contributed to Africa’s economic growth? In which regions of Africa is economic growth closely associated with China’s investment? Does China’s investment work to reduce regional inequality in Africa?

3 Data and methods

3.1 Research area

Africa, situated in the western part of the eastern hemisphere, encompasses a vast expanse of approximately 30.3 million square kilometers, constituting nearly 20% of the world’s total land area. With a population of approximately 1.286 billion people, it ranks as the second-largest continent globally, surpassed only by Asia, and currently comprises 65 countries and territories. Africa is abundantly endowed with natural resources, forming a robust foundation for its development. However, it remains the continent with the lowest wealth per capita. Sub-Saharan Africa, in particular, grapples with pervasive poverty. The number of individuals living in poverty in this region escalated from 278 million in 1990 to 413 million in 2015. Projections indicate that by 2050, approximately half of the world’s population growth will be concentrated in Africa. This ongoing demographic expansion is likely to intensify inequalities in resource distribution. For the purposes of this research, a total of 49 African countries were selected for investigation (Figure 1), acknowledging the constraints imposed by data limitations.
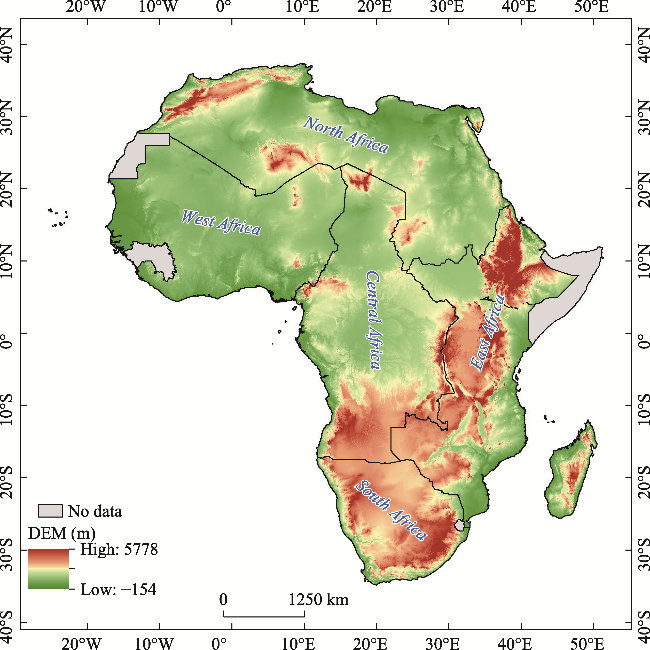
Figure 1 Location and landforms of Africa

3.2 Data and key variables

3.2.1 Night-light revised GDP data

The accuracy of statistical data in Africa has often been a subject of concern, as it may introduce errors into analyses and, consequently, affect research outcomes. A major challenge is the lack of sub-national scale data. In contrast to conventional statistical data, nighttime light data provide a practical solution by enabling more granular assessments of economic conditions. Nighttime light data are frequently used in research examining shifts in economic activity (Jean et al., 2016). A discernible correlation exists between nighttime light data and economic development, making it a valuable indicator of regional economic progress (Chen and Nordhaus, 2011; Henderson et al., 2012; Guerrero and Mendoza, 2019). These data have been effectively applied in empirical studies (Bunte et al., 2018). Consequently, this study employs night-light revised GDP (LGDP) data alongside conventional statistics to assess Africa’s economic development. However, a primary limitation is the lack of comparability between the two most widely used nighttime light datasets, which restricts the available data series. To address this issue, the paper uses corrected GDP data for nighttime lights from Kummu et al. (2025), including grid total GDP data (LGDP) and GDP per capita (LGDP per capita) data. This dataset integrates nighttime light data with GDP information, providing a more accurate representation of a region’s developmental status at a finer scale.

3.2.2 Geo-coded investment projects

The geocoded data on Chinese investments used in this research were sourced from the Global China Official Finance Dataset, publicly released by the College of William & Mary (Cheng and Taggart, 2023). This dataset includes all Chinese investment projects signed between 2000 and 2021, providing detailed records of when the projects were signed, implemented, and completed, with project completion dates spanning from 2000 to 2023. Notably, the dataset is a meticulously curated compilation of China’s official projects globally, derived from comprehensive media surveys. It goes beyond simple documentation by incorporating geocoding, a process that assigns precise geographic coordinates and attribute values to each individual aid program. The dataset reveals a total of 9348 official projects in Africa, constituting a substantial 44.55% of all overseas projects documented. Figure 2 illustrates the sectoral distribution of Chinese investments in Africa. The ‘Health’ sector emerges as the primary recipient, accounting for the largest share at 12.18%, or 1139 projects. It is followed by the ‘Education’ and ‘Government and Civil Society’ sectors, which represent 12.67% (1185 projects) and 8.87% (830 projects), respectively. Notably, the ‘Others’ category receives less than 3% of the total investments, with none of the sectors surpassing 230 projects.
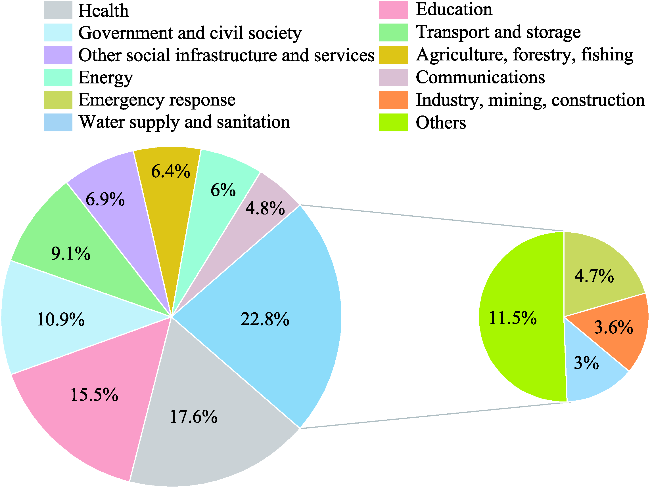
Figure 2 Investment sector distribution
Figure 3 illustrates the temporal evolution of investment projects. The dataset includes a total of 9348 projects in Africa. The data reveals a general upward trend in the number of projects over time. Overall, the trend demonstrates a steady increase in the number of Chinese investment projects each year. In 2000, there were only 18 investment projects, but by 2007, the number had exceeded 181. The growth in projects continues through 2020, from 181 in 2007 to 709 in 2020. The relative decline after 2020 can be attributed to a lag in capturing investment projects in the data. Nevertheless, China’s investment in Africa continues to show an upward trend in the number of projects.
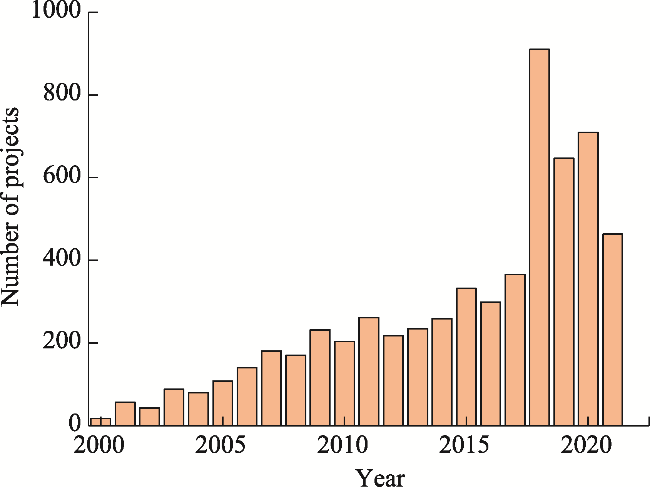
Figure 3 Changes in investment projects

3.2.3 Data for Chinese investment

The data on Chinese investments in Africa are sourced from foreign direct investment bulletins published by the Chinese government over several years. It is noteworthy that the Chinese government’s data collection initiative began in 2003. As a result, the timeframe for the outbound investment data examined in this research spans from 2003 to 2022. This specific timeframe aligns with previous research, ensuring consistency with the outbound investment data used in earlier studies.

3.2.4 World bank data

This research employs a diverse set of economic indicators to analyze the economic impact of Chinese investments in African countries. These indicators include Gross Domestic Product (GDP), GDP per capita (PGDP), wealth inequality measured by the Top 10% share (WI), value added by agriculture, forestry, and fishing, and the degree of foreign trade dependence. The data used in this analysis have been carefully sourced from the World Bank, and all figures are presented in constant prices.

3.3 Methods

3.3.1 ESDA methods

In this study, we used correlation analysis to examine the relationship between economic growth and Chinese investment. Correlation analysis is a widely used statistical method, and its specific details are not discussed further here. Additionally, we applied the bivariate Local Indicator of Spatial Association (bLISA) method, as introduced by Anselin et al. (2002), to investigate the spatial associations between economic growth and Chinese investment. The bLISA is a local variant of the bivariate Moran’s I statistic, defined as follows:
$I_{k l}^{i}=Z_{k}^{i} \sum_{j=l}^{n} W_{i j} Z_{l}^{i}$
where Wij represents the spatial weight matrix, $Z_{k}^{i}=\left[x_{k}^{i}-\overline{x_{k}}\right] / \sigma_{k}$, $Z_{k}^{i}=\left[x_{k}^{j}-\overline{x_{l}}\right] / \sigma_{l}$, $x_{k}^{i}$ is the variable k at position i, $x_{l}^{j}$ is the observed value l at position j, σk and σl are the variances of xk and xl. respectively.

3.3.2 Difference-in-Difference model

The Difference-in-Differences (DID) model is a powerful tool for evaluating policy effects. In this study, we used the DID model to assess the impact of China’s investment policy on economic development in Africa. Specifically, this research examines the effects of China’s Belt and Road Initiative, which has gradually increased China’s cooperation and investment with African countries since its introduction. China is now making significant investments in infrastructure, industry, and livelihood projects. Therefore, this study designates 2013 as the policy shock point. To investigate the economic impact of China’s policy on African countries, we divided the sample into 28 treatment groups and 21 control groups based on the official list of Belt and Road cooperation countries published by the Chinese government. The final model is constructed as follows:
$\ln G D P_{c t}=\alpha+\beta_{0} t t_{c t}+r_{c}+\mu_{t}+\omega_{c t}$
$\ln G D P_{c t}=\alpha+\beta_{0} t t_{c t}+\beta_{i} X_{c t}+r_{c}+\mu_{t}+\omega_{c t}$
where lnGDPct is the explanatory variable, which represents the economic status of Africa. This data are statistical GDP data and night-light revised GDP data, respectively. ttct is the interaction term between the period dummy variable and the treatment group dummy variable. Xct is a set of time-varying host country characteristic variables, rc is a country-fixed effect, μt is a time-fixed effect, ωct is the random error term, where Xct includes: (1) urban population share representing urbanization rate (UPUA); (2) value added of agriculture, forestry, and fisheries as a percentage of GDP (GFFG); and (3) foreign trade dependence (FTD).

3.3.3 Static panel model

To examine the impact of Chinese investment on economic development in African countries, this paper uses panel data econometric models. We constructed the following regression model to assess the effects of China’s investment on economic growth in Africa:
$L G D P_{c t}=\alpha+\beta_{0} F D I_{c t}+\beta_{i} X_{c t}+r_{c}+\omega_{c t}$
$G D P_{c t}=\alpha+\beta_{0} F D I_{c t}+\beta_{i} X_{c t}+r_{c}+\omega_{c t}$
where LGDPct or GDPct denotes the measure of economic development in Africa, using either LGDP or statistical GDP data as indicators, respectively. FDIct is the logarithm of Chinese FDI stock, Xct is a set of time-varying host country characteristic variables, consistent with the DID model mentioned above, rc represents a country-fixed effect, and ωct is a random error term.

3.3.4 Dynamic panel model

It is well-documented that the economic impacts of investments often exhibit a lag (Duffy-Deno and Eberts, 1989). In light of this, this research introduces an extension to the original panel model. This extension involves including FDI stocks with a one-year lag as control variables, with the objective of differentiating between the economic effects of current-period FDI and those from the previous period. This approach accounts for the temporal dynamics of investment effects on economic development.
$L G D P_{c t}=\alpha+\beta_{0} F D I_{c t}+\beta_{0} F D I_{c t-1}+\beta_{i} X_{c t}+r_{c}+\omega_{c t}$
$G D P_{c t}=\alpha+\beta_{0} F D I_{c t}+\beta_{0} F D I_{c t-1}+\beta_{i} X_{c t}+r_{c}+\omega_{c t}$
where FDIct-1 represents the lagged term of FDI, and the remaining variables remain consistent with the DID model.

3.3.5 β-convergence model

This paper uses the β-convergence model to explore economic convergence in Africa and the impact of Chinese investment on regional inequality in Africa. The model is defined as follows:
$P G D P_{c t}=\alpha+\beta_{0} P G D P_{c t-1}+r_{c}+\omega_{c t}$
$P G D P_{c t}=\alpha+\beta_{0} P G D P_{c t-1}+\beta_{1} F D I_{c t}+\beta_{i} X_{c t}+r_{c}+\omega_{c t}$
where PGDP denotes GDP per capita, concluding statistical GDP data and light-night revised GDP data. The remaining variables remain consistent with the DID model. Model (8) is the absolute β-convergence model, and model (9) is the conditional β-convergence model.

3.3.6 Regional inequality model

In addition, the coefficient of variation (CV) is a commonly used statistic that measures the degree of dispersion in sample data. To examine the impact of China’s investment on regional inequality in Africa, we use LGDP to calculate the CV values at the country scale in Africa. We also use African country-level WI data as another indicator to assess regional inequality. Using CV and WI, we constructed the inequality models as follows:
$C V_{c t}=\alpha+\beta_{0} F D I_{c t}+\beta_{i} X_{c t}+r_{c}+\omega_{c t}$
$W I_{c t}=\alpha+\beta_{0} F D I_{c t}+\beta_{i} X_{c t}+r_{c}+\omega_{c t}$
where CVct or WIct represent the degree of regional inequality in African countries, using calculated CV data and WI data as indicators, and the remaining variables remain consistent with the DID model.

4 Results analysis

4.1 Temporal variations in African economies and Chinese investment

As shown in Figure 4, both the recalculated GDP data from LGDP and the official GDP data for Africa indicate steady growth from 2003 to 2022, reflecting the growth trend of China’s investment stock. Over these 20 years, total GDP expanded by more than 100%. When comparing GDP and LGDP, the latter not only shows larger values but also exhibits a more moderate and stable growth trend. The difference between the two is primarily due to the World Bank omitting individual countries from its statistics, creating discrepancies. In contrast, China’s investment stock demonstrated near-exponential growth, increasing from USD 613.87 billion in 2003 to USD 4202.724 billion in 2021. Notably, the growth of this investment stock was slow between 2003 and 2006, before accelerating from 2007 onwards, and has shown consistent growth since then.
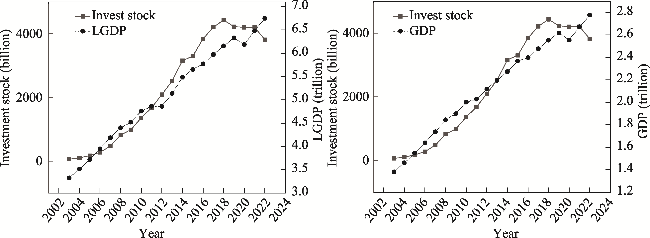
Figure 4 Changes in GDP and investment stock in Africa over the years
Furthermore, we use raster-scale LGDP data to calculate the CV for Africa, which serves as an indicator of regional inequality across the continent. Its temporal variation is shown in Figure 5. Overall, Africa’s CV displayed a decreasing trend from 2003 to 2014, dropping from 9.01 in 2003 to 8.70 in 2013. Upon examining specific periods, the CV exhibited a fluctuating pattern: it decreased annually from 2003 to 2013, increased each year between 2014 and 2020, and then resumed its declining trend. The inequality indicator, in contrast, decreased sharply between 2003 and 2016, from 0.67 in 2003 to 0.66 in 2016, and has remained relatively stable since then.
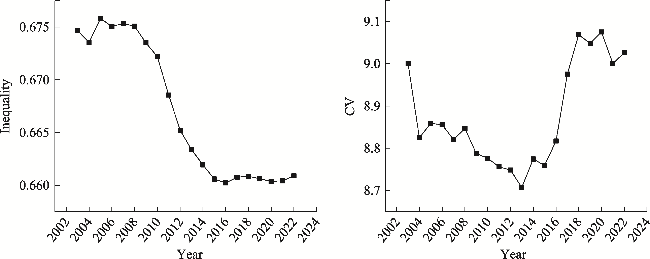
Figure 5 Temporal variation of CV in Africa

4.2 Spatial patterns of African economies and Chinese investment

To analyze the spatial patterns of African economies and Chinese investment, we select key indicators, including LGDP in 2022, the trend in LGDP variation (the slope of the linear regression of LGDP and year from 2003 to 2022), Chinese investment stock, and the point density of Chinese investment projects. These indicators were categorized into five distinct levels. The results are presented in Figure 6. As shown in Figure 6a, the economic status of the majority of African countries predominantly falls within the low and medium-low categories, with fewer countries reaching the high and medium levels. The high and medium-high economic levels are primarily concentrated in countries such as South Africa, Nigeria, Egypt, Morocco, Kenya, Ethiopia, and Algeria. The medium level is concentrated in countries such as Tunisia, Libya, Sudan, and Tanzania. While the medium-low and low levels are fairly evenly distributed, they do exhibit clustering patterns in the South and West Africa regions. Notably, countries with high-level economic performance are all coastal nations. Furthermore, the relatively superior economic situation in North Africa, compared to other regions, can be attributed to initial economic accumulation in this area.
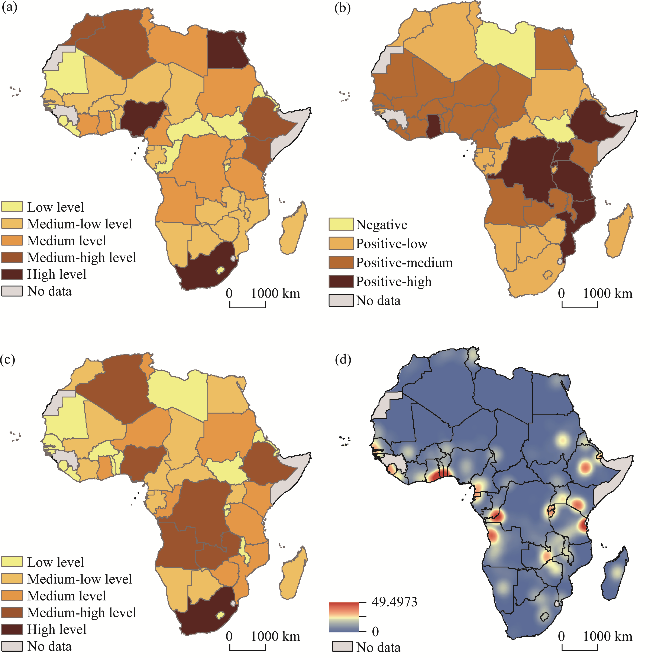
Figure 6 Multi-scale distribution of investment and economic growth: (a) LGDP of African countries in 2022; (b) LGDP growth trend of African countries at the end of the period; (c) Cumulative Chinese investments; (d) Kernel density of investment projects
As shown in Figure 6b, except for Libya and South Sudan, all African countries display positive growth. Conversely, countries exhibiting positive growth primarily fall within the low and medium levels, with only a few at the high level. The low level is clustered in the South African and North African regions. Overall, Africa is experiencing positive growth. Figure 6c illustrates the spatial distribution of China’s cumulative investment in Africa, demonstrating that China’s investments are primarily concentrated in countries such as South Africa, Zambia, Angola, the DR Congo, Algeria, and Nigeria. Regionally, Central Africa and Southern Africa have more countries at the high level. This suggests that Chinese investments are primarily focused on the Central Africa, North Africa, and Southern Africa regions. Generally, Chinese investment in Africa is concentrated in resource-rich countries like South Africa, Zambia, and Algeria, which are abundant in mineral and oil resources, thereby attracting more Chinese investment. Furthermore, domestic political stability significantly influences Chinese investment, as evidenced by countries with unstable situations like Côte d’Ivoire, Libya, and South Sudan, where Chinese investment remains low. Lastly, combining the insights from Figures 6a and 6c, it is apparent that Chinese investment also tends to favor countries with robust economic foundations, such as South Africa, Algeria, and Nigeria.
To analyze the spatial distribution of Chinese investment projects in Africa, we employed the kernel density approach to compute the density map of Chinese investment projects, shown in Figure 6d. From Figure 6d, it is evident that Chinese investment is primarily concentrated in southern West Africa, western Central Africa, and East Africa. Ethiopia, Kenya, Tanzania, Congo, the DRC, and Angola are countries with more intensive Chinese investment. The number of projects in North and South Africa is relatively low. Combining Figures 6b and 6d, countries with high Chinese investment, such as Ethiopia, Kenya, Tanzania, and Congo, tend to have a relatively better level of economic growth (medium-low or medium). In contrast, countries in West Africa (excluding the South) have fewer investment projects and lower economic growth.

4.3 The spatial relationship between African economies and Chinese investment

4.3.1 Correlation of investment and economic growth

We used the buffer analysis and zoning statistics tool within ArcGIS 10.8 to compute investment density in Africa across various scales, including national, sub-national, and a grid-based 200 km scale. Different buffer sizes of 200 km, 100 km, and 50 km were applied. Using the LGDP data, we calculated the economic growth rate at the regional scale for Africa. A correlation analysis was then conducted to investigate the relationship between investment density and economic growth at these distinct scales. The detailed results are presented in Table 1.
Table 1 Multi-scale investment and economic growth correlation
Variable Correlation coefficient p value
National scale Economic growth-Investment stock 0.175 p<0.21
Economic growth-Investment density 0.311 p<0.03
Sub-national scale Economic growth-Investment density 0.154 p<0.01
Grid scale (200 km) Economic growth-Investment density 0.154 p<0.01
Buffer zone (200 km) Economic growth-Investment density 0.101 p<0.01
Buffer zone (100 km) Economic growth-Investment density 0.067 p<0.01
Buffer zone (50 km) Economic growth-Investment density 0.114 p<0.01
There is a significant positive correlation between economic growth and investment across distinct scales. The national scale exhibits the highest correlation coefficient between economic growth and investment density at 0.311 (p<0.01), while the correlation coefficient between economic growth and investment stock is 0.175 (p<0.21), which is smaller than the 0.311 (p<0.03) observed for investment density. The correlation coefficient at the sub-national scale is 0.154 (p<0.01), and the correlation coefficient at the grid scale is also 0.154 (p<0.01). Among the different buffer sizes, the 50 km buffer has the highest correlation coefficient of 0.114 (p<0.01), followed by the 200 km and 100 km buffers with coefficients of 0.101 (p<0.01) and 0.067 (p<0.01), respectively. It is evident that the significance of the correlation coefficient decreases as the spatial range increases. These variations can be attributed to the spatial dispersion of Chinese investment, where investment density fluctuates significantly across spatial scales, resulting in a flexible correlation. Overall, Chinese investment consistently maintains a positive correlation with economic growth across all scales considered.

4.3.2 Bivariate spatial correlation of investment and economic growth

Table 2 presents the bivariate Moran’s I indices for investment stock, investment density, and economic growth across various scales. Across all scales, the Moran’s I indices for economic growth and investment fall within a low range (between 0.1 and 0.2) and pass the significance test. Our spatial analysis reveals a statistically significant positive interdependence between regional economic growth and capital investment indicators (both stock and density metrics) across all examined scales (p<0.05). While this spatial association demonstrates generally robust effect sizes, notable scale-dependent variation in correlation magnitudes is observed.
Table 2 Spatial association results of economic growth and investment at different scales
Variable Moran’s I p value
National Scale Economic growth-Investment stock 0.119 p<0.05
Economic growth-Investment density 0.187 p<0.05
Sub-national scale Economic growth-Investment density 0.100 p<0.01
Grid-scale (200 km) Economic growth-Investment density 0.137 p<0.05
To further explore the relationship between China’s investment and economic growth in Africa, we examined the spatial association between investment and economic growth at three scales using the bivariate local Moran’s I. The results are presented in Figure 7. The spatial patterns are primarily categorized into High-High (H-H), Low-High (L-H), High-Low (H-L), and Low-Low (L-L). As shown in Figure 7, economic growth and investment density exhibit similar spatial patterns across different scales. However, the spatial patterns of economic growth with investment stock and investment density vary significantly at the national scale. At this scale, the spatial patterns of economic growth and investment stock are mainly H-L and H-H, while the spatial patterns of economic growth and investment density are more diverse, encompassing all four spatial agglomeration patterns. Notably, at the national scale, the spatial pattern of economic growth with investment density is primarily dominated by L-L, H-L, and H-H. L-L is predominantly observed in the North Africa region, while H-H is found in DR Congo, Uganda, Rwanda, and Tanzania. H-L is observed in Egypt, Chad, and Morocco, and L-H is present in Burundi.
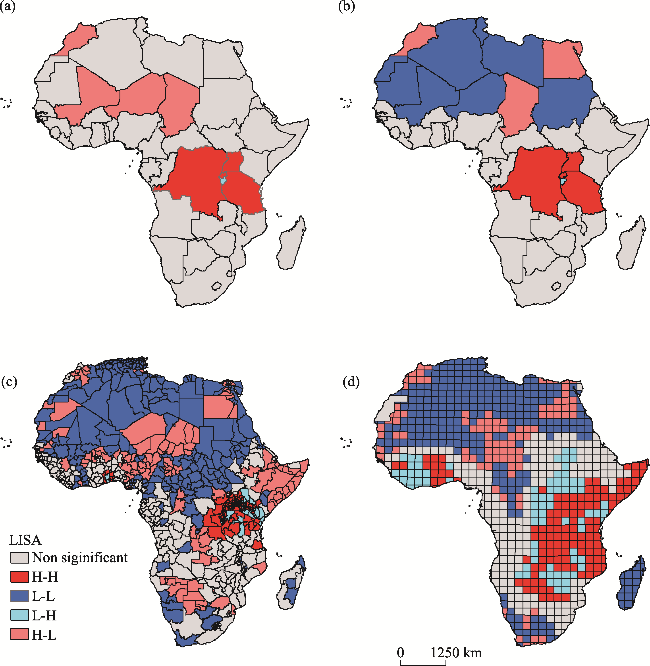
Figure 7 Spatial correlation of economic growth and investment in Africa at multiple scales: (a) National-scale investment stock and economic growth; (b) National-scale investment density and economic growth; (c) Sub-national scale investment density and GDP growth; (d) Grid-scale (200 km) investment density and GDP growth
At the sub-national scale, all four patterns are observed. A clear spatial clustering is evident at this scale. H-H is mainly concentrated in the regions of DR Congo, Uganda, Rwanda, and Tanzania. H-L shows spatial clustering in parts of Egypt, Chad, Niger, Somalia, Ethiopia, Angola, and Botswana. L-H is predominantly present in parts of Uganda, Kenya, and Burundi. L-L is the most widespread of the four spatial patterns, encompassing most of the North African region, as well as the western part of West Africa, the border between Central and East Africa, and the southern part of the South Africa region. Overall, the spatial patterns at the sub-national scale are broadly consistent with those at the national scale, with the sub-national scale serving as an extension of the national scale.
At the grid scale, the agglomeration effect is more pronounced, with L-L and H-H being the most noticeable agglomeration patterns. The spatial distribution of L-L is generally consistent with the sub-national scale and is primarily located in the North and West African regions, while H-H is predominantly found in the inland and coastal areas of East Africa, as well as in the southern part of West Africa. The spatial extent of H-H has increased compared to the national and sub-national scales. The spatial distribution of H-L also aligns with the sub-national scale, while L-H is mainly concentrated around the H-H areas, primarily in East and West Africa.

4.4 The policy effect of Chinese investment on economic growth in Africa

4.4.1 Baseline regression results and parallel trend tests

Using GDP and LGDP data, this paper employs the Difference-in-Differences (DID) method to assess the impact of the Belt and Road Initiative on Africa’s economic development. The results of the baseline regression are presented in Table 3. It is evident that the coefficients of the policy variable (tt) are 0.314 and 0.148 (p<0.01) before controlling for additional variables, and 0.852 (p<0.01) and 0.149 (p<0.01) after controlling for the related variables. These results indicate that the Belt and Road Initiative has significantly contributed to the economic development of Africa.
Table 3 Results of baseline regression
GDP model (1) GDP model (2) LGDP model (3) LGDP model (4)
Constant 22.483*** 7.642*** 24.120*** 24.140**
(150.75) (5.58) (2895.73) (241.37)
tt 0.314 0.852*** 0.148*** 0.149***
(0.92) (3.34) (7.75) (8.00)
UPUA 1.188*** 0.003
(3.23) (0.107)
AFFG 1.878*** -0.062***
(10.92) (-4.95)
FTD 1.408*** 0.036***
(17.85) (6.28)
R2 0.003 0.447 0.190 0.214
Sample size 960 960 960 960

Note: *** indicates a coefficient is statistically significant (p<0.01); ** indicates a coefficient is statistically significant (p<0.05); * indicates a coefficient is statistically significant (p<0.1).

The impact of other control variables on economic development in Africa exhibits a differentiated pattern. In the GDP model, the coefficients of UPUA, AFFGA, and FTD are 1.188 (p<0.01), 1.878 (p<0.01), and 1.408 (p<0.01), respectively, and all are statistically significant. In contrast, in the LGDP model, the coefficient for AFFGA is -0.062 (p<0.01), significantly negative, while the coefficient for FTD is 0.036 (p<0.01), significantly positive. Combining the results from both models, it is clear that foreign trade significantly contributes to economic development in Africa. The variation observed in AFFGA may be attributed to differences in the data sources, as the night-light corrected data is more sensitive to urban areas and less sensitive to agricultural regions. Nonetheless, the results clearly indicate that Chinese investment and foreign trade are the main drivers of economic development in Africa.
The dynamic effect and parallel trend of the Belt and Road Initiative are tested, and the results are shown in Figure 8. To avoid covariance, we removed the pre_1 variable. Both for the GDP data and the GDP data corrected for night lighting, we observe that after the implementation of the Belt and Road Initiative, the coefficient gradually deviates from zero, moving away from its original value below zero. This indicates that the model passes the parallel trend test. Taken together, the effects of the policy begin to emerge two years after its implementation, reaching their maximum impact in the fourth year.
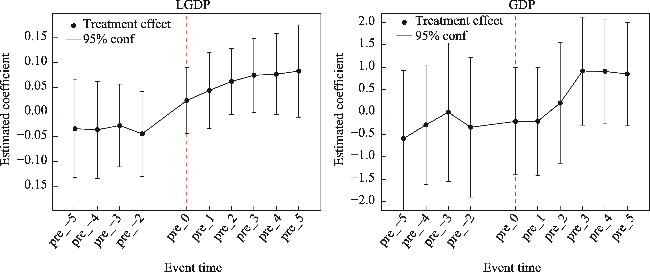
Figure 8 The results of parallel trend

4.4.2 PSM-DID model test

To address the systematic differences between the experimental and control groups, the PSM-DID method was employed for robustness estimation. The results are presented in Table 4. Before performing the PSM-DID estimation, the model is first tested to ensure it satisfies the common support assumption. This assumption holds if there is no significant difference between the means of the control variables for the experimental and control groups after matching. If no significant difference is observed, the common support assumption is satisfied, meaning the PSM-DID method is appropriate for use. Table 4 demonstrates that there is no significant difference in the means of the control variables after matching, indicating that the PSM-DID method applied in this study is effective.
Table 4 The results of PSM
Treat Control Std (%) t p value
UPUA Before 3.728 3.614 22.46 3.448 0.001
After 3.728 3.699 6.20 0.817 0.414
AFFG Before 2.643 2.719 -7.54 -1.147 0.252
After 2.643 2.593 4.72 0.576 0.565
FTD Before 3.724 3.758 -2.54 -0.388 0.698
After 3.724 3.771 -3.47 -0.429 0.666

Note: *** indicates a coefficient is statistically significant (p<0.01); ** indicates a coefficient is statistically significant (p<0.05); * indicates a coefficient is statistically significant (p<0.1).

For the specific estimation, a radius of 0.05 was used for matching. Afterward, modeling was conducted using the matched data, and the results are presented in Table 5. The findings indicate that the Belt and Road Initiative significantly promotes Africa’s economic development. These results are consistent with those of the baseline regression, showing no difference in significance, thus further confirming the positive impact of the Belt and Road Initiative on Africa’s economic development.
Table 5 PSM-DID regression results
GDP model (1) GDP model (2) LGDP model (3) LGDP model (4)
tt -0.085 0.653*** 0.194*** 0.192***
(-0.21) (2.13) (8.60) (8.63)
Constant term 22.721*** 7.972*** 24.280*** 24.324***
(115.95) (5.378) (2208.44) (241.64)
Control variables No Yes No Yes
Sample size 960 960 960 960
R2 -0.002 0.462 0.293 0.317

Note: *** indicates a coefficient is statistically significant (p<0.01); ** indicates a coefficient is statistically significant (p<0.05); * indicates a coefficient is statistically significant (p<0.1).

4.4.3 Placebo test

To verify whether the omission of key variables led to biased results, we conducted a placebo test using a randomly generated experimental group. To capture a general pattern, the process was iterated 500 times. The final results, including the distribution of the p value and interaction term coefficient, are presented in Figure 9. The mean value of the regression coefficients approximates zero, while the true coefficients appear as distinct outliers in the figure. This provides evidence that our estimates are not biased by the omission of any variables, thereby validating the use of the placebo test in this study.
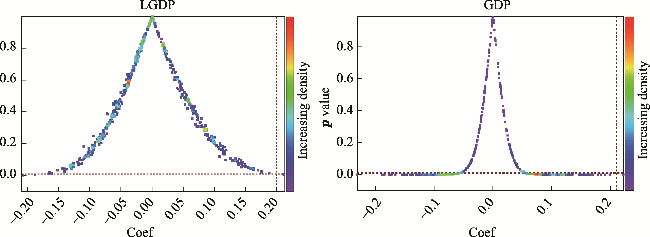
Figure 9 The results of placebo test

4.5 Impact of Chinese investment on economic development in Africa

4.5.1 The impact of Chinese investment on economic growth in Africa

In this study, we utilized both LGDP data and statistical GDP data for analysis. Panel data models, β-convergence models, and inequality models were employed to assess the impact of China’s FDI on economic growth and regional inequality in Africa. The results of the static and dynamic panel analyses are presented in Table 6.
Table 6 Static panel and dynamic panel
LGDP
Static panel
GDP
Static panel
LGDP
Dynamic panel
GDP
Dynamic panel
Constant 22.989*** 16.143*** 23.152*** 16.514**
(184.30) (52.53) (189.15) (49.83)
Invest 0.078*** 0.047*** 0.024*** 0.018***
(22.05) (12.86) (2.82) (2.87)
Investn-1 0.054*** 0.030***
(7.28) (5.19)
UPUA 0.161*** 1.893*** 0.020*** 1.791***
(4.80) (21.65) (3.69) (18.95)
AFFG -0.062*** -0.068*** -0.057*** -0.074***
(-3.75) (-5.16) (-3.53) (-5.60)
FTD 0.017** 0.010 0.018** 0.011*
(2.41) (1.57) (2.55) (1.65)
R2 0.411 0.684 0.398 0.697
Sample size 960 960 912 912

Note: *** indicates a coefficient is statistically significant (p<0.01); ** indicates a coefficient is statistically significant (p<0.05); * indicates a coefficient is statistically significant (p<0.1).

From the static panel model in Table 6, it is observable that regardless of whether night light data or GDP data are used, the coefficients of FDI are 0.078 (p<0.01) and 0.047 (p<0.01), respectively. Both coefficients in the LGDP static panel and GDP static panel are positive, strongly suggesting that Chinese investment significantly contributes to economic development in Africa. The coefficients of UPUA in the LGDP static panel and GDP static panel are 0.161 (p<0.01) and 1.893 (p<0.01), respectively, and both are significant, indicating that urbanization promotes economic development in the African region. Regarding AFFG, the coefficient is -0.062 (p<0.01) and significant for the LGDP static panel, and -0.068 (p<0.01) and significant for the GDP static panel. For FTD, in the LGDP static panel, the coefficient is 0.017 (p<0.05) and significant, while in the GDP static panel, the coefficient is 0.010.
The results in the dynamic panel model are mostly consistent with those in the static panel, with lagged terms for the investment variables included to capture the dynamic effects of Chinese investment on African economies. Compared to the static panel model, the positive and significant coefficients in the dynamic panel model are largely consistent, with the exception of the coefficient of UPUA, which decreases from 0.161 (p<0.01) to 0.020 (p<0.01). In the dynamic panel model, the impact of urbanization on economic growth is weakened relative to the static panel model. For the LGDP model, the coefficient of Investn-1 is 0.054 (p<0.01), while the coefficient of Invest is 0.024 (p<0.01). In the GDP dynamic panel model, the coefficient of Investn-1 is 0.030 (p<0.01), which is also larger than the coefficient of Invest at 0.018 (p<0.01). The coefficient of the investment lag term is larger than the coefficient of current investment, indicating that there is a lagged effect of Chinese investment on economic growth in Africa. This suggests that the dynamic effect of Chinese investment is significant, with long-term returns being higher than short-term ones.

4.5.2 The impact of Chinese investment on regional inequality in Africa

The statistical data of GDP per capita and GDP per capita derived from night light data were used in this study for separate modeling, and the results of their β-convergence are shown in Table 7. According to the two models of absolute β-convergence, the coefficients of GDPi-1 are -0.610 (p<0.01) and -0.077 (p<0.01), respectively, supporting the theory of β-convergence. This suggests that regions with lower initial GDP per capita grow faster and tend to catch up with higher-income regions. In the absolute β-convergence model, the coefficients of GDPi-1 are -0.768 (p<0.01) and -0.092 (p<0.01), respectively, with the rate of convergence accelerating when control variables are added. The coefficients of the Invest variable are 0.032 (p<0.01) and 0.002 (p<0.01), respectively, and are significant, demonstrating that Chinese investment promotes economic convergence and reduces economic inequality in Africa. However, the coefficients for UPUA and AFFG show variability between the two models. For UPUA, the coefficients are 1.267 (p<0.01) and -0.021 (p<0.01), and for AFFG, the coefficients are 0.089 (p<0.01) and -0.014 (p<0.01), respectively. These results suggest that, in the GDP model, urbanization and agriculturalization promote economic convergence and reduce inequality in Africa, but in the night light-modified GDP model, they contribute to increased economic inequality. For AFFG, the coefficients are 0.097 (p<0.01) and 0.004 (p<0.05), respectively, indicating that higher foreign trade reduces economic inequality in Africa.
Table 7 β-convergence model
Absolute β Conditional β Absolute β (light) Conditional β (light)
Constant term 4.346*** -1.222 0.960*** 1.225***
(20.61) (-0.33) (6.87) (8.08)
Invest 0.032*** 0.002**
(4.11) (2.08)
GDPi-1 -0.610*** -0.768*** -0.077*** -0.092***
(-20.55) (-25.20) (-6.81) (-7.30)
UPUA 1.267*** -0.021***
(13.08) (-3.17)
AFFG 0.089*** -0.014***
(2.80) (-4.42)
FTD 0.097*** 0.004***
(7.10) (2.63)
R2 0.297 0.504 0.360 0.357
Sample size 960 960 960 960

Note: *** indicates a coefficient is statistically significant (p<0.01); ** indicates a coefficient is statistically significant (p<0.05); * indicates a coefficient is statistically significant (p<0.1).

We used the LGDP data and LGDP per capita data to calculate the coefficients of variation for each African country, which were modeled using a panel model. The results are shown in Table 8. For the GDP data, only the AFFG coefficient is significantly positive, with a coefficient of 0.272 (p<0.01), indicating that agriculturalization exacerbates inequality within African countries. In the GDP per capita model, only the Invest coefficient is significantly negative, with a coefficient of -0.011 (p<0.01), suggesting that Chinese investment reduces internal economic inequality on a per capita basis.
Table 8 CV and inequality model
CVgdp CVgdp_per_capita Inequality CVgdp CVgdp_per_capita Inequality
Constant term 8.159*** 28.51*** 0.690*** AFFG 0.272*** 0.017 0.010***
(16.55) (264.71) (38.80) (4.18) (1.20) (4.12)
Invest 0.011 -0.011*** -0.002*** FTD 0.018 -0.002 -0.003***
(0.81) (-3.71) (-3.43) (0.63) (-0.24) (-2.73)
UPUA -0.049 -0.028 -0.006 R2 0.025 0.021 0.041
(-0.37) (-0.97) (-1.28) Sample size 960 960 960

Note: *** indicates a coefficient is statistically significant (p<0.01); ** indicates a coefficient is statistically significant (p<0.05); * indicates a coefficient is statistically significant (p<0.1).

The results of the final inequality model are also presented in Table 8. The coefficient of Invest is significantly negative, with a coefficient of -0.002 (p<0.01), again indicating that Chinese investment significantly reduces intra-African inequality. The coefficient of AFFG is 0.010 (p<0.01) and significantly positive, indicating that agriculturalization exacerbates intra-African inequality. Additionally, the coefficient of FTD is -0.003 (p<0.01) and significantly negative, suggesting that foreign trade also helps reduce inequality within African countries.
Combining the results of the CV model and the results of the inequality model, we can conclude that (1) Chinese investment reduces economic inequality within African countries, (2) Agriculturalization has increased economic inequality within African countries, and (3) Foreign trade likewise reduces economic inequality within Africa.

5 Discussion and conclusion

China, as the world’s largest developing country, has consistently adhered to the principle of equality and mutual benefit in its investment and cooperation with Africa, striving to achieve a win-win situation characterized by shared benefits. While some studies have highlighted the positive effects of China’s investment on African economies, it has also faced controversy, particularly due to negative portrayals in the media. In this study, we utilized multi-source data and integrated spatial analysis with econometric models to investigate the impact of Chinese investment on economic development in Africa from a new perspective.
Through multi-scale spatial analysis and quantitative methods, we find a strong correlation between China’s investment and economic development, with this correlation diminishing as the distance increases. At different scales, the spatial relationship between the African economy and Chinese investment becomes more stochastic. Additionally, the distribution of spatial patterns across scales is strikingly similar, with regions of higher investment density generally exhibiting better economic development. This paper explores the spatial correlation between Chinese investment and economic growth in Africa, highlighting regions where growth is closely linked to Chinese investment—an aspect that has been largely overlooked in previous studies.
Using the DID model and panel data model, this study examines the impact of Chinese investment policy and Chinese investment stock on the African economy. The results show that both Chinese investment policy and investment stock significantly promote economic growth in Africa. These findings align with existing literature (Donou-Adonsou and Lim, 2018; Abekah-Koomson and Eugene Chinweokwu, 2020; Sylvaire et al., 2022).Furthermore, this study finds that the long-term effects of Chinese investment are greater than the short-term effects. This study is distinguished by its use of multi-source data with a broader time horizon and the application of both static and dynamic panel models. These methodologies provide a more accurate representation of the effects of Chinese investment on economic growth and allow for a deeper understanding of its sustained and dynamic impacts. Additionally, this paper examines the effects of Chinese investment policies, such as the Belt and Road Initiative, offering new perspectives on the positive impacts of Chinese investment on Africa’s growth (Wu and Chen, 2021; Cheng and Taggart, 2023; Meng et al., 2023).
Moreover, this study addresses the impact of Chinese investment on inequality in Africa, finding that Chinese investment contributes to reducing inequality—both by narrowing disparities between African countries and alleviating inequalities within individual countries. This aspect, which has not been adequately explored in previous studies, fills a significant gap in the literature (Obobisa et al., 2021; Ofori et al., 2023). In addition to investment, the study considers contextual factors such as urbanization, agriculturalization, and foreign trade. By incorporating these factors as control variables, the study offers a more nuanced analysis of the relationships between Chinese investment, economic growth, and inequality in Africa. The findings highlight the crucial role of a well-structured industrial framework and foreign trade in Africa’s economic development and in reducing inequality—an impact that should not be overlooked.
The main findings of this study carry both theoretical and practical implications. First, this research expands the application of economic growth theory in the context of international investment. By providing empirical evidence on how Chinese investment promotes economic growth in Africa, it underscores the positive role of capital accumulation in driving economic growth and complements traditional economic growth theories. This study enriches the discussion on the short-term and long-term impacts of foreign direct investment (FDI) on economic growth.
Second, this study deepens our understanding of spatial econometrics theory. At the continental scale, our findings demonstrate that Chinese investment contributes significantly to economic growth and reduces inequality in Africa. The effect of FDI on economic inequality may vary across countries and spatial scales. Therefore, when analyzing the impact of FDI on regional inequality, it is crucial to consider spatial spillover effects and long-term dynamics.
Additionally, this study provides valuable insights for shaping cooperation and investment policies among developing countries. By empirically assessing the impact of Chinese investment on Africa’s economic growth, the research affirms the role of South-South Cooperation in promoting economic growth and reducing regional inequality. These findings offer crucial references for policymakers in designing investment strategies that foster sustainable development.
In conclusion, this study has examined the impact of China’s investment on African economies, considering both economic growth and regional inequality. By analyzing the effects at various scales and exploring spatial patterns through spatial analysis, we find that Chinese investment has significantly contributed to economic development and reduced inequality in Africa. These results support China’s principle of “mutual benefit and win-win”, emphasizing the positive role of Chinese investment in Africa’s economic growth.
[1]
Abekah-Koomson I, Eugene Chinweokwu N, 2020. China-Africa investments and economic growth in Africa. In: Edomah N ed.. Regional Development in Africa. IntechOpen.

[2]
African Union Commission, OECD, 2018. Africa’s Development Dynamics 2018: Growth, Jobs and Inequalities. Addis Ababa and Paris/AUC: OECD Publishing.

[3]
Aghion P, 1992. A model of growth through creative destruction. Econometrica, 60(2): 323-351.

[4]
Agosin M R, Machado R, 2005. Foreign investment in developing countries: Does it crowd in domestic investment? Oxford Development Studies, 33(2): 149-162.

[5]
Anselin L, Syabri I, Smirnov O, 2002. Visualizing multivariate spatial correlation with dynamically linked windows. Regional Economics Applications Laboratory Discussion Paper, 02-T-8: 1-21.

[6]
Asongu S A, Odhiambo N. M, 2020. Foreign direct investment, information technology and economic growth dynamics in Sub-Saharan Africa. Telecommunications Policy, 44(1): 101838.

[7]
Bengoa M, Sanchez-Robles B, 2003. Foreign direct investment, economic freedom and growth: New evidence from Latin America. European Journal of Political Economy, 19(3): 529-545.

[8]
Borensztein E, Gregorio J D, Lee J-W, 1998. How does foreign direct investment affect economic growth? Journal of International Economics, 45(1): 115-135

[9]
Bunte J B, Desai H, Gbala et al., 2018. Natural resource sector FDI, government policy, and economic growth: Quasi-experimental evidence from Liberia. World Development, 107: 151-162.

[10]
Chen X, Nordhaus W D, 2011. Using luminosity data as a proxy for economic statistics. Proceedings of the National Academy of Sciences of the United States of America, 108(21): 8589-8594.

[11]
Chenery H B, 1967. Foreign assistance and economic development. In: Adler J H eds.. Capital Movements and Economic Development. London: Palgrave Macmillan, 268-292.

[12]
Cheng H, Taggart J, 2023 Banking on Beijing: The aims and impacts of China’s overseas. Economic Geography, 99(1): 111-113.

[13]
Cooper R, 2019. The development impact of Chinese development investments in Africa. K4D Emerging Issues Report. Brighton, UK: Institute of Development Studies.

[14]
Cui X, 2022. Chinese outward direct investment in Africa: From the perspective of geopolitics and cross-cultural leadership. International Journal of Economics, Business and Management Research, 6(5): 236-246.

[15]
Donou-Adonsou F, Lim S, 2018. On the importance of Chinese investment in Africa. Review of Development Finance, 8(1): 63-73.

[16]
Duffy-Deno K T, Eberts R W, 1991. Public infrastructure and regional economic development: A simultaneous equations approach. Journal of Urban Economics, 30(3): 329-343.

[17]
Duggan N, 2023. The agency problem in readings of Sino-African relations. African Affairs, 12(448): 461-475.

[18]
Fleisher B, Li H, Zhao M Q, 2010. Human capital, economic growth, and regional inequality in China. Journal of Development Economics, 92(2): 215-231.

[19]
Guerrero V M, Mendoza J A, 2019. On measuring economic growth from outer space: A single country approach. Empirical Economics, 57(3): 971-990.

[20]
Gyimah-Brempong K, 2002. Corruption, economic growth, and income inequality in Africa. Economics of Governance, 3(3): 183-209.

[21]
Hansen H, Rand J, 2006. On the causal links between FDI and growth in developing countries. The World Economy, 29(1): 21-41.

[22]
Henderson J V, Storeygard A, Weil D N, 2012. Measuring economic growth from outer space. The American Economic Review, 102(2): 994-1028.

[23]
Hu D, You K, Esiyok B, 2021. Foreign direct investment among developing markets and its technological impact on host: Evidence from spatial analysis of Chinese investment in Africa. Technological Forecasting and Social Change, 166: 120593.

[24]
Huang L, Han Y, Wang J et al., 2016. China’s economic development illuminates the construction of the “Belt and Road”: An empirical analysis based on nighttime lighting brightness data. Economist, 9: 96-104. (in Chinese)

[25]
Jean N, Burke M, Xie M et al., 2016. Combining satellite imagery and machine learning to predict poverty. Science, 353(6301): 790-794.

[26]
Jerven M, 2010. African growth recurring: An economic history perspective on african growth episodes, 1690-2010. Economic History of Developing Regions, 25(2): 127-154.

[27]
Jiang X, Chen Y, Wang L, 2018. Can China’s agricultural FDI in developing countries achieve a win-win goal? Enlightenment from the literature. Sustainability, 11(1): 41.

[28]
Kaulihowa T, Adjasi C, 2018. FDI and income inequality in Africa. Oxford Development Studies, 46(2): 250-265.

[29]
Kobylinski K, 2012. Chinese Investment in Africa: Checking the Facts and Figures. Association for International Affairs Briefing Paper, 7/ 2012: 1-9.

[30]
Krugman P, 1991. Increasing returns and economic geography. Journal of Political Economy, 99(3): 483-499.

[31]
Kummu M, Kosonen M, Sayyar S M, 2025. Downscaled gridded global dataset for gross domestic product (GDP) per capita PPP over 1990-2022. Scientific Data, 12: 178.

[32]
Li A, 2006. China-African relations in the discourse on China’s rise. World Economics and Politics, (11): 7-14, 4. (in Chinese)

[33]
Liu X, Zou H, 2008. The impact of greenfield FDI and mergers and acquisitions on innovation in Chinese high-tech industries. Journal of World Business, 43(3): 352-364.

[34]
Lucas R E, 1988. On the mechanics of economic development. Journal of Monetary Economics, 22(1): 3-42.

[35]
Mehic E, Silajdzic S, Babic-Hodovic V, 2013. The impact of FDI on economic growth: Some evidence from Southeast Europe. Emerging Markets Finance and Trade, 49(Suppl.1): 5-20.

[36]
Meng G, Wang R, Wang S, 2023. A review of China’s overseas economic and trade cooperation zones along the Belt and Road: Progress and prospects. Journal of Geographical Sciences, 33(7): 1505-1526.

[37]
Muekalia D J, 2004. Africa and China’s strategic partnership. African Security Review, 13(1): 5-11.

[38]
Munjal S, Varma S, Bhatnagar A, 2022. A comparative analysis of Indian and Chinese FDI into Africa: The role of governance and alliances. Journal of Business Research, 149: 1018-1033.

[39]
Obobisa E S, Chen H, Ayamba E C et al., 2021. The causal relationship between China-Africa trade, China OFDI, and economic growth of African countries. SAGE Open, 11(4): 215824402110648.

[40]
Odhiambo N M, 2022. Foreign direct investment and economic growth in Kenya: An empirical investigation. International Journal of Public Administration, 45(8): 620-631.

[41]
Ofori I K, Dossou M A M, Asongu S A et al., 2023. Bridging Africa’s income inequality gap: How relevant is China’s outward FDI to Africa? Economic Systems, 47(1): 101055.

[42]
Opoku P, Song H, 2023. Sustainability and affordability of Chinese-funded renewable energy project in sub-Saharan Africa: A hybridized solid oxide fuel cell, temperature sensors, and lithium-based solar system approach. Environmental Science and Pollution Research, 30(33): 80768-80790.

[43]
Park Y J, Tang X, 2021. Chinese FDI and impacts on technology transfer, linkages, and learning in Africa: Evidence from the field. Journal of Chinese Economic and Business Studies, 19(4): 257-268.

[44]
Romer P M, 1990. Endogenous technological change. Journal of Political Economy, 98(8): 32-36.

[45]
Shimeles A, Nabassaga T, 2018. Why is inequality high in Africa? Journal of African Economies, 27(1): 108-126.

[46]
Solow R M, 1956. A contribution to the theory of economic growth. The Quarterly Journal of Economics, 70(1): 65.

[47]
Suyanto, Salim R A, 2010. Sources of productivity gains from FDI in Indonesia: Is it efficiency improvement or technological progress? Productivity gains from FDI in Indonesia. The Developing Economies, 48(4): 450-472.

[48]
Sylvaire Y D D, Qing W H, Ran H C et al., 2022. The impact of China’s foreign direct investment on Africa’s inclusive development. Social Sciences & Humanities Open, 6(1): 100276.

[49]
Udeh E, 2025 The relationship between foreign direct investment and economic growth: A review of the literature (1994-2023). International Journal of Science and Management Studies, 8(1): 57-65.

[50]
Van De Walle N, 2009. The institutional origins of inequality in sub-Saharan Africa. Annual Review of Political Science, 12(1): 307-327.

[51]
Wu W, Yuan L, Wang X et al., 2020. Does FDI drive economic growth? Evidence from city data in China. Emerging Markets Finance and Trade, 56(11): 2594-2607.

[52]
Wu Y, Chen C, 2021. The impact of China’s outward foreign direct investment on trade intensity with Belt and Road countries. Emerging Markets Finance and Trade, 57(6): 1773-1792.

[53]
Zhao S, Qi J, Li D et al., 2024. Land use change and its influencing factors along railways in Africa: A case study of the Ethiopian section of the Addis Ababa-Djibouti Railway. Journal of Geographical Sciences, 34(6): 1128-1156.

[54]
Zhao S, Wang X, Li K et al., 2022. Evolution and influencing factors of the transnational investment network of China-Africa international cooperation parks. Journal of Geographical Sciences, 32(11): 2205-2228.

[55]
Zheng Y, 2015. Poverty reduction effect of Chinese FDI to Africa: A study based on the methodology of dynamic panel data GMM. World Economy Studies, (11): 90-98, 129. (in Chinese)

Outlines

/