Research Articles

Evolution of railway container transport network nodes driven by sea-rail intermodal transportation: A case study of Northeast China

  • WANG Xiuqi , 1, 2 ,
  • KUANG Haibo , 1, 2, * ,
  • YU Fangping 1, 2 ,
  • GAO Guangyue 3, 4
Expand
  • 1. School of Maritime Economics and Management, Dalian Maritime University, Dalian 116026, Liaoning, China
  • 2. Collaborative Innovation Center for Transport Studies, Dalian Maritime University, Dalian 116026, Liaoning, China
  • 3. Institute of Marine Development, Ocean University of China, Qingdao 266100, Shandong, China
  • 4. Management College, Ocean University of China, Qingdao 266100, Shandong, China
* Kuang Haibo (1965-), Professor, specialized in multimodal transport, supply chain management. E-mail:

Wang Xiuqi (1996-), PhD Candidate, specialized in transport geography. E-mail:

Received date: 2024-04-05

  Accepted date: 2025-01-16

  Online published: 2025-08-28

Supported by

National Natural Science Foundation of China(72174035)

The National Key Research and Development Project(2023YFB4302200)

111 Project of China(B20082)

The Talent Planning in Dalian(2022RG05)

Abstract

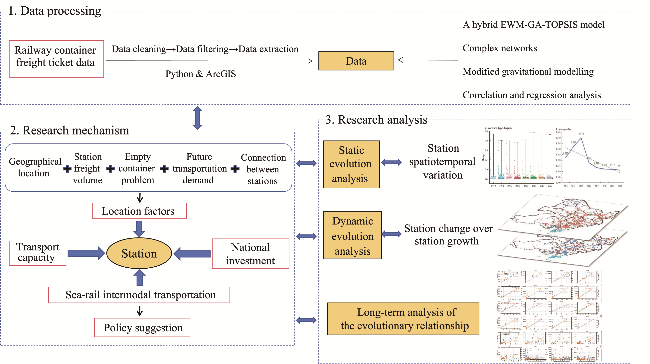
The evolution mechanism of railway transportation network nodes driven by sea-rail intermodal transport (SRIT), a globally prevalent logistics method, has not been thoroughly investigated. From the perspective of SRIT, this study constructed a framework for understanding the evolution of railway container transport network nodes using Northeast China from 2013 to 2020 as a case study. It leverages proprietary data from 95306 Railway Freight E-commerce Platform. By employing the hybrid EWM-GA-TOPSIS model, complex network analysis, modified gravity model, and correlation and regression analyses, this study delves into the spatiotemporal patterns and dynamic transformations of railway container freight stations (RCFS). Finally, the long-term relationship between the RCFS and SRIT is explored. The results indicate that the spatial and temporal analysis of the RCFS in Northeast China from 2013 to 2020 revealed a clear polarisation trend, with the top-ranked stations mainly concentrated near ports and important transportation hubs. Additionally, the RCFS exhibited an expansionary trend; however, its development was uneven, and there was a significant increase in the number of new stations compared to abandoned stations, indicating an overall positive growth tendency. Moreover, the intensity of the SRIT at the RCFS in Northeast China notably increased. A significant positive linear relationship exists between SRIT and the freight capacity of all stations. A relatively pronounced correlation was observed for high-intensity stations, whereas a relatively weak correlation was observed for low-intensity stations. This study not only provides an effective framework for future research on RCFS within the context of SRIT but also serves as a scientific reference for promoting the implementation of the national strategy for multimodal transportation.

Cite this article

WANG Xiuqi , KUANG Haibo , YU Fangping , GAO Guangyue . Evolution of railway container transport network nodes driven by sea-rail intermodal transportation: A case study of Northeast China[J]. Journal of Geographical Sciences, 2025 , 35(6) : 1233 -1262 . DOI: 10.1007/s11442-025-2365-9

1 Introduction

Sea-rail intermodal transport (SRIT) has emerged as a popular form of transportation in the global logistics industry because of its advanced technology, high efficiency, energy conservation, and environmental friendliness (Fan et al., 2010). Since 1980, when the United Nations introduced the United Nations Convention on International Multi-modal Transport of Goods 1980 (United Nations, 1980), major global economies and nations have begun implementing laws and regulations, such as the European Union (EU), which introduced the Combined Transport Directive in 1992 (European Communities, 1992), and the EU’s Marco Polo Program in 2003 (European Communities, 2003). These initiatives effectively contributed to an annual reduction of 5 million tons of CO2 emissions, alleviated congestion issues both within and outside ports, and resulted in cost savings of €2.1 billion in 2011 alone (European Commission, 2018). Currently, sea-rail intermodal container transportation (SRICT) provides a solid foundation for the establishment of a global logistics network (Vis and de Koster, 2003; Gharehgozli et al., 2016) and has also become a mainstream transportation mode in economies and countries such as the EU and the United States (US). The EU has outlined a plan in its White Paper to shift 30% of road transport to alternative modes by 2030 and over 50% by 2050 (European Commission, 2011; European Court of Auditors, 2016). On the west coast of the US, the Los Angeles - Long Beach Twin Ports in California achieved a SRICT share of 49.5% through the introduction of containers (Peng et al., 2019). Although China entered this field later, it is actively promoting the development of SRIT with explicit measures outlined in policy documents such as the Outline for Building a Strong Transportation Country. The significant incremental growth observed indicates a robust developmental trend (Liu et al., 2024).
The increasing development of SRIT, while bringing numerous advantages, has also posed a series of challenges to railway cargo transportation, such as tight and uneven cargo capacity (Reis and Almeida, 2019), empty container repositioning (Choong et al., 2002), and other issues. Additionally, some railway lines, constrained by limited transport capacity and poor planning, both hinder the overall efficiency improvement of the railway and directly impede the further development of SRIT. In this context, railways, as crucial components of the SRIT, directly influence the comprehensive effectiveness of the combined transportation system through their transport capacity and station layouts. Therefore, further optimising the railway transport network and node layout, considering the characteristics of SRIT, will be the key to promoting the healthy development of this mode of transportation in the future. Achieving this goal necessitates beginning with the actual cargo situation of railways, gaining a deep understanding of the logic and patterns of railway transportation and its evolution, and reasonably adjusting and planning railway resources based on the actual demands and potential capabilities of the railway transport network. Following these steps will ensure optimal resource allocation and ensure that all measures are both practical and synergistically efficient, thereby driving SRIT to a higher level of development.
In light of this, this study focuses on the northeastern region of China and employs a hybrid EWM-GA-TOPSIS model, complex network analysis, a modified gravity model, and correlation and regression analyses to evaluate the evolutionary patterns and developmental trends of railway container freight stations (RCFS) driven by SRIT from 2013 to 2020. The objectives of this study were: (1) to establish a comprehensive research framework for examining the evolution driven by SRIT, (2) to analyse the static and dynamic evolutionary characteristics of these stations, and (3) to uncover the long-term intrinsic relationships between stations and SRIT, thereby elucidating the underlying mechanisms that drive the development of the RCFS. The findings of this study are intended to provide a scientific and rigorous reference for the future implementation of national strategies aimed at promoting intermodal transport, facilitating the construction of an efficient integrated transport system, and contributing to a nation’s economic prosperity, regional coordination, and ecological sustainability.
The remainder of this paper is organised as follows. Section 2 reviews the relevant research on SRIT and railway freight. Section 3 presents a general evaluation framework for the evolution mechanism and research methods. Section 4 analyses the results. Finally, Section 5 presents the conclusions and discusses the study findings and implications.

2 Literature review

SRIT has garnered significant attention, prompting a plethora of studies in this field. Castillo et al. (2013) extensively investigated the implications of port-rail connectivity on hinterland transportation within Spain’s multimodal transport system. Berli et al. (2018) developed models for maritime and land transport networks using a geoinformatics approach and thoroughly examined the inherent challenges faced by multimodal transport systems. Oliviero and Pietro (2020) analysed the evolution of multimodal transport in Italy, revealing the interplay between ports and railways. Lourencetti (2022) explored the intersection between ports and railway infrastructures from a sustainable development perspective. Collectively, these studies have consistently emphasised the crucial role of ports as key nodes in SRIT. To enhance the operational efficiency of SRIT, scholars have predominantly concentrated on ports as pivotal hub nodes, proposing various strategies and methodologies to improve their effectiveness. These include advancements in loading, unloading, and transshipment technologies (Luo et al., 2018), as well as the optimisation of port transport organisations and processes (Guo et al., 2011). Such initiatives are intended to harness the central role of ports in the SRIT system. While the majority of these studies have revealed the role and status of ports in SRIT from the port’s perspective, the railway, as another key link in the intermodal system, still has a unique operational logic and potential optimisation space that remains to be further explored.
Therefore, this study draws on existing mature research findings in the railway sector to enrich and enhance SRIT research. Existing literature on the evolutionary characteristics of railways primarily focuses on three key components: network structure (Shaw et al., 2014; Zheng et al., 2022), tracks (Zhai et al., 2019; Wang et al., 2020), and nodes (Meng et al., 2022; Wang et al., 2022). Researchers studied the evolution of railway systems from different perspectives. Cao et al. (2003) comparatively analysed the evolution of highway and railway network structures in Dongguan City, Guangdong Province, in 1980, 1990, and 2000 and found that the role of railway transportation was more significant than that of highway transportation. Jin and Dai (2008) conducted an empirical study on changes in container movement across approximately 200 cities from 1991 to 2000, revealing a prevalent trend towards decentralisation. Feng et al.’s (2013) assessment of railway freight data from 1991 to 2009 revealed that the evolution of the railway freight system exhibited a combination of gradual and sudden changes.
Additionally, Valerio et al. (2016) used fractal dimension, entropy, and state space portraits to analyse the evolution of the Portuguese railway system over time, focusing on its different hierarchical structures and territorial distribution characteristics, and the findings correspond to the network’s historical progression. Lestoille et al. (2016) developed a stochastic model that incorporated measurement uncertainty through the analysis of long-term variations in track geometry and their impact on the dynamic response of trains. Xie and Wang (2021) analysed and forecasted the evolution of Africa’s railway network and discussed the spatial differentiation of the future railway construction market from both national and enterprise perspectives. Maskeliunaite (2021) detailed the evolution and history of Lithuanian railway transportation and analysed Lithuania’s future in the context of European railway development. Bai et al. (2023) examined changes in the container transport mode in China’s railway freight market following the 2013 reform. Their findings indicated significant growth in scale, a stable supply and demand relationship, and a shift in transportation focus towards the north. Meanwhile, Yin and Wang (2023) discussed the change rule of network characteristics based on complex network theory and self-organizing map method (SOM) based on China’s railway data in 2008, 2010, 2015 and 2019. Their results showed that, from 2008 to 2019, the characteristic index of the railway network showed an upward trend; additionally, the evolution of the urban node’s change trajectory was closely related to the hierarchical structure of the urban system.
Considering that railway freight network nodes serve as crucial elements within a railway freight system, their accurate layout and efficient management are of paramount importance for the efficient and safe operation of railway freight. Extensive studies have been conducted on this topic. Cacchiani et al. (2016) employed an Integer Linear Programming (ILP) model in conjunction with an iterative heuristic algorithm, using railway stations as nodes. They considered potentially conflicting ideal timetables proposed by multiple train operators along with track operational constraints to evaluate the capacity saturation of railway nodes. Li et al. (2018a) assessed the significance of grain distribution nodes in railway, road, and water transport networks using complex network theory with the enhanced entropy-weighted TOPSIS approach. Wang et al. (2018) employed a cost-distance analysis and revealed that Manzhouli provides the most cost-effective route to Moscow from 314 Chinese cities in high- and medium-cost scenarios, whereas Erenhot is the optimal choice in a low-cost scenario. Zhao et al. (2018) utilised complex network theory and the TOPSIS model to assess the importance of 27 cities in China within the transportation network, aiming to address the issues of low cargo load factors and profitability in China’s railway transportation. Zhang et al. (2020) employed network analysis to evaluate the structure of China’s multilayer railway network and found that the node degree followed a shifted power-law distribution.
Furthermore, the network exhibits a pronounced community structure and heterogeneous interlayer connections, with high-degree nodes playing a crucial role. Sun et al. (2020) ranked China’s railway transportation cities using TOPSIS based on the criteria of location, infrastructure, industry, city positioning, and competitiveness and identified the final distribution hubs. Kim and Shin (2021) considered both local performance and network vulnerability in their evaluation of the local and overall network performances of Korean railway stations in sustainable logistics management. They proposed a sustainability planning proposal for the railway station network. Wei and Lee (2021) evaluated and ranked the logistics capacities of inland ports using an improved entropy weight TOPSIS method. Zhang et al. (2021) presented a hybrid multi-criteria decision-making (MCDM) model based on the grey relational analysis (GRA) method to evaluate the optimal location of China’s international container intermodal transportation hubs. Cao et al. (2022) employed the entropy weight TOPSIS method to evaluate the development decision-making of railway stations from both the horizontal and vertical dimensions, considering various comprehensive potential factors such as natural potential, mining heritage potential, social potential, transportation potential, and tourism potential. Feng et al. (2022) created a transportation network for the China-Europe freight train system and evaluated the importance of multi-layer network nodes using complex centrality indicators, an improved TOPSIS method, and GRA. Zhou et al. (2022) used an enhanced k-shell decomposition approach to assess the significance of nodes for global networks, railway hubs, and stations.
From the current study, several observations can be found:
(a) In the SRIT research, most studies have focused on port-related issues, aiming to address congestion and transportation challenges within ports or at the interfaces between ports and railways. However, limited attention has been devoted to exploring railway transportation challenges from the perspective of the overall network structure of SRIT. Given the profound impact of the SRIT implementation on the regional railway transportation system, it is imperative to comprehensively consider the unique characteristics of this mode of transportation and seamlessly integrate them into railway transportation networks. This step is crucial for ensuring the feasibility of future planning and optimisation strategies for both the network and its critical nodes.
(b) Regarding research data, the analysis of railway transportation data predominantly relies on traditional statistical figures, with an emphasis on analysing the evolution of the railway transportation system from a macro perspective. However, within the transportation network of SRIT, relying solely on macro-level data analysis is no longer sufficient to delve deeply into the operational mechanisms of railway transportation.
(c) In the time-series aspect of research, existing studies often emphasise the static comparative analysis of specific years, identifying differences by directly examining numerical values or distributions for one or more years. Nevertheless, the development of railway nodes represents a continuous and dynamic process encompassing temporal changes, such as the addition or abandonment of stations, along with positive or negative growth rates.
(d) In terms of research methodology, in addition to complex network theory, multi-criteria analysis (MCA) is frequently used. The traditional MCA framework has been researched by determining the evaluation criteria (Santos et al., 2017; Labella et al., 2018), often utilising methods such as the analytic hierarchy process (AHP) (Aoun et al., 2021), TOPSIS (Watróbski et al., 2017), DEA (Vukic et al., 2020), and fuzzy numbers (Shafiee et al., 2022). The main issue in MCA is deciding how to implement a standard weighting technique for measuring the weights of large datasets.
Compared with other studies, this paper contributes in the following ways:
(a) This study established a general research framework for exploring the evolution of railway container transportation network nodes driven by SRIT, with Northeast China serving as a case study.
(b) The study utilised a proprietary dataset comprising 1.25 million railway container freight ticket data, surpassing the inherent constraints of traditional macro-level evaluation frameworks and enabling an insightful analysis of the evolution of the RCFS from a micro perspective. The dataset is not only extensive in volume but also highly detailed, allowing us to monitor the daily inbound and outbound movements of freight vehicles at each station. This level of detail significantly reduces biases in evaluating the actual transport capacity of freight stations, which can arise owing to the presence of empty container movements, thus providing a more accurate portrayal of the real transport situation at the RCFS.
(c) For this research, we employed both static and dynamic comparative analyses, with particular emphasis on examining the magnitude and directional trends in the development of various RCFS over the study period. The objective was to uncover the underlying patterns driving the evolution of the RCFS under the influence of SRIT.
(d) Finally, a novel MCA technique was developed to better accommodate large-scale data and evaluate the evolutionary mechanisms of the RCFS.
In summary, real big data freight waybills were utilised to mine freight data from the RCFS. Simultaneously, indicators that are more closely related to the SRIT were employed, enabling a comprehensive evaluation of the actual situation of RCFS and providing valuable guidance for their future development.

3 Materials and methods

3.1 General evolutionary mechanism framework

3.1.1 Theoretical framework

Based on the SRIT perspective, this study constructed an analytical framework for RCFS that encompasses four key aspects: location factors, transport capacity, national investment, and SRIT intensity (Figure 1). By quantifying the spatiotemporal evolution characteristics of these stations in both static and dynamic dimensions, we further explored the long-term relationship between the operational status of the RCFS and SRIT intensity.
Figure 1 General evolutionary mechanism framework
The location selection of the RCFS reflects the influence of the geographical position on the strategic positioning of the railway nodes. Hub nodes are typically situated in areas with convenient transportation and robust economic development, enabling them to better serve the surrounding industries and meet market demands. Stations located close to ports, industrial parks, or large logistics centres often benefit from easier access to transportation networks; in turn, such access attracts more freight cargo sources and transport opportunities, thereby facilitating their rapid development. However, as regional economic structures evolve and the transportation network undergoes optimisation and expansion, the locational advantages of these stations also shift. Factors such as the establishment or abandonment of stations and the extension of railway lines can alter existing networks to adapt to new developments.
Transport capacity is the core driving force behind the evolution of RCFS. A high transport capacity not only reflects a station’s ability to attract and handle cargo but also directly embodies its coordination efficiency with other transportation nodes. Increases in freight volume and shipment frequency can enhance a station’s position within the logistics network, strengthening its role in concentrating and distributing cargo flow. Conversely, an insufficient transport capacity may lead to cargo congestion and reduced efficiency, subsequently impacting the long-term development and functional positioning of the station.
The level of national investment is a pivotal indicator for assessing the future transport capacity of RCFS. Greater national investment often signifies a higher station grade equipped with more advanced facilities and more efficient operational processes. Such stations can handle larger volumes of freight, meet higher market demands, and consequently attract more cargo flow resources. In turn, connectivity and strategic importance are enhanced within the overall transportation network.
The strength of the SRIT directly reflects the synergy and potential between a given station and port. When a station is closely connected to a port, it signifies that the station has significant potential for SRIT development. The connectin not only promotes the rapid and efficient integration of SRIT but also ensures the continuity and fluidity of the logistics chain through direct container transfers. More importantly, this attracts a greater influx of logistics businesses, driving the expansion of the station’s operational scale and enhancing its competitive market position. Consequently, the station plays a pivotal role in the railway container freight network, promoting a comprehensive upgrade from functional orientation to service capability.
This research primarily aims to explore the evolution mechanism of stations driven by SRIT. Considering this crucial factor, this study integrates the analysis of a dynamic station into the context of station development. Furthermore, the long-term relationship between RCFS and SRIT is examined, providing valuable insights and a theoretical foundation for future station layouts and planning.

3.1.2 Selecting indicators

Location factors. In a railway network, stations are nodes that link multiple lines, and their placement is directly related to the ease and efficiency of railway transport. In network analysis, complexity network centrality measures, such as node degree centrality, betweenness centrality, proximity centrality, and eigenvector centrality, are often used to describe the importance of nodes in a network (Shen et al., 2023). Therefore, this study also utilises complex network centrality indices to measure the position of the RCFS within the network. However, the network constructed in this study uses real freight stations as nodes, resulting in a more refined granularity compared with previous studies.
Transportation capability. Sholars (Jin et al., 2008) have often relied on freight volume as the primary indication to evaluate transportation capacity owing to data gathering constraints. However, the issue of empty containers is a common challenge in the SRIT process, which means that freight volume alone can only reflect the transport capacity of a railway freight station rather than accurately representing its transport efficiency. To address this issue, we cleaned, filtered, extracted, and quantified the original data to obtain the sending and receiving frequencies of goods trains at various stations, including empty-container transport. This approach enables us to accurately reflect the true cargo situation of a station and innovatively incorporate this new metric into the analytical framework of this study.
National investment. In this study, the railway station grade was selected as a key indicator of performance. The grades were meticulously evaluated and classified by the China National Railway Group Corporation (CNRG), considering multiple factors such as passenger volume, freight volume, technical operation volume, equipment and facilities, staffing levels, and service quality. This classification reflects the level of the nation’s investment and emphasis on station resources while indirectly indicating the strategic position of the station within the railway network and its potential for future development.
SRIT intensity. In this study, the connection strength between port-adjacent railway nodes and inland nodes was employed as an evaluation indicator. Port-adjacent railway nodes, which serve as crucial linking points between ports and the railway network, can be regarded as extensions of port nodes and incorporated into the calculation of the intermodal transport intensity.
The completed framework is shown in Table 1.
Table 1 Selecting indicators
Indicators Level I Indicators Level II Indicator content
Location factors A Degree
centrality (+)
A1 It reflects the density of node i with its surrounding neighbouring nodes. It is the degree of concentration or centralisation of the entire network, i.e., the breadth of connectivity. The higher the value, the greater the influence of that node in the network
Betweenness centrality (+) A2 It reflects the transit ability of node i in the network; the larger the value, the stronger the ability of the node as a “bridge”.
Proximity
centrality (+)
A3 It reflects the importance and reachability of node i in the network; the larger the value, the higher the importance of the node.
Eigenvector
centrality (+)
A4 Considering a node i, the influence of its neighbouring nodes is added; the larger the value, the more influence the node has in the network.
Transportation capability B Freight
volume (+)
B1 The weight of the goods sent and received at the station is selected as an indicator for evaluating the transportation capability of the node, and the larger the value, the stronger the transportation capability of the node in the network.
Freight
frequency (+)
B2 The frequency of sent and received goods at the station is selected as an indicator for evaluating the transportation capability of the node, and the larger the value, the stronger the node’s transportation capability in the network.
National
investment
C Transportation potential (-) C1 The freight station grade is selected as a representative indicator; the smaller the value, the stronger the transportation potential of the node in the network.
SRIT intensity D Combined
intensity (+)
D1 The average link strength from each station to the port is calculated as an evaluation index, and the larger the value, the greater the role of the node in SRIT.

3.2 Research methods

3.2.1 A hybrid model

In this section, we present the hybrid EWM-GA-TOPSIS model (Figure 2). This model consists of the entropy weight method (EWM), genetic algorithm (GA), and Technique for Order Preference by Similarity to Ideal Solution (TOPSIS). By combining this model with a general framework, the scores for each station can be computed, thereby summarising the general evolution patterns to better fit the problems and data studied. When determining the indicator weights, traditional measurement methods often rely on statistical data; however, the datasets used in this study are extensive, making traditional methods challenging for processing and analysing these extensive datasets; therefore, specialised big data processing technologies and tools are required. Therefore, we used a GA to improve the conventional entropy weight technique. The GA can thoroughly explore the solution space to determine the best answer, thereby overcoming the problem of local optimum solutions encountered by the entropy weight technique in solving the MCA problem. Moreover, it can efficiently address issues regarding the precision and dependability of decision-making in large data processing.
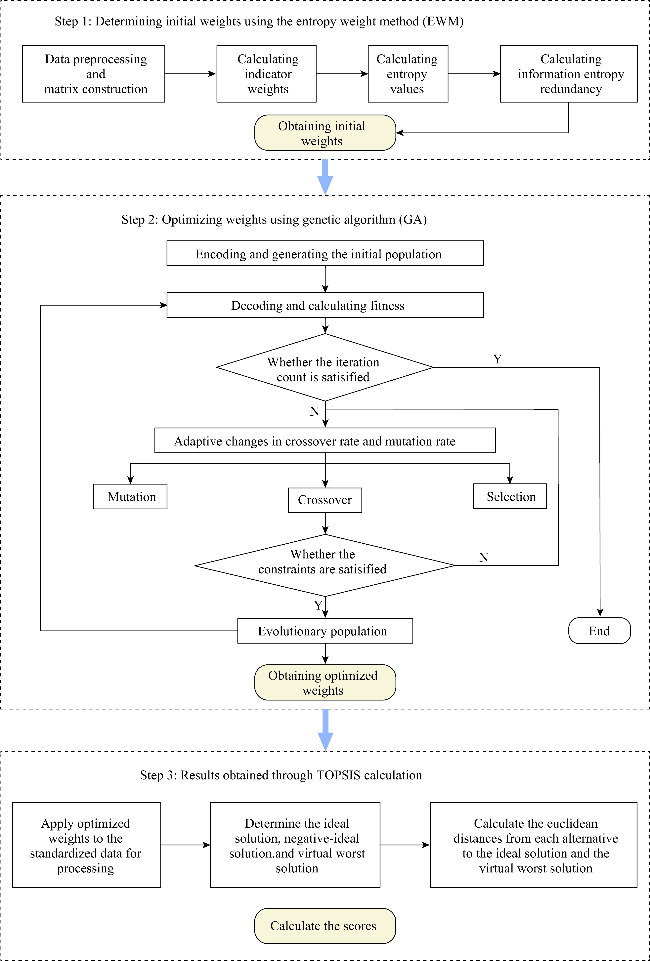
Figure 2 Calculation process of the hybrid entropy weight method, genetic algorithm, and Technique for Order Preference by Similarity to Ideal Solution (EWM-GA-TOPSIS) model
The specific framework steps are outlined below:
First, the EWM was utilised to calculate the initial weights. The EWM primarily utilises the magnitude of the entropy value in information theory to represent the uncertainty of information. It computes the ability of each evaluation attribute to convey decision-making information and determines the relative weights of the attributes (Zhao et al., 2017). These steps are outlined in reference (Chen, 2020). Table 2 presents the results of the study.
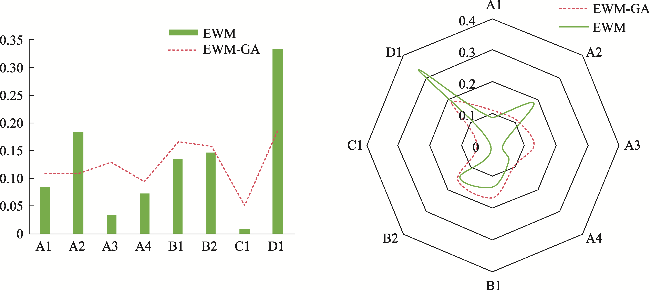
Table 2 Determination of weight scores using the entropy weight method (EWM)
A1 A2 A3 A4 B1 B2 C1 D1
0.085 0.184 0.033 0.072 0.134 0.147 0.008 0.333
Second, a GA was used to optimise the weights. GAs are often employed in optimisation problems (Lu et al., 2023), originating from Holland’s work (1975) and inspired by the process of natural selection, which may assist in finding probable patterns and association laws in data. Currently, a limited number of studies have used GA to improve the weights of the EWM technique. In this study, a GA was used to optimise the weights derived from the entropy weight approach. While GAs possess potent capabilities for exploring solution spaces and can overcome the limitations of traditional methods such as EWM, which are prone to converging to local optima, their inherent randomness and sensitivity to parameter settings do not guarantee the discovery of a global optimal solution in every run. Mutation operations were introduced into the GA framework to enhance the exploration capabilities of the algorithm and avoid local optima. Through the continuous processes of selection, crossover, and mutation, the GA progressively optimises individuals within the population, thereby approximating and ultimately identifying the optimal weight distribution scheme (Table 3).
Table 3 Determination of optimal weight scores based on entropy weight method, and genetic algorithm (EWM-GA)
A1 A2 A3 A4 B1 B2 C1 D1
0.109 0.108 0.129 0.094 0.166 0.157 0.050 0.186
By comparing the two weighting results in Figure 3, it is evident that the weight-ranking trends in the EWM-GA and the EWM are similar, confirming the effectiveness of the EWM-GA optimisation weighting method used in this study. Comparing the weighting factor results presented in Tables 2 and 3, it is evident that there are notable discrepancies in the specific values assigned to the indicator weights. This divergence primarily manifests in the magnitudes of the weights attributed to each indicator. The weights in Table 2 exhibit substantial variations, with a difference of 0.325 between the highest and lowest values.
Figure 3 Comparative weighting analysis
Conversely, the weights in Table 3 demonstrate smaller numerical disparities, indicating a more balanced distribution among indicators. This finding further substantiates that the incorporation of the GA successfully enhances the optimisation accuracy and stability of the weights while preserving the merits of the original EWM. Within the framework of this study, the established indicator system aimed to ensure that the contribution of each indicator in the comprehensive evaluation was relatively balanced. This aim necessitated consideration of the relative importance of different indicators to avoid potential biases, unfairness, and adverse consequences that may arise from assigning excessively large weights to any single indicator. Consequently, for the purposes of this study, the weighting results obtained using the EWM-GA method were deemed more reasonable.
Finally, the TOPSIS method is used to calculate the score based on the worst virtual solutions, which involves integrating the derived weights into the calculation process using the TOPSIS methodology. The traditional Euclidean distance ideal solution employed in the TOPSIS method may result in irrational ordering (Li et al., 2018b), thus necessitating the introduction of the worst virtual solution to enhance the analysis (Xu et al., 2019). Through these steps, the final calculation of the indicators within the overall framework presented in this study is achieved.
To further validate the methodology employed in this study, we conducted a comparative experiment, as illustrated in Figure 4. Given the unique characteristics of RCFS in the northeastern region, where there are significant disparities in cargo-handling capacity, geographical location, and other factors among stations, accurately capturing and highlighting these differences became a pivotal issue for our research. We implemented both the EWM-TOPSIS and EWM-GA-TOPSIS methods and calculated the standard deviation of the results to uncover notable discrepancies in their degree of dispersion. Compared to the conventional EWM-TOPSIS approach, the results obtained using our proposed EWM-GA-TOPSIS method exhibited a higher degree of dispersion, indicating more pronounced differentiation among the outcomes. This finding underscores the efficacy of the GA in optimising the weight allocation process and enhancing subtle distinctions between station evaluations.
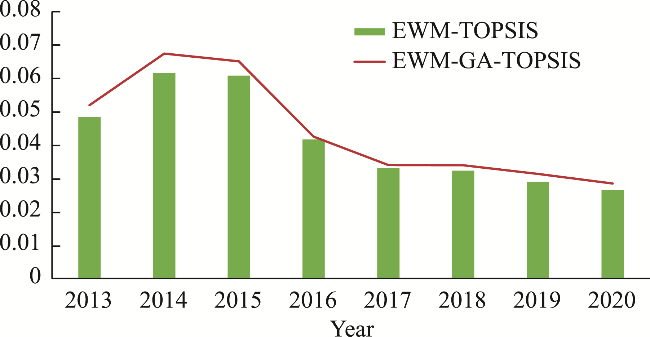
Figure 4 Comparative results of entropy weight method, genetic algorithm, and Technique for Order Preference by Similarity to Ideal Solution (EWM-GA-TOPSIS) and entropy weight method, and Technique for Order Preference by Similarity to Ideal Solution (EWM-TOPSIS)
Incorporating the GA to create the EWM-GA-TOPSIS method allowed us to both refine the weight distribution and amplify the fine variations in the results among the stations. Consequently, when assessing the performance of railway container stations in the Northeast region, our proposed EWM-GA-TOPSIS method demonstrated superior practicality and rationality compared to the traditional EWM-TOPSIS approach. This method provides reliable data support for relevant decision-making processes, making it a valuable tool for evaluating and comparing the performance of such stations.

3.2.2 Complex networks

Complex network theory (Mark et al., 2006) has been widely used in public transportation (Peng et al., 2018). To understand the structural changes in the railway container transport network, this study combines the Space-L method and Python software to calculate each eigenvalue of the network, uses the frequency of freight traffic between stations as the weight, establishes a weighted connection matrix of the links between nodes, depicts and studies the railway container transportation network, and reflects the actual spatial structure of the network.
Notably, when multiple stations existed in a city, they were considered separate and distinct nodes. For example, Jilin city had two stations, Jilinbei and Jilinxi, which were considered as nodes when constructing the transport network, and the Jilinbei and Jilinxi stations were considered as independent nodes added to the network.
The calculation formula is as follows:
(1) Degree centrality:
$D C_{i}=\frac{k_{i}}{N-1}$
(2) Median centrality:
$B C_{i}=\sum_{s \neq i \neq t} \frac{n_{s t}^{i}}{g_{s t}}$
(3) Proximity centrality:
$C C_{i}=\frac{N-1}{\sum_{j=1, j \neq i}^{N} d_{i j}}$
(4) Eigenvector centrality:
$x=c A x$
where ki is the degree of node i, that is, the number of edges connected by node i, N represents the number of nodes in the network. $n_{s t}^{i}$ denotes the number of shortest paths from node s to node t, passing through node i. gst denotes the number of shortest path bars from node s to node t; dij denotes the distance between node i and node j; and c is a constant of proportionality. A denotes the network adjacency matrix.

3.2.3 Modified gravitational modelling

Existing studies frequently employ the gravity model to ascertain the correlations between diverse objects (Zhang et al., 2023). This study utilises the gravity model to examine the association between ports and railways to assess the connectivity of railway stations within the SRIT system. Given the significant geospatial correlation between railways and ports, the distance between nodes is inclined towards the actual geographical distance. Therefore, this study adopts a modified gravitational model to associate the container volume at each node with the actual railway mileage. This approach aims to precisely delineate the SRIT correlation of each railway node by employing the following formula (Eqs. 5 and 6):
$F_{i g t}=K_{i g} \frac{M_{i} M_{g}}{D_{i g}^{\alpha}}$
$F_{i t}=\frac{\sum_{g=1}^{m} F_{i g t}}{m}$
where Fijt denotes the strength of the link from node i to port g in period t; Kig denotes the gravitational coefficient; Mi and Mg denote the sea-rail containerised cargo volume of node i and port g, respectively; Dig denotes the distance between node i and port g; α denotes the distance decay coefficient, which usually takes the value of 2 (Kang et al., 2021); Fit denotes the average link strength from node i to all ports in period t; m denotes the number of all ports.

3.2.4 Correlation and regression analysis

Linear, power-law, and exponential models were used to analyse the response of the SRIT and the evolution of the RCFS over time. The linear model y = a + bx was used to describe the response of variable A to an increase in variable B in a constant proportion. Power law models, y = a + bxc (0 < c < 1) can be used to quantify the dynamics of variable A, which may decrease the rate of response to the progressively increasing variable B over time. Exponential models y = a + becx (c > 0) were used to quantify whether variable A has a gradually increasing rate of response to variable B over time.

3.3 Research area and data

3.3.1 Research area

This study focused on the northeastern region as a case study to assess the development of railway container freight network nodes in the context of SRIT. The railway network in Northeast China is the most densely populated in the country (Li et al., 2021). The northern part connects Russia and Mongolia via land ports, whereas the southeastern part links Japan and South Korea through seaports for transportation (Figure 5). The strategic positioning of transportation hubs in Northeast China affects the effectiveness of SRIT and influences a region’s level of economic integration with the global market. Recognising the significance of railway and sea transport, the northeastern region has proposed the development of the “Northeast China Sea-Land Corridor” to enhance connectivity through SRIT, fostering an open-door approach in the region.
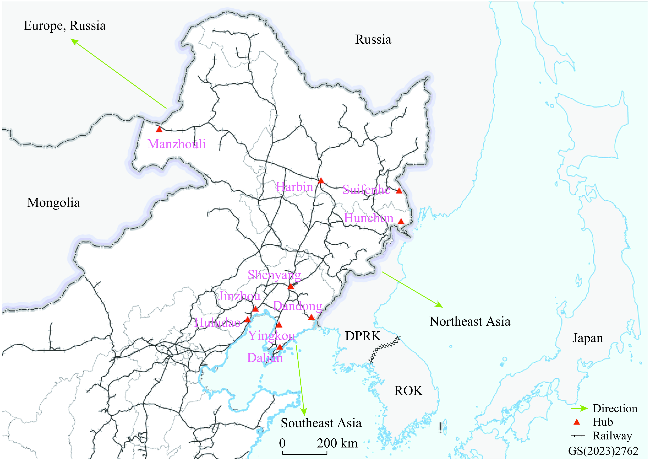
Figure 5 Schematic diagram of sea-rail intermodal transport routes in Northeast China

3.3.2 Research data processing

All data presented in this paper were meticulously gathered through diverse channels following an extensive and prolonged process of collection, processing, and cleaning. Notably, railway container freight data were sourced from the proprietary dataset of the 95306 Railway Freight E-commerce Platform. These data were subjected to rigorous manual sorting and cleaning procedures to ensure accuracy and usability. The dataset comprises 1.25 million pertinent pieces of big data related to railway freight bills and freight trains. The data are highly precise and provide daily flow information for each freight train at every railway station, ensuring the maximum accuracy and authenticity of the railway flow data, including the names of the originating and arriving stations, ticket dates, container types, container quantities, total mileage, total weight, and other relevant fields (Figure 6). In particular, the names of the originating and arriving stations indicate the names of the sending and receiving stations of the train, respectively; the ticket date indicates the scheduled train departure; the container type and quantity indicate the type of packaging or shape of the transportation container and its number; the total mileage indicates the total distance travelled by the train during transportation; and the total weight indicates the total weight of the goods carried by the train.
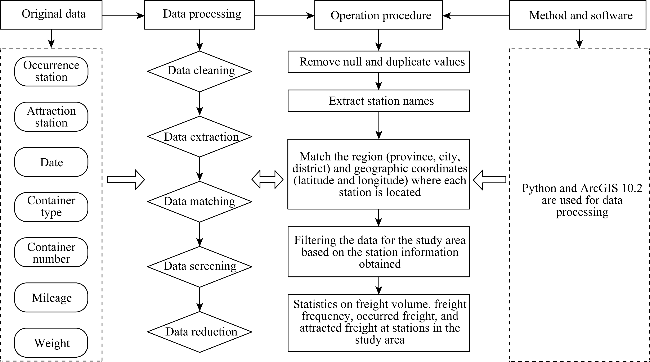
Figure 6 Data pre-processing diagram
The station grades are determined according to the Regulations for the Classification of National Railway Station issued by the Ministry of Railways in 1980. The verification and approval processes are overseen by the China Railway Corporation and its subordinate railway bureaus. Through extensive manual effort and time investment, we conducted multichannel searches and compilations for all the stations within the study area.

4 Results

4.1 Evolution of railway container freight network nodes under sea-rail intermodal transport

4.1.1 Static evolution analysis

The RCFS scores for Northeast China from 2013 to 2020 are shown in Figure 7. The box line diagram (Figure 7a) illustrates that the stations consistently had low scores throughout the study period, with a notable disparity between the highest and lowest values, highlighting a severe polarisation issue. The box’s location and size exhibited an increasing trend, with points widely dispersed between 2013 and 2015. Between 2016 and 2020, the box location steadily decreased, and the points became more clustered. Polarisation has decreased since 2015, leading to a reduction in extreme values. As a result, the interquartile range in the box plot for 2016-2020 was narrower than that of the preceding three years.
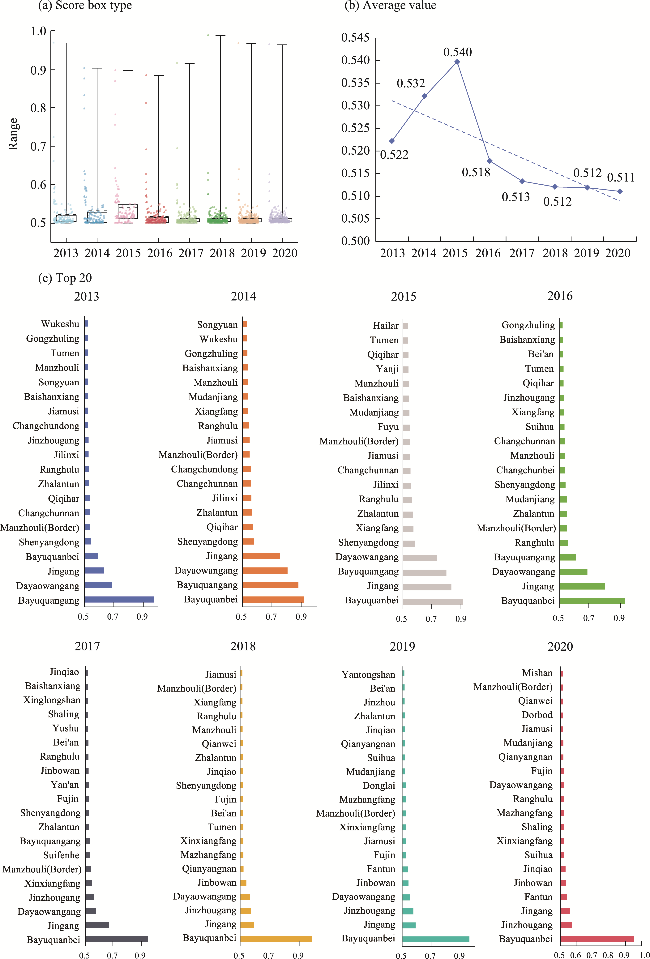
Figure 7 Trends in the scoring of railway container freight stations in Northeast China, 2013-2020
The mean values for the period 2013-2020 exhibit an initial increase, followed by a decrease (Figure 7b), further supporting the existence of polarisation among stations. Compared to Figure 7a, the mean values for each year from 2013 to 2015 fell within the upper quartile of the data, indicating that these values were among the top 25% of the dataset, far exceeding the median. Significant variations in station scores were observed. However, this trend was reversed after 2016, indicating that progress has been made in narrowing the disparities among RCFS in the Northeast region since the implementation of the 13th Five-Year Plan (2016-2020). Although the average value decreased, the difference between the upper and lower quartiles in the box plot remained consistently narrow.
In Figure 7a, a significant disparity can be observed between the top-ranked station and other stations, demonstrating a precipitous lead. To gain a deeper understanding of this phenomenon, we analysed the top 20 stations across various years (Figure 7c). The findings reveal that these highly ranked stations are primarily port-adjacent railway stations and crucial transportation hubs concentrated around ports and along major railway axes. Notably, these stations have established close sea-rail intermodal connections with the ports. It is worth mentioning that the port-adjacent railway stations surrounding the Yingkou Port, as exemplified by Bayuquangang and Bayuquanbei railway stations, have exhibited a precipitous growth trend since 2017.
In contrast, port-adjacent railway stations representing other ports, such as Dalian and Jinzhou ports, showed declining trends during the same period. The policy background that underlies this shift should not be overlooked. During the “Two Sessions” in 2017, the China Merchants Group collaborated with the Liaoning Provincial Government to select port integration as a breakthrough for state-owned enterprise reform. The integration of Liaoning ports commenced in June 2017 and was completed in January 2019, encompassing the ports of Dalian, Yingkou, Panjin, and Suizhong. This strategic adjustment further highlighted Yingkou Port’s status as a domestic trade hub and reinforced its domestic trade advantages.
To delve deeper into the disparities in station scores, we employed the quantile method, categorising them into five groups based on their numerical values. Figure 8 shows a distinct spatial distribution pattern in which the lower-ranked stations are situated close to the higher-ranked stations. From 2013 to 2020, the higher-ranked stations showed a distinct concentration trend, emphasising their exceptional transportation capacity and key position in the SRIT system. Lower-ranked stations first clustered around 2013 and then shifted towards a more scattered distribution resembling that of the top-performing stations. The change in distribution is believed to have been caused by the government’s strategic planning and alteration of the railway station layout.
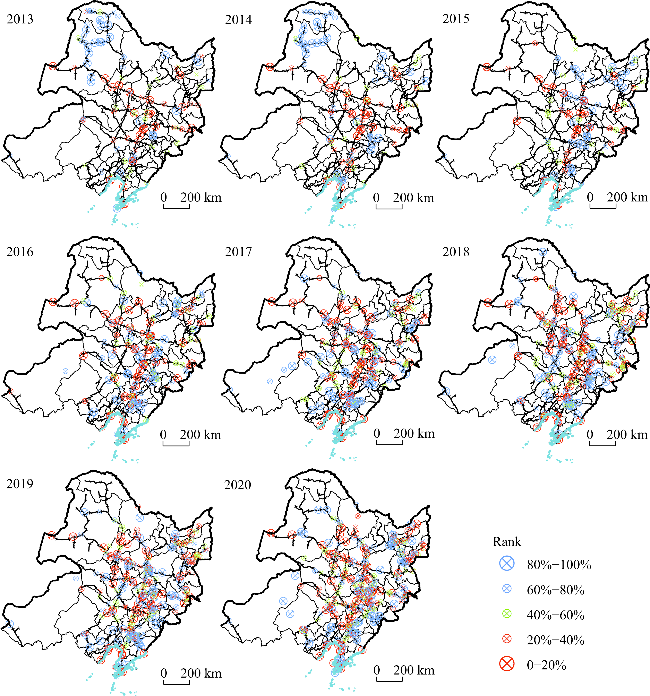
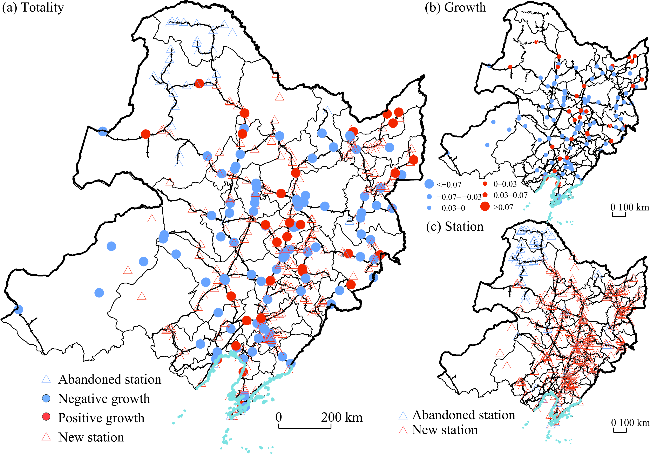
Figure 8 Spatial characteristics of railway container freight station scores in Northeast China, 2013-2020
To improve the efficiency and performance of the SRIT system, low-capacity stations may be eliminated, and new stations may be established near high-capacity stations to redistribute freight transport pressure and enhance overall efficiency. However, there is still an extreme imbalance between the lower-ranked and higher-ranked stations, and an ideal equilibrium has not yet been achieved. The imbalance might be attributed to delays in achieving the desired results from constructing and operating new stations, as well as the inefficient redistribution and utilisation of resources freed up after removing the stations.

4.1.2 Dynamic evolution analysis

Traditional static analysis is limited to presenting the state of a condition at a particular moment, whereas the transportation and growth of stations are constantly evolving owing to various factors. This shift is not a momentary state but a long-term and continuous process. Hence, to comprehensively understand this transformation, it is imperative to monitor both the direction and extent of changes in station scores. This study incorporated a dynamic evolutionary perspective (Figure 9).
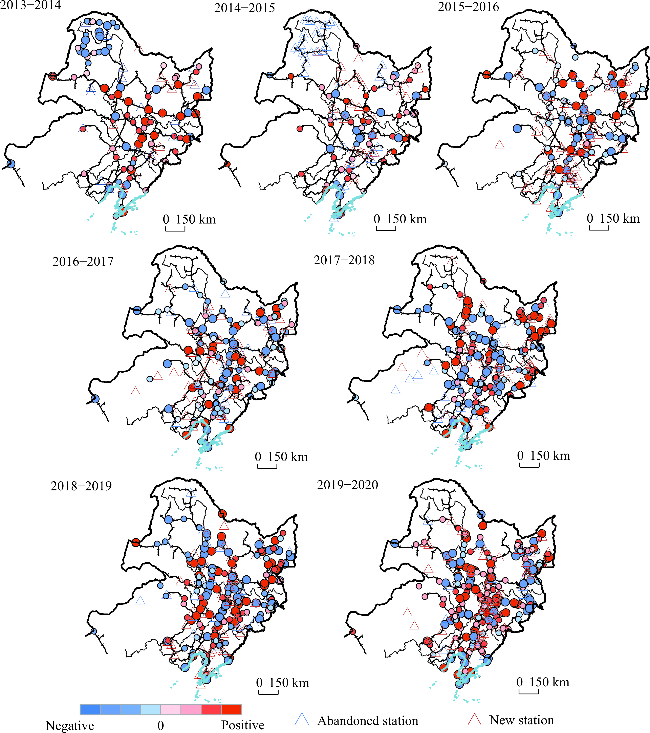
Figure 9 Dynamic evaluation of railway container freight station scores in Northeast China, 2013-2020
The RCFS in Northeast China experienced an intricate evolutionary process from 2013 to 2020. From a planning perspective, the number of new stations exceeded the number of abandoned stations, indicating a positive growth trend in the expansion of the RCFS in Northeast China. This expansion, primarily along branch lines linked to main lines, demonstrated continuous and widespread growth. This expansion indirectly underscores the development potential of the railway container transportation network in the northeastern region.
However, from the perspective of stations consistently operating during the study period, the score changes revealed an imbalance, with 43 stations experiencing negative growth and only 30 stations showing positive growth. The number of stations with negative growth exceeded that of stations with positive growth. This is due to the lack of equivalent improvements in the capacity of certain existing stations throughout the growth of railway transportation systems, which may be influenced by many circumstances. The establishment of new stations can affect freight volumes transported by existing stations. When a new station opens, certain items previously handled by existing stations may be rerouted, resulting in a decrease in the transportation volumes of these stations. Furthermore, existing stations have insufficient facilities to manage the present freight volume, which affects their capabilities. As the economy in the northeastern region expands and the industrial framework develops, changes in market demand may cause certain freight-forwarding stations to lose their primary source of cargo and experience capacity reduction.
To delve deeply into the developmental dynamics and inherent potential of stations—including abandoned, new, and continuously operating stations—this study conducted a comprehensive analysis of changes in RCFS over time (Figure 10). The results indicated that the overall growth trend of the RCFS exhibited significant fluctuations. Regarding stations that have been continuously operating over the years, there has not been a clear difference between the number of stations experiencing negative growth and those experiencing positive growth; instead, they have maintained a state of dynamic equilibrium. The number of new stations consistently exceeds the number of abandoned stations each year, highlighting the robust activity and expansion of railway container transport networks and the substantial potential for station growth.
Figure 10 Dynamic changes of railway container freight stations in Northeast China, 2013-2020
Concurrently, the number of stations operating continuously and stably has increased over time. This increase reflects the progressive refinement and optimisation of the railway container transport network. In addition, it reveals the development prospects and potential of a network and its nodes. Notably, since 2018, most RCFS have exhibited marked positive growth. The emergence of this turning point may be closely linked to favourable shifts in national policy orientation. In 2017, the National Development and Reform Commission of China issued a series of policies, including adjustments to the transportation prices of various freight categories, notably railway containers, to accelerate the development of railway container transportation. The implementation of these policies not only provided robust support for the development of railway freight transportation but also injected impetus into the advancement of railway multimodal transport.

4.2 Interconnection between railways and ports under sea-rail intermodal transport

Based on the above findings, this study visualises the intensity of SRIT (Figure 11) to gain deeper insights into its impact on the railway container transport network, particularly the interaction between the RCFS and ports. The ports investigated included Dalian, Yingkou, Panjin, Jinzhou, and Huludao. The aim was to intuitively and scientifically reveal the intrinsic relationship between the development of RCFS and SRIT and, subsequently, delve into and elucidate the underlying mechanisms and motivations driving the development of RCFS.
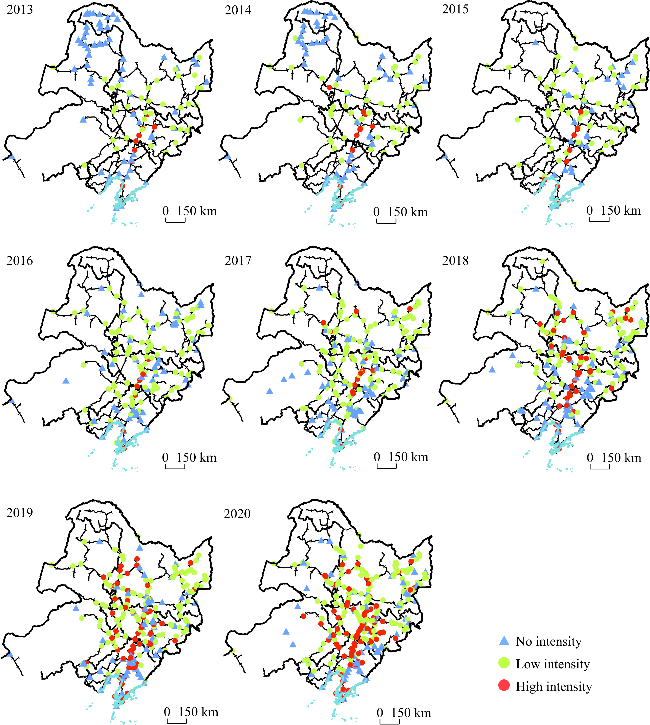
Figure 11 The interaction between railway container freight stations and ports in Northeast China, 2013-2020
From 2013 to 2020, the intermodal intensity of the stations increased significantly, with a gradual increase in the number of stations exhibiting high intensity. An in-depth spatial analysis revealed that the combined intensity of the stations exhibited the distinct characteristics of a circular structure. High-intensity stations were concentrated near the main trunk, whereas stations with lower intensity or no connection were located outside the ring structure. Specifically, the distribution of high-intensity stations has undergone a gradual expansion, originating from the Dalian-Harbin main axis and extending northward as well as to both sides. This diffusion pattern not only highlights the increasingly tight integration between sea and rail transport but also effectively facilitates seamless connectivity between sea and land transport, thereby opening up more efficient and convenient logistics channels for inland regions.
Compared with high-intensity stations, the distribution of low-intensity stations demonstrated a circumferential embedding pattern, revealing a certain degree of functional complementarity and spatial connectivity among the stations. Simultaneously, the proportion of low-intensity stations within the overall network steadily declined over the years, suggesting that SRIT is increasingly assuming a central role in railway container freight networks in Northeast China. A comparison between Figures 10 and 11 reveals that the distribution of high-intensity stations aligns closely with that of the positively growing stations, as shown in Figure 10. This alignment underscores the fact that with the continuous maturation and optimisation of the SRIT mode, SRIT has emerged as a pivotal factor driving the growth of railway container freight volume in Northeast China. Furthermore, this development facilitated the strategic layout and optimisation of network nodes within the region.
Notably, not all stations effectively contributed to connections within the SRIT system. In 2013, the unaffiliated stations were clustered primarily in the northwestern region. Over time, the number of unaffiliated stations decreased, and their distribution became more dispersed. This transformation highlights the railway transportation network in Northeast China’s gradual adaptation to the evolving needs of intermodal transportation and markets.

4.3 Long-term relationship analysis between the intensity of sea-rail intermodal transport and the evolution of railway container freight stations

Based on the preceding analysis, it is evident that there is a notable correlation between the changes in the intensity of SRIT and the evolution of RCFS. To further explore the impact of SRIT on the evolution process of the RCFS and uncover the underlying evolutionary patterns, this section examines the long-term relationship between the two. The freight capacity, the most direct manifestation of the current development status of the RCFS, is a commonly used factor for evaluating such stations. Thus, we explored the correlation between freight volume and freight frequency with the combined intensity of SRIT, as described in Table 4 and Figure 12, respectively.
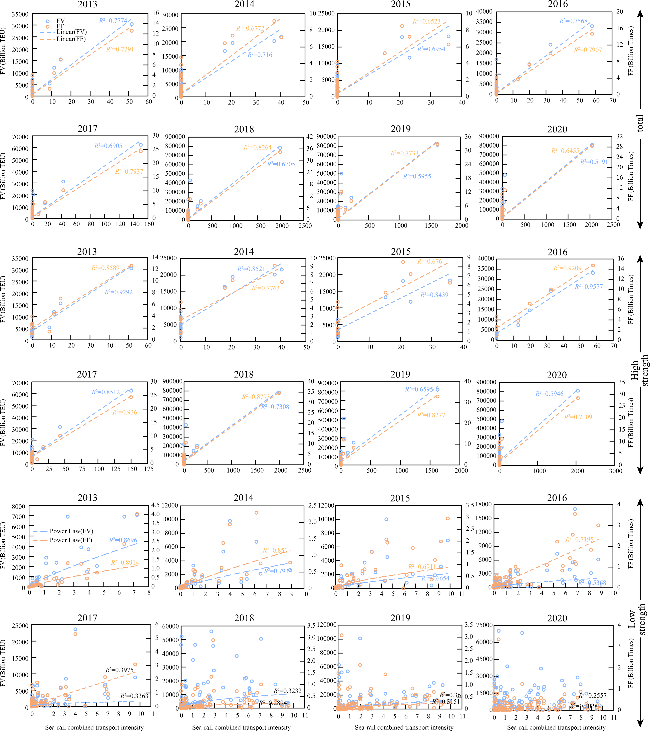
Table 4 Statistical regression analysis of combined intensity, freight volume, and freight frequency
V N Linear model Power law model Exponential model
R2 >0.5 R2 <0.5 R2 >0.5 R2 <0.5 R2 >0.5 R2 <0.5
FV FF FV FF FV FF FV FF FV FF FV FF
TI 8 8 8 0 0 - - - - 0 0 8 8
HI 8 8 8 0 0 4 1 4 7 4 4 4 4
LI 8 1 4 7 4 4 4 4 4 0 1 8 7
NI 8 - - - - - - - - - - - -

Note: V, variable; N, number of years for regression analysis; FV, freight volume; FF, freight frequency; TI, total intensity; HI, high intensity; LI, low intensity; NI, no intensity.

Figure 12 Statistical relationship between combined intensity and station freight capacity, 2013-2020
The findings indicate a significant positive linear correlation between the combined intensity and freight volume and the frequency of RCFS over the research period at the total level (R2 > 0.5). This finding reveals that, during the study period, the enhancement of SRIT intensity exhibited a temporal trend similar to the increase in the station’s freight capacity. More precisely, as the SRIT intensity gradually increased, the freight capacity of the stations demonstrated a corresponding growth pattern, suggesting that the intensity of the combined transport scales proportionally to the developmental progression of the station. This highlights the synergistic effect of the integrated transport mode in boosting both the volume and frequency of freight operations within the RCFS. For high-intensity stations, a significant and positive linear correlation was observed between their freight capacity and the combined intensity (R2 > 0.5), aligned with the overall analysis findings and further corroborating the existence of a positive correlation between the SRIT intensity and the freight capacity of these stations. For low-intensity stations, the regression analysis results were more complex. In some years, only the power-law model provided a relatively good fit, indicating that the growth rate of SRIT intensity exceeded that of freight volume and freight frequency.
However, over time, the discrepancy between the observed data and fitted values exhibited a gradually increasing trend. This may signify a complex relationship between the low-intensity stations and the development of SRIT. Although the power law model fits well, there may still be a nonlinear or insufficient association between the station freight volume and combined intensity. Conversely, the fit of freight frequency is comparatively superior; this disparity could be attributed to the complexity of empty container transportation and its potential repercussions on freight volume, which, in general, significantly influences the long-term development of the RCFS.

5 Conclusions and discussion

5.1 Conclusions

Using proprietary data obtained from 2013 to 2020, we established a general framework for the evolution of railway container transportation network nodes driven by SRIT. By employing a hybrid EWM-GA-TOPSIS model, complex network analysis, modified gravity model, and correlation and regression analyses, this study uncovered the evolutionary patterns and development trends of the RCFS in Northeast China from 2013 to 2020. The key findings are as follows.
(1) A polarisation phenomenon was observed at RCFS in Northeast China between 2013 and 2020. In terms of time, polarisation showed a tendency to gradually diminish, and the overall average score of the stations demonstrated an initial increase followed by a subsequent decline. In terms of space, the stations exhibited a wrap-around pattern, with lower-ranked stations uniformly distributed around higher-ranked stations. The higher-ranked stations were primarily concentrated near ports and key transportation hubs, establishing a close sea-rail transport connection with the ports, particularly the railway station surrounding the Yingkou Port.
(2) From 2013 to 2020, the RCFS presented a complex and dynamic evolutionary process characterised by an expansionary trend and unbalanced development among the stations. From a sustainable and long-term viewpoint, there was a significant increase in the number of new railway stations compared to those that were abandoned. The overall growth trend of the stations fluctuated significantly, with the annual number of new stations consistently exceeding that of abandoned stations. Additionally, the capacities of some stations did not improve correspondingly; however, among the annually operating stations, the number steadily increased over time.
(3) The evolution of the RCFS within the context of SRIT was a prolonged and intricate process. During the study period, the SRIT intensity at the RCFS exhibited a substantial increase. Notably, high-intensity stations are concentrated along the principal railway lines, thereby effectively facilitating the integration and connectivity between sea and land transportation. The proportion of low-intensity stations consistently decreased over the years. However, some stations do not contribute effectively to the SRIT system. From the analysis of the long-term relationship between SRIT and the RCFS, it is evident that a significant positive linear correlation exists between SRIT and both freight volume and frequency at the stations, which positively influences the enhancement of the stations’ freight capacity. A close relationship was observed between the high-intensity stations and the intensity of intermodal transport, whereas the low-intensity stations demonstrated a more complex association.

5.2 Planning and implications for railway container freight stations

From the analysis above, it is evident that the RCFS has generally demonstrated a positive developmental trend driven by SRIT. Furthermore, the development of SRIT has promoted the optimisation of the number of stations and transportation networks to a certain extent. However, despite enhancing connectivity between railways and ports, the current development status of SRIT in China still lags behind that of developed countries such as the US and the EU. In 2023, the volume of SRICT in China reached 10.18 million TEUs, accounting for only 3.28% of the total container throughput of 310 million TEUs (Figure 13). This statistic indicates that the development level of the SRICT in China is significantly lower than that in other countries. Nonetheless, considering its current growth rate, SRICT is poised to become the primary mode of transportation. This fact is particularly evident in the context of China’s active promotion of the Belt and Road Initiative, especially the 21st-Century Maritime Silk Road and the China Railway Express. With the globalisation of trade and the export-oriented processing economy as the dominant development model, there is a strong demand for maritime logistics. Simultaneously, enhanced trade interconnectivity with countries along the 21st-Century Maritime Silk Road through sea transportation channels has led to a notable increase in the demand for SRIT. Therefore, in the context of the rapid development of SRIT, optimising and upgrading the layout of railway stations holds significant importance.
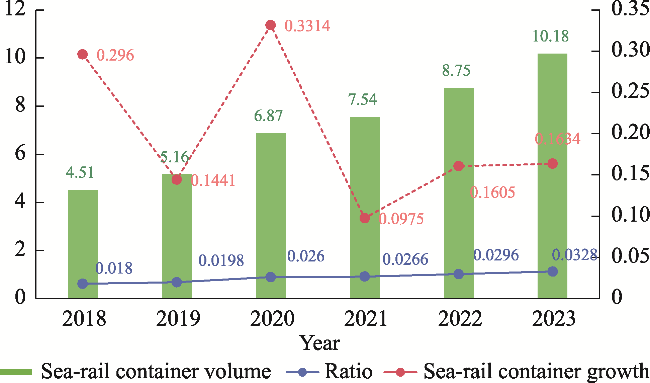
Figure 13 Sea-rail intermodal transport container of all Chinese ports (2018-2023) (Data source: Ministry of Transport of the People’s Republic of China)
Numerous avenues through which we can achieve the goal of optimising the planning of RCFS are available.
First, it is imperative to thoroughly explore the market potential. However, station planning is intricate and time-consuming, and it encompasses various factors, such as geographic location, regional economy, society, and environment. Upon the establishment of a railway station, a new station may face challenges in immediately demonstrating its anticipated transportation impact owing to various issues, including environmental integration, market development, and operational management. Consequently, efforts should be made during the operational phase to cultivate the market by establishing comprehensive research mechanisms. Such efforts must involve conducting regular surveys among enterprises within the station’s hinterland to ascertain their logistics demands for SRIT, focusing on key information, such as logistics requirements, cost expectations, and transportation preferences. These data should then be integrated with the transportation department’s insights to provide a foundation for subsequent route optimisation and transportation structure adjustments.
Furthermore, the government should encourage and facilitate the establishment of long-term cooperative relationships between station operators and enterprises in the hinterland. This aim can be achieved through the signing of strategic cooperation agreements, joint construction of logistics platforms, and other means to foster resource and risk sharing, thereby promoting deep integration between the industrial and supply chains. Additionally, the government may employ supportive policies such as preferential treatment and freight subsidies to reduce logistics costs for enterprises, enhance the visibility of low-intensity and unrelated stations, and open transportation markets to attract more cargo sources.
Moreover, it is crucial to continuously optimise the transportation structure and enhance the facility levels of railway stations. Driven by SRIT, railway planning will become more intricate with an increased proportion of freight transportation. Therefore, more refined segregation of passenger and freight traffic should be implemented. In regions with highly concentrated freight demand, dedicated freight railway lines should be expedited for construction or optimisation to achieve physical separation and independent operation of passenger and freight traffic, thereby maximising the potential capacity of freight railways. Simultaneously, efforts should be made to promote the research and application of speed enhancement technologies for freight trains, such as adopting more efficient traction systems, optimising train formation, and scheduling algorithms to shorten transportation time and enhance overall transportation efficiency.
In addition, the modernisation and expansion of existing freight stations should focus on enhancing the automation and intelligence levels of yards, including the introduction of automated loading and unloading systems, intelligent warehouse management systems, and efficient logistics information platforms to facilitate the rapid and accurate handling and tracking of SRIT. Additionally, the layout of the yards should be planned to increase storage and transfer capabilities and avoid logistics bottlenecks caused by cargo accumulation. Furthermore, a differentiated transportation strategy can be explored by flexibly adjusting the formation of freight trains based on cargo availability and transportation demand. Different transportation strategies and pricing standards should be implemented based on the types of goods, transportation distances, and urgency. For instance, time-sensitive goods can be offered to express direct services with correspondingly higher freight rates, whereas bulk non-urgent goods can be transported through consolidated shipments or slower trains to reduce costs. This strategy caters to the diverse needs of customers, enhances the market competitiveness and flexibility of railway freight transportation, reduces overall logistics costs, and boosts the attractiveness and market share of SRIT.

5.3 Limitations and prospects

In this study, we examined the SRIT-driven evolution of the RCFS in Northeast China. However, this study had several limitations.
First, owing to the confidentiality of the data obtained and the relatively short study period, future studies must focus on developing new methods for retrieving data from other years, locating alternative data sources, and conducting more detailed studies over a longer period.
Second, when analysing the evolutionary characteristics of the RCFS in Northeast China, the perspective of this study was limited to the internal aspects of the stations. We selected evaluation indicators solely from the dimensions of station development and constructed a corresponding indicator system. However, this approach fails to fully consider external environmental factors, such as social development trends, regional economic conditions, and population mobility patterns, which may also have profound impacts on RCFS development. Therefore, to understand the evolution patterns of stations driven by SRIT more comprehensively and deeply, future research should broaden its horizons, select and incorporate relevant external indicators, and delve into the mechanisms and pathways through which these external factors influence station development.
Finally, this study emphasises the development characteristics exhibited by the RCFS under the drive of SRIT, as well as the long-term close relationship between these characteristics and the development of SRIT. However, regarding how the government should further optimise and adjust freight development strategies for stations with different potentials, this study only provides policy-level suggestions without offering specific prediction methods. Such predictions rely heavily on advanced transportation simulation models and big data analysis techniques to accurately forecast the freight volume and flow direction of SRIT, thereby providing a solid scientific basis for the design and adjustment of routes. Therefore, guiding practices more precisely will require constructing a detailed and reliable prediction model for freight volume and flow direction. Constructing such a model will become an important focus of future research aimed at maximising the transportation efficiency of railway freight in Northeast China.
[1]
Aoun J, Quaglietta E, Goverde R M P et al., 2021. A hybrid Delphi-AHP multi-criteria analysis of moving block and virtual coupling railway signalling. Transportation Research Part C: Emerging Technologies, 129: 103250.

[2]
Bai Z Z, Kuang H B, Yang J et al., 2023. Evolution of spatial and temporal patterns of railway container transportation: A case study of China cities. Frontiers in Public Health, 10: 1087234.

[3]
Berli J, Bunel M, Ducruet C, 2018. Sea-land interdependence in the global maritime network: The case of Australian port cities. Networks and Spatial Economics, 18(3): 447-471.

[4]
Cacchiani V, Furini F, Kidd M P, 2016. Approaches to a real-world train timetabling problem in a railway node. Omega: International Journal of Management Science, 58: 97-110.

[5]
Cao X S, Yan X P, 2003. The impact of the evolution of land network on spatial structure of accessibility in the developed areas: The case of Dongguan city in Guangdong province. Geographical Research, 22(3): 305-312. (in Chinese)

[6]
Cao Y, Li M R, Zuo J P, 2022. Evaluation analysis and recommendations for the development of the Menda railway site based on TOPSIS model. Sustainability, 14(15): 9594.

[7]
Castillo-Manzano J, González-Laxe F, López-Valpuesta L, 2013. Intermodal connections at Spanish ports and their role in capturing hinterland traffic. Ocean & Coastal Management, 86: 1-12.

[8]
Chen C H, 2020. A novel multi-criteria decision-making model for building material supplier selection based on Entropy-AHP Weighted TOPSIS. Entropy, 22(2): 259.

[9]
Choong S T, Cole M H, Kutanoglu E, 2002. Empty container management for intermodal transportation networks. Transportation Research Part E: Logistics and Transportation Review, 38(6): 423-438.

[10]
European Communities, 1992. Council Directive 92/106/EEC of 7 December 1992 on the establishment of common rules for certain types of combined transport of goods between Member States. Official Journal of the European Union, L 365/43. https://eur-lex.europa.eu/legal-content/EN/TXT/?uri=CELEX:31992L0106.

[11]
European Communities, 2003. Consultation Paper European Commission Directorate General for Energy and Transport Directorate for Inland Transport: The Marco Polo Programme.https://trimis.ec.europa.eu/programme/marco-polo-programme.

[12]
European Commission, 2011. Roadmap to a Single European Transport Area: Towards a competitive and resource efficient transport system. https://eur-lex.europa.eu/LexUriServ/LexUriServ.do?uri=COM:2011:0144:FIN:EN:PDF.

[13]
European Commission, 2018. Combined Transport Directive review: Getting more goods off EU roads.https://www.europarl.europa.eu/thinktank/en/document/EPRS_BRI(2018)623553.

[14]
European Court of Auditors, 2016. Rail freight transport in the EU: Still not on the right track. https://www.eca.europa.eu/Lists/ECADocuments/SR16_08/SR_RAIL_FREIGHT_EN.pdf.

[15]
Fan L, Wilson W W, Tolliver D, 2010. Optimal network flows for containerized imports to the United States. Transportation Research Part E: Logistics and Transportation Review, 46(5): 735-749.

[16]
Feng F L, Yang L W, Lan D, 2013. Order-Parameter Model for synergetic theory-based railway freight system and evolution in China. Promet-Traffic & Transportation, 25(3): 195-207.

[17]
Feng F L, Cai M X, Jia J J, 2022. Key node identification of China Railway Express transportation network based on multi-layer complex network. Journal of Transportation Systems Engineering and Information Technology, 22(6): 10. (in Chinese)

[18]
Guo X, Huang S Y, Hsu W J et al., 2011. Dynamic yard crane dispatching in container terminals with predicted vehicle arrival information. Advaned Engineering Informatics, 25(3): 472-484.

[19]
Gharehgozli A H, Roy D, de Koster R, 2016. Sea container terminals: New technologies and OR models. Maritime Economics & Logistics, 18(2): 103-140.

[20]
Holland J H, 1975. Adaptation in Natural and Artificial Systems. Ann Arbor: University of Michigan Press.

[21]
Jin B, Dai T Q, 2008. Spacial interaction and network structure evolvement of cities in term of China’s railway container flow in 1990s. Economic Geography, 28(4): 583-587. (in Chinese)

[22]
Kang Y Z, He D, Gao P et al., 2021. Evolution and mechanism of port hinterland in Yangtze River Delta. Geographical Research, 40(1): 138-151. (in Chinese)

[23]
Kim J S, Shin N, 2021. Planning for railway station network sustainability based on node-place analysis of local stations. Sustainability, 13(9): 4778.

[24]
Labella A, Liu Y, Rodriguez R M et al., 2018. Analyzing the performance of classical consensus models in large scale group decision making: A comparative study. Applied Soft Computing. 67: 677-690.

[25]
Lestoille N, Soize C, Funfschilling C, 2016. Sensitivity of train stochastic dynamics to long-term evolution of track irregularities. Vehicle System Dynamics, 54(5): 545-567.

[26]
Li M J, Li L Y, Wu F M, 2018a. Dynamic assessment of circular economy in provincial regions based on improved TOPSIS. Journal of Xidian University (Social Science Edition), (3): 21-30. (in Chinese)

[27]
Li D Q, Zhao L J, Wang C C et al., 2018b. Selection of China’s imported grain distribution centers in the context of the Belt and Road Initiative. Transportation Research Part E: Logistics and Transportation Review, 120: 16-34.

[28]
Li X D, Kuang H B, Zhao Y Z et al., 2021. An empirical study on low-carbon and multimodal transport in Northeast China. Management Review, 33(3): 282-291. (in Chinese)

[29]
Liu W, Zhu X, Wang L et al., 2024. Flexible yard crane scheduling for mixed railway and road container operations in sea-rail intermodal ports with the sharing storage yard. Transportation Research Part E: Logistics and Transportation Review, 190: 103714.

[30]
Lourencetti F D, 2022. Port-railway connection in Setubal (Portugal): An understanding of the past for a sustainable future. Planning Perspectives, 38(3): 581-602.

[31]
Lu T R, Chen J H, Zhao C X et al., 2023. Optimization of high-speed rail express transportation plan considering products’ variable time requirements. Applied Sciences-Basel, 13(12): 6919.

[32]
Luo T, Chang D F, Gao Y P, 2018. Optimization of gantry crane scheduling in container sea-rail intermodal transport yard. Mathematical Problems in Engineering, 2018: 9585294.

[33]
Mark Newman, Albert-Laszlo Barabasi, Duncan J Watts, 2006. The Structure and Dynamics of Networks. Princeton: Princeton University Press.

[34]
Maskeliunaite L, 2021. Railways in Lithuania: From Tsarist Russia to Rail Baltica. Transport, 36(4): 364-375.

[35]
Meng Y Y, Qi Q J, Liu J Z et al., 2022. Dynamic evolution analysis of complex topology and node importance in Shenzhen metro network from 2004 to 2021. Sustainability, 14(12): 7234.

[36]
Oliviero B, Pietro M, 2020. The role of port authorities in the promotion of logistics integration between ports and the railway system: The Italian experience. Research in Transportation Business & Management, 35: 100451.

[37]
Peng P, Cheng S F, Chen J H et al., 2018. A fine-grained perspective on the robustness of global cargo ship transportation networks. Journal of Geographical Sciences, 28(7): 881-899.

[38]
Peng Z X, Wang H Z, Wang W S et al., 2019. Intermodal transportation of full and empty containers in harbor-inland regions based on revenue management. European Transport Research Review, 11(1): 7.

[39]
Reis V, Almeida A, 2019. Capacity evaluation of a railway terminal using microsimulation: Case study of a freight village in Turin. Frontiers in Built Environment, 5: 75.

[40]
Santos L F D M, Osiro L, Lima R H P, 2017. A model based on 2-tuple fuzzy linguistic representation and Analytic Hierarchy Process for supplier segmentation using qualitative and quantitative criteria. Expert Systems with Applications, 79: 53-64.

[41]
Shaw S L, Fang Z X, Lu S W et al., 2014. Impacts of high speed rail on railroad network accessibility in China. Journal of Transport Geography, 40: 112-122.

[42]
Shafiee M, Zare-Mehrjerdi Y, Govindan K et al., 2022. A causality analysis of risks to perishable product supply chain networks during the COVID-19 outbreak era: An extended DEMATEL method under Pythagorean fuzzy environment. Transportation Research Part E: Logistics and Transportation Review, 163: 102759.

[43]
Shen J W, Zong H M, 2023. Identification of critical transportation cities in the multimodal transportation network of China. Physica A: Statistical Mechanics and Its Applications, 628: 129174.

[44]
Sun W J, Zhao L J, Wang C C et al., 2020. Selection of consolidation centers for China Railway Express. International Journal of Logistics-Research and Applications, 23(5): 417-442.

[45]
United Nations, 1980. United Nations Conference on a Convention on International Multimodal Transport. https://unctad.org/system/files/official-document/tdmtconf17_en.pdf.

[46]
Valerio D, Lopes A M, Machado J A T, 2016. Entropy analysis of a railway network’s complexity. Entropy, 18(11): 388.

[47]
Vis I.F.A., de Koster R, 2003. Transshipment of containers at a container terminal: An overview. European Journal of Operational Research, 147(1): 1-16.

[48]
Vukic L, Jugovic T P, Guidi G et al., 2020. Model of determining the optimal, green transport route among alternatives: Data envelopment analysis settings. Journal of Marine Science and Engineering, 8(10): 735.

[49]
Wang J E, Jiao J J, Ma L, 2018. An organizational model and border port hinterlands for the China-Europe Railway Express. Journal of Geographical Sciences, 28(9): 1275-1287.

[50]
Wang C J, Li X M, Chen P R et al., 2020. Spatial pattern and developing mechanism of railway geo-systems based on track gauge: A case study of Eurasia. Journal of Geographical Sciences, 30(8): 1283-1306.

[51]
Wang D G, Xu Y F, Zhao M F, 2022. Spatial differentiation and influence mechanism of the connection-distribution performance of urban high-speed railway hub in the Yangtze River Economic Belt. Journal of Geographical Sciences, 32(12): 2475-2502.

[52]
Watróbski J, Malecki K, Kijewska K et al., 2017. Multi-criteria analysis of electric vans for city logistics. Sustainability, 9(8): 1453.

[53]
Wei H R, Lee P T W, 2021. Designing a coordinated horizontal alliance system for China’s inland ports with China Railway Express platforms along the Silk Road Economic Belt. Transportation Research Part E: Logistics and Transportation Review, 147: 102238.

[54]
Xie Y S, Wang C J, 2021. Evolution and construction differentiation pattern of African railway network. Sustainability, 13(24): 13728.

[55]
Xu L M, Li M J, Ou Z H et al., 2019. Dynamic evaluation method based on virtual worst solution gray correlation degree. Journal of Systems Science and Mathematical Sciences, 39(3): 365-377. (in Chinese)

[56]
Yin L Z, Wang Y F, 2023. Spatiotemporal evolution analysis of the Chinese railway network structure based on self-organizing maps. ISPRS International Journal of Geo-Information, 12(4): 161.

[57]
Zhai W M, Han Z L, Chen Z W et al., 2019. Train-track-bridge dynamic interaction: A state-of-the-art review. Vehicle System Dynamics, 57(7): 984-1027.

[58]
Zhao H L, Yao L H, Mei G et al., 2017. A fuzzy comprehensive evaluation method based on AHP and entropy for landslide susceptibility map. Entropy, 19(8): 396.

[59]
Zhao L J, Zhao Y, Hu Q M, 2018. Evaluation of consolidation center cargo capacity and locations for China Railway Express. Transportation Research Part E: Logistics and Transportation Review, 117: 58-81.

[60]
Zhang H, Cui H D, Wang W et al., 2020. Properties of Chinese railway network: Multilayer structures based on timetable data. Physica A: Statistical Mechanics and Its Applications, 560: 125184.

[61]
Zhang X F, Lu J, Peng Y, 2021. Hybrid MCDM model for location of logistics hub: A case in China under the Belt and Road Initiative. IEEE Access, 9: 41227-41245.

[62]
Zhang M D, Li X S, 2023. Spatial correlation network of urban air pollution control efficiency in the Yellow River Basin and its driving factors. Economic Geography, 43(8): 62-72. (in Chinese)

[63]
Zheng W S, Xiong Y J, Wang X F, 2022. Evolutionary characteristics of railway flow network urban agglomerations in the middle reaches of Yangtze River: Based on game overlapping community model. Economic Geography, 42(11): 9-18. (in Chinese)

[64]
Zhou H X, Zhou L S, Guo B et al., 2022. Analyzing the railway operation network by evaluating the importance of time-space nodes. IEEE Transactions on Network Science and Engineering, 9(6): 4209-4219.

Outlines

/