
Journal of Geographical Sciences >
Relocation for improved ecosystem service and human wellbeing? Evidence from Fuping, Hebei, China
|
Wu Pengxin, specialized in ecosystem services. E-mail: pengxinwu@mail.bnu.edu.cn |
Received date: 2024-12-25
Accepted date: 2025-04-23
Online published: 2025-08-26
Supported by
National Natural Science Foundation of China(42361144859)
Team Construction Project of Faculty of Geographical Science, BNU(2024-JXTD-03)
Team Construction Project of Faculty of Geographical Science, BNU(2024-KYTD-09)
The Beijing Normal University Tang Scholar(2021)
Migration is a potential strategy to reduce poverty in the Global South. In China, the Poverty-alleviation Relocation (PAR) is a government-led, large-scale migration initiative aimed at eliminating poverty and promoting environmental sustainability. To examine the ecological and socio-economic effects of the PAR, we quantified the changes in five types of ecosystem services (ES) as well as the subjective well-being of rural residents in Fuping county, Hebei province of China, by using ES mapping, household survey, and semi-structured interviews. We found that the PAR improves people’s quality of life, with the well-being scores associated with transportation, communication, education, and healthcare increasing by 0.45-0.81. Additionally, the PAR enhances the supply of ES, evidenced by the increases in four types of ES in both in-migration and out-migration areas. The ES growth rates in in-migration areas ranged from 0.7% to 3.9%, while in out-migration areas, the rates ranged from 0.4% to 2.5%. However, the changes in income and food well-being are minimal, with scores at 0 and 0.32, respectively. More importantly, the elderly and low-educated residents experience minimal improvements in well-being after relocation. Our findings suggest that for other developing countries seeking to adopt PAR, it is crucial to provide targeted support for livelihood transitions, particularly for marginalized social groups, restore out-migration areas, and strengthen cross-regional cooperation to better address ecological constraints on livelihoods.
WU Pengxin , LIU Mingyao , ZHENG Mingze , LIAO Chuan , HUA Xiaobo , FEI Ding , BAI Yansong , ZHOU Yuchen , ZHOU Yihan , HUANG Qingxu . Relocation for improved ecosystem service and human wellbeing? Evidence from Fuping, Hebei, China[J]. Journal of Geographical Sciences, 2025 , 35(7) : 1556 -1574 . DOI: 10.1007/s11442-025-2384-6
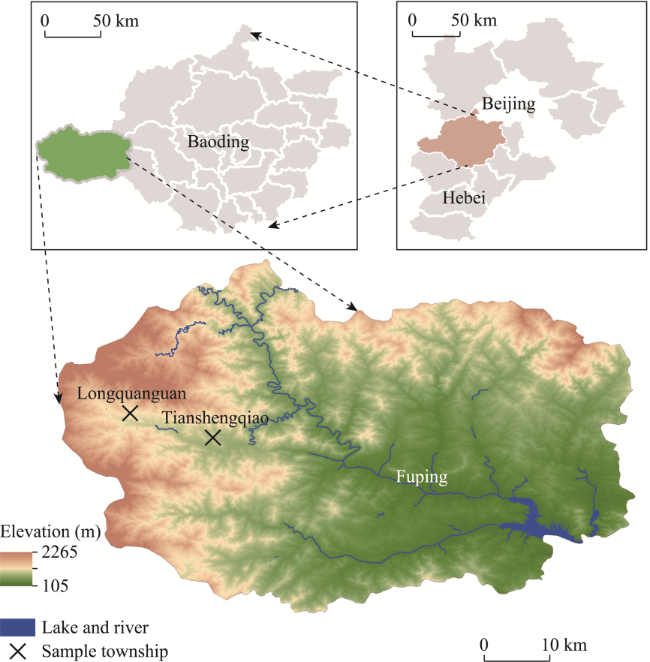
Figure 1 Location of the study area (Fuping county, Hebei province, North China) and the selected sample townships |
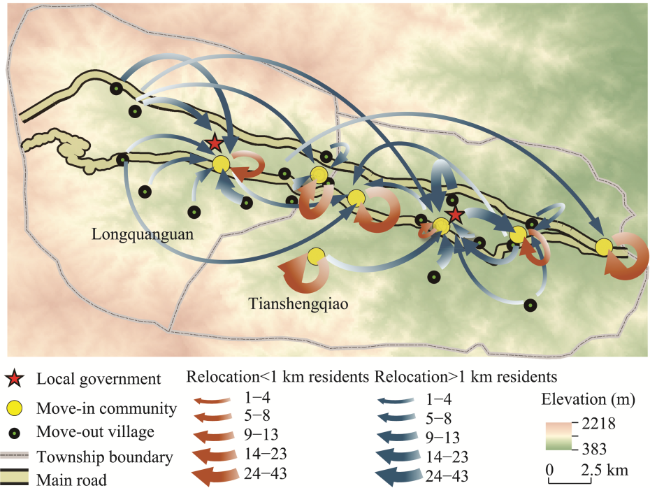
Figure 2 Relocation process in sample townships (relocation number from survey respondents) |
Table S1 Survey on household life satisfaction and socio-economic characteristics |
| Dear Sir/Madam, We are from the Faculty of Geography, Beijing Normal University, and we are currently conducting a survey on household life satisfaction in Fuping. We invite you to complete this questionnaire. The survey is conducted anonymously and does not involve personal information such as your name or phone number. We will keep the results strictly confidential, so please feel free to answer truthfully. We sincerely appreciate your participation! | |||||||||||
|---|---|---|---|---|---|---|---|---|---|---|---|
| Satisfaction | |||||||||||
| Question description | Strongly disagree | Disagree | No difference | Agree | Strongly agree | ||||||
| After relocation, the income of household members has increased. | ○ | ○ | ○ | ○ | ○ | ||||||
| After relocation, you can have access to food from more sources, and it is sufficient and secure. | ○ | ○ | ○ | ○ | ○ | ||||||
| After relocation, you can have access to water from more sources, and it is sufficient and secure. | ○ | ○ | ○ | ○ | ○ | ||||||
| After relocation, the wireless communication (e.g., phone, internet signal) has improved. | ○ | ○ | ○ | ○ | ○ | ||||||
| After relocation, transportation in your area has become more convenient (you can reach your destination faster and more easily). | ○ | ○ | ○ | ○ | ○ | ||||||
| After relocation, you and your family have easier access to better educational resources (e.g., easier school enrollment, shorter distance to school). | ○ | ○ | ○ | ○ | ○ | ||||||
| After relocation, the quality of your housing has improved (e.g., per capita housing area, house quality). | ○ | ○ | ○ | ○ | ○ | ||||||
| After relocation, the number of green spaces (parks, squares, etc.) in your area has increased. | ○ | ○ | ○ | ○ | ○ | ||||||
| After relocation, your physical health has improved. | ○ | ○ | ○ | ○ | ○ | ||||||
| After relocation, your mental health has improved (e.g., better mood, reduced life stress). | ○ | ○ | ○ | ○ | ○ | ||||||
| After relocation, the ecological environment (air quality, greenery in the community, etc.) in your area has made you feel happier. | ○ | ○ | ○ | ○ | ○ | ||||||
| After relocation, your daily diet has become more diverse, nutritious, and healthy. | ○ | ○ | ○ | ○ | ○ | ||||||
| After relocation, you and your family have easier access to better medical resources (e.g., easier to buy medicine, see a doctor). | ○ | ○ | ○ | ○ | ○ | ||||||
| After relocation, the crime rate in your area has decreased, social security has improved, and your sense of safety has increased. | ○ | ○ | ○ | ○ | ○ | ||||||
| After relocation, the pollution (e.g., water pollution, air pollution) in your area has decreased, and the environmental quality has improved. | ○ | ○ | ○ | ○ | ○ | ||||||
| After relocation, the frequency of natural disasters (e.g., flash floods) in your area has decreased. | ○ | ○ | ○ | ○ | ○ | ||||||
| After relocation, your connection with community residents, relatives, and friends has become closer. | ○ | ○ | ○ | ○ | ○ | ||||||
| After relocation, you often participate in social activities (e.g., square dancing, community events). | ○ | ○ | ○ | ○ | ○ | ||||||
| After relocation, you are more actively involved in the decisions and implementation of village or town affairs. | ○ | ○ | ○ | ○ | ○ | ||||||
| Overall, your satisfaction with life has increased after relocation. | ○ | ○ | ○ | ○ | ○ | ||||||
| Realized ecosystem services | |||||||||||
| Type | Indicator | ||||||||||
| Provisioning | Annual income from crop farming (e.g., medicinal plants, fruit trees, mushroom cultivation, etc.): ≤ ¥0-1000 ≤ ¥1000-3000 ≤ ¥3000-5000 ≤ ¥5000-10,000 ≤ ¥10,000-50,000 ≤ ¥50,000-100,000 ≤ > ¥100,000 ≤ None | ||||||||||
| Annual income from livestock farming (e.g., pig farming, fish farming, poultry farming): ≤ ¥0-1000 ≤ ¥1000-3000 ≤ ¥3000-5000 ≤ ¥5000-10,000 ≤ ¥10,000-50,000 ≤ > ¥50,000 ≤ None | |||||||||||
| How much has your annual water bill increased after relocation: ≤ ¥0-100 ≤ ¥100-300 ≤ ¥300-500 ≤ ¥500-800 ≤ > ¥800 ≤ No difference ≤ Decreased | |||||||||||
| Did you use natural resources such as coal, wood, or straw for fuel before relocation? ≤ Yes ≤ No | |||||||||||
| How much has your annual electricity bill increased after relocation? ≤ ¥0-250 ≤ ¥250-500 ≤ ¥500-750 ≤ ¥750-1000 ≤ ¥1000-1500 ≤ > ¥1500 ≤ No difference ≤ Decreased | |||||||||||
| Regulation | Have you been affected by the following disasters? ≤ Drought ≤ Spring frost ≤ Sandstorm ≤ Flash flood ≤ Heavy rain ≤ Other_______ ≤ None | ||||||||||
| Annual economic loss caused by natural disasters: ≤ ¥0-1000 ≤ ¥1000-3000 ≤ ¥3000-5000 ≤ ¥5000-10,000 ≤ ¥10,000-50,000 ≤ > ¥50,000 ≤ None | |||||||||||
| Do you think the quality of drinking water has changed after relocation? ≤ Significantly decreased ≤Slightly decreased ≤ No difference ≤ Slightly improved ≤ Significantly improved | |||||||||||
| Do you think air quality has changed after relocation? ≤ Significantly decreased ≤Slightly decreased ≤ No difference ≤ Slightly improved ≤ Significantly improved | |||||||||||
| Compared to the original village, do you think the plant diversity in the community has changed after relocation? ≤ Significantly decreased ≤Slightly decreased ≤ No difference ≤ Slightly improved ≤ Significantly improved | |||||||||||
| Cultural | Frequency of recreational activities such as hiking, walking by the river, or chatting in the community: ≤ 5-7 times a week ≤ 3-5 times a week ≤ 1-2 times a week ≤ Once every two weeks ≤ Rarely | ||||||||||
| Frequency of social or recreational activities such as going to squares or activity centers (outdoor): ≤ 5-7 times a week ≤ 3-5 times a week ≤ 1-2 times a week ≤ Once every two weeks ≤ Rarely | |||||||||||
| Annual income from tourism (including wages from working at natural scenic spots such as the Tienshengqiao Waterfall Scenic Area): ≤ ¥0-5000 ≤ ¥5000-10,000 ≤¥10,000-50,000 ≤ ¥50,000-100,000 ≤ > ¥100,000 ≤ None | |||||||||||
| Personal information | |||||||||||
| Gender | ≤ Male ≤ Female | Age | ≤≤19 ≤ 20-29 ≤ 30-39 ≤ 40-49 ≤ 50-59 ≤≥60 | ||||||||
| Occupation | ≤ Enterprise/Public institution ≤ Crop farming ≤ Livestock farming ≤ Handicraft ≤ Tourism ≤ Migrant work ≤ Other_______ | ||||||||||
| Educational level | ≤ No education ≤ Primary school ≤ Junior high school ≤ High school ≤ College or higher | ||||||||||
| Current resettlement area | ≤ Gaoqu ≤ Ping Shitou ≤ Dajiaochang ≤ Zhujiaying ≤ Tienshengqiao ≤ Liyuanpu ≤ Bulaoshu | ||||||||||
| Administrative village before relocation | ≤ Longquanguan ≤ Pingshitou ≤ Beiliuzhuang ≤ Heiyagou ≤ Gujiatai ≤ Xiliuzhuang ≤ Yinshashi ≤ Luotuowan ≤ Balizhuang ≤ Qingyanggou ≤ Dahubu ≤ Heilingou ≤ Tagou ≤ Luojiazhuang ≤ Dajiaochang ≤ Zhuajiaying ≤ Longwangmiao ≤ Bulaoshu ≤ Nanliyuanpu ≤ Tianshengqiao ≤ Beiliyuanpu ≤ Xixiaguan ≤ Yantai ≤ Hongcaohe ≤ Dachegou | ||||||||||
| Socio-economic characteristics | |||||||||||
| Annual non-agricultural income (e.g., wages, shop operation) | ≤ ¥0-5000 ≤ ¥5000-10,000 ≤ ¥10,000-30,000 ≤ ¥30,000-50,000 ≤ ¥50,000-100,000 ≤ > ¥100,000 ≤ None | ||||||||||
| Housing compensation (Subsidy for original house during relocation) | ≤ ¥0-1000 ≤ ¥1000-3000 ≤ ¥3000-5000 ≤ ¥5000-10,000 ≤ ¥10,000-30,000 ≤ ¥30,000-50,000 ≤ > ¥50,000 ≤ None | ||||||||||
| Per capita household annual income | ≤ ¥0-1000 ≤ ¥1000-3000 ≤ ¥3000-5000 ≤ ¥5000-10,000 ≤ ¥10,000-30,000 ≤ ¥30,000-50,000 ≤ > ¥50,000 | ||||||||||
| Do you have a pension? | ≤ Yes ≤ No | Are you a member of a poor household? | ≤ Yes ≤ No | ||||||||
Table 1 Classification and definition of subjective well-being indicators |
| Subjective well-being | Factors | Definition |
|---|---|---|
| Essential materials for a good life | Food | The ease of access to a diverse and abundant food supply |
| Fresh water | The ease of access to an ample water supply | |
| Communication | The wireless communication such as phone and internet signal | |
| Transport | The level of transportation convenience | |
| Education | The ease of access to education such as distance | |
| Housing | The quality of housing, such as per capita housing area and house quality | |
| Public facilities | The number of green spaces, such as parks and squares | |
| Health | Physical | The level of physical health |
| Mental | The level of mental health, such as mood and life stress | |
| Diet | Dietary diversity and nutritional quality | |
| Medical conditions | The accessibility and abundance of medical resources | |
| Safety | Social and public safety | The crime rate and public security in the region |
| Productive Security | The level of environmental pollution and the frequency of natural disasters | |
| Income | Income | Changes in income of household members |
| Social interaction | Neighbours and friends | The degree of closeness in connections with neighborhood residents, relatives, and friends |
| Social activities | The frequency of participation in social activities | |
| Political activity | The frequency of participation in the decision-making and implementation of affairs in the village or town |
Table 2 Characteristics of respondents and residents in Fuping |
| Respondents’ characteristics | Residents’ characteristics | |||||
|---|---|---|---|---|---|---|
| Type | Number | Proportion | Type | Number | Proportion | |
| Gender | Female | 134 | 47.9% | Female | 45,140 | 48.2% |
| Male | 146 | 52.1% | Male | 48,543 | 51.8% | |
| Age | 0-19 years old | 33 | 11.8% | 0-15 years old | 19,526 | 20.8% |
| 20-29 years old | 11 | 3.9% | ||||
| 30-39 years old | 19 | 6.8% | 16-59 years old | 47,134 | 50.3% | |
| 40-49 years old | 53 | 18.9% | ||||
| 50-59 years old | 51 | 18.2% | 60 years old and above | 27,023 | 28.9% | |
| 60 years old and above | 113 | 40.4% | ||||
| Education | Uneducated | 47 | 16.8% | Uneducated | 2808 | 3.1% |
| Primary school | 68 | 24.3% | Primary school | 31,184 | 34.1% | |
| Junior high school | 99 | 35.4% | Junior high school | 45,749 | 50.0% | |
| High school | 44 | 15.7% | High school | 5695 | 6.2% | |
| College and above | 22 | 7.9% | College and above | 3392 | 3.7% | |
| Non-agricultural income (104 yuan) | 0 | 133 | 47.5% | |||
| 0-0.5 | 42 | 15.0% | ||||
| 0.5-1 | 33 | 11.8% | ||||
| 1-3 | 45 | 16.1% | N/A | |||
| 3-5 | 19 | 6.8% | ||||
| 5-10 | 5 | 1.8% | ||||
| >10 | 3 | 1.1% | ||||
| Per capita household income (104 yuan) | 0-0.1 | 79 | 28.2% | |||
| 0.1-0.3 | 64 | 22.9% | ||||
| 0.3-0.5 | 33 | 11.8% | ||||
| 0.5-1 | 39 | 13.9% | N/A | |||
| 1-3 | 44 | 15.7% | ||||
| 3-5 | 11 | 3.9% | ||||
| >5 | 10 | 3.6% | ||||
| Identified poor households | yes | 129 | 46.1% | N/A | ||
| no | 151 | 53.9% | ||||
Table 3 Methods for quantifying selected ecosystem services |
| Ecosystem service | Name | Calculation methodology and interpretation | References |
|---|---|---|---|
| Provisioning services | Food provision | AcK is the area of the region occupied by food C in land use/cover type KρcK, the supply of food per unit area in land use/cover type K. The food supply in the study area was calculated based on croplands providing rice, oil crops, and vegetables; grasslands supplying meat and dairy products; and water bodies yielding aquatic products. | Sharp et al., 2018 |
| Supporting services | Habitat quality | Qxj indicates the habitat quality of plot x in the jth land use/cover type; Hj is the habitat suitability of land use/cover type j; Dxj is the level of stress to which the xth plot in land use/cover type j is subjected; k is the half-saturation constant, usually half the maximum value of Dxj; and z is the normalisation constant, which usually takes the value of 2.5. | Bai et al., 2011 |
| Regulating services | Carbon storage | refers to pixel area, , , , refer to aboveground, belowground carbon density, and carbon density in soil organics and organic litter in each land use type, respectively. | Sharp et al., 2018; Ren et al., 2024 |
| Water retention | A represents the pixel area, Px,y is the amount of precipitation for image (x,y), C is the regional surface runoff coefficient, RK,x,y denotes the proportion of surface runoff intercepted for image (x,y) with land use/cover type K. In the study area, the value of C is 0.6. The proportions of surface runoff interception for cropland, forest, and grassland are 12%, 20%, and 11%. | Yang et al., 2015 | |
| Air purification | APK,x,y is PM10 retention and absorption for pixel (x,y) with land use/cover type, A is the pixel area, and PMK,x,y is PM10 adsorption per unit area for image (x,y) with land use/cover type. The PM10 adsorption per unit area for cropland, forest, and grassland are 9.2 kg/ha, 62 kg/ha, and 27 kg/ha. | Landuyt et al., 2016 |
Table S2 Food supply per unit area of different land types in Fuping county |
| Croplands | Grasslands | Water bodies | ||||
|---|---|---|---|---|---|---|
| Rice | Oil crops | Vegetables | Meat | Dairy products | Aquatic products | |
| Production per unit area (t/km2) | 304.7 | 11.3 | 611.49 | 10.02 | 145.98 | 496.32 |
Table S3 Carbon density of each land use/cover type use |
| Land use/cover type | Aboveground carbon density (t/ha) | Belowground carbon density (t/ha) | Carbon density in soil organics (t/ha) | Carbon density organic litter (t/ha) |
|---|---|---|---|---|
| Croplands | 5.0 | 0.7 | 108.4 | 0.0 |
| Forest | 59.8 | 10.8 | 185.3 | 7.8 |
| Grasslands | 0.6 | 2.8 | 99.9 | 0.0 |
| Unutilized land | 0.1 | 0.0 | 9.6 | 0.0 |
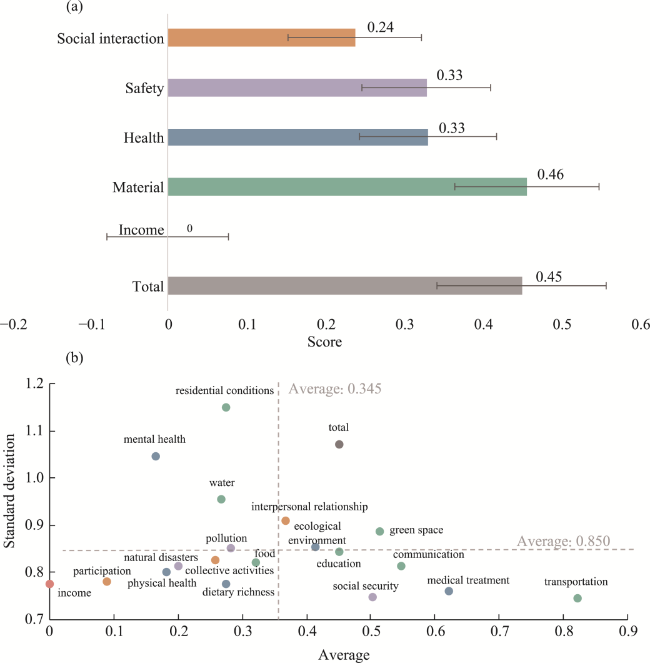
Figure 3 The average changes in the well-being of relocated individuals (a. dimensions; b. indicators) |
Table 4 The differences of well-being changes among individuals with different socio-economic characteristics |
| Socio-economic characteristics | Type | Total | Income | Material | Health | Safety | Social interaction |
|---|---|---|---|---|---|---|---|
| Age | 0-19 | 1 | 0.545 | 0.703 | 0.687 | 0.596 | |
| 20-29 | 0.727 | 0.273 | 0.709 | 0.424 | 0.303 | ||
| 30-39 | 0.474 | 0.158 | 0.232 | 0.421 | 0.035 | ||
| 40-49 | 0.377 | 0.057 | 0.215 | 0.384 | 0.377 | ||
| 50-59 | 0.373 | -0.137 | 0.259 | 0.373 | 0.176 | ||
| >60 | 0.327 | -0.177 | 0.29 | 0.153 | 0.124 | ||
| χ2 | 12.193* | 30.681** | 14.75* | 22.171** | 18.505** | ||
| Occupation | Student | 1.08 | 0.48 | 0.68 | 0.587 | 0.573 | |
| Government officials | 0.5 | 0.083 | 0.517 | 0.444 | 0.778 | ||
| Others | 0.587 | 0.206 | 0.425 | 0.418 | 0.222 | ||
| Farmer | 0.414 | -0.071 | 0.391 | 0.224 | 0.186 | ||
| Migrant worker | 0.468 | -0.106 | 0.298 | 0.397 | 0.298 | ||
| Handicrafts | 0.167 | -0.167 | -0.1 | 0.389 | -0.056 | ||
| Tourism | 0 | -0.25 | 0.15 | 0.208 | -0.083 | ||
| Unemployed | 0.082 | -0.265 | 0.016 | 0.15 | 0.061 | ||
| χ2 | 18.64** | 24.924** | 26.041** | 15.658* | 24.624** | ||
| Education | Uneducated | 0.213 | -0.277 | 0.337 | 0.336 | 0.191 | |
| Primary school | 0.015 | -0.265 | 0.3 | 0.056 | 0.137 | ||
| Junior high school | 0.707 | 0.061 | 0.496 | 0.378 | 0.343 | ||
| High school | 0.705 | 0.364 | 0.649 | 0.459 | 0.583 | ||
| College and above | 0.636 | 0.409 | 0.63 | 0.709 | 0.636 | ||
| χ2 | 20.276** | 31.506** | 12.146* | 24.404** | 21.483** |
Note: **, *, and + indicate significant levels of 0.01, 0.05, and 0.1, respectively. |
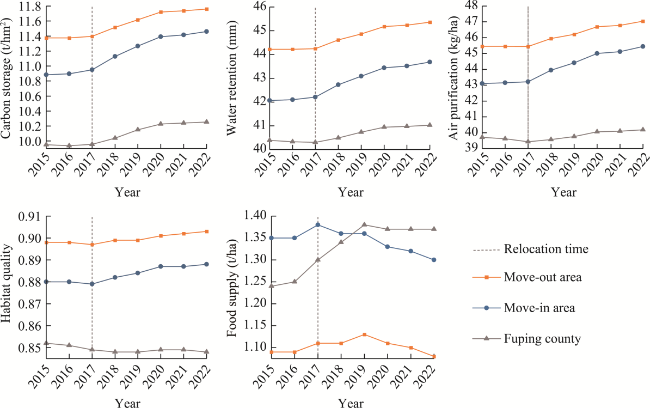
Figure 4 Changes in ES of out-migration and in-migration areas (2015-2022) |
| [1] |
|
| [2] |
|
| [3] |
|
| [4] |
|
| [5] |
|
| [6] |
|
| [7] |
|
| [8] |
|
| [9] |
|
| [10] |
|
| [11] |
|
| [12] |
|
| [13] |
|
| [14] |
|
| [15] |
|
| [16] |
Hebei Province Development and Reform Commission, 2016. Hebei Province “13th Five-Year” Poverty Alleviation Relocation Plan.
|
| [17] |
|
| [18] |
|
| [19] |
|
| [20] |
|
| [21] |
|
| [22] |
|
| [23] |
|
| [24] |
|
| [25] |
|
| [26] |
|
| [27] |
|
| [28] |
|
| [29] |
|
| [30] |
|
| [31] |
|
| [32] |
|
| [33] |
MEA, 2005. Ecosystems and Human Well-being:Current State and Trends. Washington, DC: Island Press, 25.
|
| [34] |
Ministry of Environmental Protection, 2015. National Ecological Function Zoning (Revised Edition). https://www.mee.gov.cn/gkml/hbb/bgg/201511/t20151126_317777.htm. (in Chinese)
|
| [35] |
|
| [36] |
National Development and Reform Commission, 2016. Poverty alleviation resettlement plan during the period of Thirteenth Five-year Plan. https://www.ndrc.gov.cn/xxgk/zcfb/tz/201610/W020190905517351522212.pdf. (in Chinese)
|
| [37] |
National Development and Reform Commission, 2020. The “13th Five-Year Plan” poverty alleviation resettlement task has been fully completed. https://www.ndrc.gov.cn/fzggw/wld/zcx/lddt/202012/t20201203_1252215.html. (in Chinese)
|
| [38] |
National Rural Revitalization Administration, 2014. List of 832 poor counties in China. https://nrra.gov.cn/art/2014/12/23/art_343_981.html. (in Chinese)
|
| [39] |
|
| [40] |
|
| [41] |
|
| [42] |
|
| [43] |
|
| [44] |
|
| [45] |
|
| [46] |
|
| [47] |
|
| [48] |
|
| [49] |
|
| [50] |
|
| [51] |
|
| [52] |
|
| [53] |
|
| [54] |
|
| [55] |
|
| [56] |
|
| [57] |
|
| [58] |
|
| [59] |
|
| [60] |
|
| [61] |
|
| [62] |
|
| [63] |
|
| [64] |
|
| [65] |
|
| [66] |
|
/
| 〈 |
|
〉 |