Research Articles

Spatial distribution changes and habitat conservation of medicinal plant diversity in the Yinshan Mountains (China) under climate change

  • ZHAO Zeyuan , 1, 2 ,
  • BI Yaqiong 2 ,
  • WEI Xinxin 3 ,
  • CHEN Yuan 2 ,
  • ZHANG Ru 1 ,
  • GUO Jingxia 1 ,
  • ZHANG Mingxu 4 ,
  • ZHANG Xiaobo 4 ,
  • LI Minhui , 1, 2, 3, *
Expand
  • 1. Baotou Medical College, Baotou 014040, Inner Mongolia, China
  • 2. Inner Mongolia Traditional Chinese & Mongolian Medical Research Institute, Hohhot 010010, China
  • 3. Inner Mongolia University, Hohhot 010070, China
  • 4. State Key Laboratory for Quality Ensurance and Sustainable Use of Dao-di Herbs, National Resource Center for Chinese Materia Medica, China Academy of Chinese Medical Sciences, Beijing 100700, China
* Li Minhui (1978‒), PhD and Professor, specialized in protection and development and utilization of Chinese and Mongolian medicine resources. E-mail:

Zhao Zeyuan (2000‒), Master Candidate, specialized in protection and development and utilization of Chinese and Mongolian medicine resources. E-mail:

Received date: 2024-05-01

  Accepted date: 2025-04-24

  Online published: 2025-08-26

Supported by

The National Key Research and Development Program of China(2021YFE0190100)

Inner Mongolia Autonomous Region Mongolian Medicine Standardization Project(2023-[MB023])

The Earmarked Fund for CARS(CARS-21)

Abstract

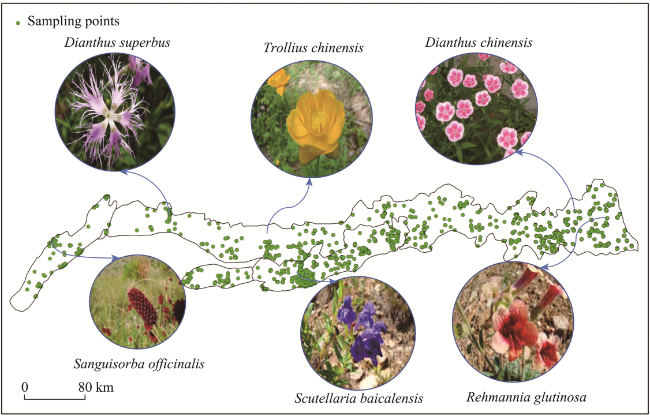
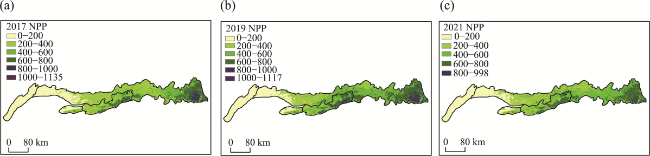
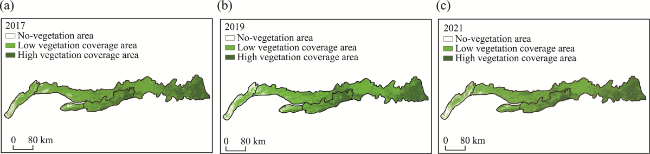
Medicinal plant diversity (MPD) is an indispensable part of global plant diversity, serving as the foundation for human survival by offering remedies and preventive measures against diseases. However, factors such as overexploitation, competition from invasive alien species, and climate change, threaten the habitats of medicinal plants, necessitating a comprehensive understanding of their spatial distribution and suitable habitats. We leveraged a decade of field survey data on medicinal plant distribution in the Yinshan Mountains, combined with spatial analysis, species distribution modeling, and the Carnegie Ames Stanford Approach (CASA) to explore the MPD spatial distribution and suitable habitats. Spatial analysis revealed that the central and eastern parts of Yinshan Mountains were the primary MPD hotspots, with no cold spots evident at various spatial scales. As the spatial scale decreased, previous non-significant regions transformed into hotspots, with instances where large-scale hotspots became insignificant. These findings offer valuable guidance for safeguarding and nurturing MPD across diverse spatial scales. In future climate change scenarios within the shared socioeconomic pathways (SSP), the habitat suitability for MPD in the Yinshan Mountains predominantly remains concentrated in the central and eastern regions. Notably, areas with high net primary productivity (NPP) values and abundant vegetation coverage align closely with MPD habitat suitability areas, potentially contributing to the region’s rich MPD.

Cite this article

ZHAO Zeyuan , BI Yaqiong , WEI Xinxin , CHEN Yuan , ZHANG Ru , GUO Jingxia , ZHANG Mingxu , ZHANG Xiaobo , LI Minhui . Spatial distribution changes and habitat conservation of medicinal plant diversity in the Yinshan Mountains (China) under climate change[J]. Journal of Geographical Sciences, 2025 , 35(7) : 1479 -1496 . DOI: 10.1007/s11442-025-2380-x

1 Introduction

Biodiversity is experiencing severe threats due to excessive exploitation of natural resources, rapid population growth, global climate change, and other factors. These threats have resulted in the continuous degradation of ecosystem functions, increased species vulnerability, and the gradual loss of genetic resources. Governments worldwide have responded by signing the international Convention on Biological Diversity (Chapin et al., 2000; Pawson et al., 2013). Thus, biodiversity protection has become a focus of ecological research. China has developed a corresponding strategic action plan, the China National Biodiversity Conservation Strategy and Action Plan. China has achieved significant progress in establishing a legal framework for biodiversity protection, conducting fundamental investigations, and advancing scientific research in this field.
Biodiversity is the basis for human survival and plays a key role in maintaining ecosystem stability. Additionally, biodiversity represents an intricate ecological system resulting from the interplay between organisms and their environment, encompassing various ecological processes. The component of biodiversity that examines the relationship between plants and their surroundings is referred to as plant diversity (Cao, 2015). The safeguarding of plant diversity forms a fundamental aspect and a key focus area of biodiversity conservation, with medicinal plant diversity (MPD) holding particular significance (Kong et al., 2003).
Medicinal plants have long been used to treat or prevent diseases and support human survival (Tali et al., 2019). China is one of the nations with the richest medicinal plant resources. As early as 1994, the “China Traditional Chinese Medicine Resource Series” summarized findings from the third national census of traditional Chinese medicine resources, listing a total of 11,020 medicinal plants in China (China Medicinal Materials Company, 1994). In recent years, rectifying missing data, updating existing information, and discovering new plant species have been attempted. Regrettably, due to overexploitation, the proliferation of invasive alien species, and the impacts of climate change, medicinal plant habitats have been decimated, and some plants have become extinct or under threat of extinction. Because the degradation of biodiversity remains a significant and enduring threat, prompting increased focus on sustainable development and ecosystem stability within the realms of ecology and geography research (Zhang et al., 2025).
In this study, we conducted a comprehensive examination of MPD in the Yinshan Mountains, drawing on a decade of field survey data, spatial analysis, a species distribution model (MaxEnt), and the Carnegie Ames Stanford Approach (CASA). First, we used a spatial analysis method to explore the spatial distribution of the MPD at different spatial scales in the Yinshan Mountains. Second, we used the MaxEnt model to construct a probability-distribution map to investigate the ecological suitability of the MPD in the Yinshan Mountains under current and anticipated future climatic conditions. Third, the CASA model was applied to estimate the area’s carbon sequestration capacity, shedding light on its environmental significance. Simultaneously, we also used normalized difference vegetation index (NDVI) data extracted from Sentinel-2-based remote sensing images from June to September in three years (2017, 2019, and 2021) to explore changing vegetation coverage trends at a high resolution. We aimed to (1) explore the spatial distribution of the MPD in the Yinshan Mountains, (2) predict suitable habitats of MPD under current and future climatic conditions, (3) evaluate the carbon sequestration capacity of the Yinshan Mountains, and (4) explore changes in vegetation coverage trends at high resolution. Our findings provide a reference to help local governments respond to international policies on sustainable development and diversity protection.

2 Materials and methods

2.1 Study area

The study area covered the entire region of the Yinshan Mountains. This important mountain range is located in northern China, from east to west, includes, Wolf Mountain, Wula Mountain, Serteng Mountain, Daqing Mountain. The mountain range is 1200 km long, 50-100 km wide from north to south, with an average altitude of 1800 m. The northern and southern slopes of the mountains are asymmetrical, with the northern slope dipping gently into the Inner Mongolia Plateau and the southern slope dropping to the Yellow River Hetao Plain with a drop of more than 1000 m. The Yinshan Mountains represent the boundary between the warm temperate and mid-temperate climate zones in Inner Mongolia, and the difference in the climates in the north and south separates the grassland from the desert steppe. The unique topography and climate change in the Yinshan Mountains have greatly enriched the plant species range and ensured the diversity of the region’s medicinal plant resources, forming an obvious uneven distribution pattern of the region’s medicinal plant resources.

2.2 Research data

2.2.1 Species data

The data of traditional Chinese medicine resources in Yinshan Mountains were obtained from the field survey from 2012 to 2022. The survey followed the “four principles”, namely, survey records, voucher specimens, actual photographs and evidence of medicinal use, to ensure the scientificity and accuracy of the results. We collected sampling data based on the survey route and sampling survey, combined with modern technologies such as GPS and GIS, and each sampling point represented the occurrence record of the species. Simultaneously, we performed operations such as eliminating duplicate data. The final remaining 10,301 points of data. Combined with the spatial analysis function and visual mapping function of ArcGIS, the distribution maps of sampling points were drawn (Figure 1).
Figure 1 Sampling points used to study medicinal plant distributions in the Yinshan Mountains

2.2.2 Image-data acquisition

The Sentinel-2 satellite was launched by the European Space Agency (ESA) for the EU Copernicus program to support global terrestrial services such as monitoring vegetation (Zhang et al., 2022b). To conduct this study, we acquired images covering the entire Yinshan Mountains from June to September in 2017, 2019, and 2021 from the Copernicus Open Access Center. Although some of the relevant data have been orthogonalized and geometrically corrected, further pre-processing, such as atmospheric corrections and resampling, and resampling of all bands to 10 m is required before use. Subsequently, these preprocessed images were synthesized into a cohesive dataset by using the layer stacking function within ENVI, ensuring their suitability for our research endeavors.

2.2.3 CASA model predicts NPP data acquisition

Our vegetation type data were from the National Cryosphere Desert Data Center. The NDVI data are derived from the MOD13A2 data from 2017, 2019, and 2021 of the National Aeronautics and Space Administration (NASA) at a resolution of 1 km. Average monthly temperature and total monthly precipitation were from the National Oceanic and Atmospheric Administration (NOAA) and the National Centers for Environmental Information (NCEI). We obtained total monthly solar-radiation data from the NASA Goddard Earth Sciences Data and Information Services Center, and we obtained the MOD17A3HGF product dataset from 2017, 2019, and 2021 from the Land Processes Distributed Active Archive Center (Wang et al., 2023).

2.3 Construction of spatial grid system

The Yinshan Mountains involved 40 counties and the area was large, and the field survey could not fully cover the entire scope of the 40 counties. Based on the grid technology, this study divided the Yinshan Mountains into 10 km×10 km, 20 km×20 km, 30 km×30 km, 40 km×40 km, 50 km×50 km, 60 km×60 km and different scales of a DEM data space grid system. The types of traditional Chinese medicine resources in each grid were summarized, counted, and used as a statistical basis for richness.

2.4 Global spatial autocorrelation analysis

Global Moran’s I analysis is a valuable tool for detecting spatial correlations based on observations and their respective spatial locations. This tool allows researchers to assess whether a given index exhibits spatial autocorrelation within the study area (Ebdon, 1985). Among them, Moran’s I is the most commonly used to measure spatial autocorrelation and is an important research metric for measuring the potential interdependence between observations of variables in the same region. The value range of Moran’s I is (-1, 1) (Mitchell, 2005). Z-values and P-values were used to test the applicability and significance of the index. In the process of spatial calculation, the spatial weight is normalized to prevent the Moran’s I index from exceeding [-1, 1] (Bivand and Wong, 2018). Moran’s I is calculated as follows:
I = n i = 1 n j = 1 n w i j x i x ¯ x j x ¯ i = 1 n j = 1 n w i j i = 1 n x i x ¯ 2      
where n is the total number of geographical units distributed in the study area, x is the attribute value of the observation variable, x ¯is the average value of the attribute value of the observation variable, and wij is the spatial weight.

2.5 Local Moran’s I analysis

Local Moran’s I serves as a breakdown of the global spatial autocorrelation index, enabling a finer assessment of dissimilarities between specific spatial regions and their neighboring areas. The size of the Local Moran’s Index provides a more intuitive measure for comparing differences in MPDs across districts (Bivand and Wong, 2018; Anselin, 1995). However, this method of analysis does not represent a specific geographic area at a significance level.
We analyzed the local spatial autocorrelation index using clustering and outlier analysis in spatial analysis methods and obtained five distinct outcomes: High-High Cluster (H-H), High-Low Outlier (H-L), Low-High Outlier (L-H), Low-Low Cluster (L-L), and Not Significant (Liu et al., 2018). These outcomes offer valuable insights into the spatial distribution patterns and significance levels of MPD throughout the study area, enhancing the understanding of its geographic variability.

2.6 Hotspot analysis

In spatial statistics, Hotspot analysis, also known as Getis-Ord Gi* analysis, primarily serves to detect spatial clusters of attribute elements with either high or low values. It helps identify whether each regional unit conforms to the spatial distribution pattern of high- or low-value clusters (Zhang et al., 2020). This analytical method calculates Gi* value statistics and corresponding P-values for each element within the dataset, enabling the identification of spatial clustering locations for high-value or low-value MPD. The principle of this analytical method holds that if an analytical element can become a hot area of statistical significance, it should exhibit a high value while being spatially surrounded by other elements with high values (Getis and Ord, 1992). The results are expressed at different levels of significance, namely 99% confidence, 95% confidence, 90% confidence, and no significance. If the value of Gi* is positive and significant, the region is rich in diversity of medicinal plant resources and is a high-value spatial aggregation area; if the value of Gi* is negative and significant, the region is scarce in diversity of medicinal plant resources and is a low-value spatial aggregation area.

2.7 Selection of environmental variables for MaxEnt modeling

Our aim is to not only predict the distribution of MPD under the current climate conditions but also to gain insights into how various socioeconomic development pathways might influence the future spatial distribution of MPD. To achieve our objectives, we incorporated a comprehensive set of data, including 19 bioclimatic variables and elevation data (Supplementary Table 1). This multifaceted approach allowed us to explore the potential shifts in MPD patterns and their correlations with different socioeconomic development scenarios in the future. Current and future climate data were downloaded from the Worldclim database at a resolution of 2.5 arcmins (Zhang and Wang, 2023). Future climate data were selected from four climate scenarios (SSP126, SSP245, SSP370, and SSP585) in the BCC-CSM2-MR model for the 2030s (2021-2040) and the 2070s (2061-2080), which represent future carbon emissions from low to high, respectively (Huang et al., 2022a; Zhang et al., 2022a). Elevation data were from SRTM elevation data. Notably, because there was no information on future projected elevations, we assumed that there was no change in current or future elevations. Because of the large number of species in this study, we used the most widely accepted data, namely, all of the aforementioned data were used for projections of MPD distributions under current and future climatic conditions, respectively.
Supplementary Table 1 The environment variables information
Abbreviation Environment variables Unit
Bio_1 Annual mean temperature
Bio_2 Mean diurnal range (Mean of monthly (max temp-min temp))
Bio_3 Isothermality (Bio_2/Bio_7) (×100) -
Bio_4 Temperature seasonality (standard deviation × 100) -
Bio_5 Max temperature of warmest month
Bio_6 Min temperature of coldest month
Bio_7 Temperature annual range (Bio_5-Bio_6)
Bio_8 Mean temperature of wettest quarter
Bio_9 Mean temperature of driest quarter
Bio_10 Mean temperature of warmest quarter
Bio_11 Mean temperature of coldest quarter
Bio_12 Annual precipitation mm
Bio_13 Precipitation of wettest month mm
Bio_14 Precipitation of driest month mm
Bio_15 Precipitation seasonality (Coefficient of Variation) -
Bio_16 Precipitation of wettest quarter mm
Bio_17 Precipitation of driest quarter mm
Bio_18 Precipitation of warmest quarter mm
Bio_19 Precipitation of coldest quarter mm
Elv Elevation m

2.8 Parameter setting of MaxEnt

The MaxEnt model, a widely recognized tool for assessing species distributions, has been used in existing research. However, because of the extensive dataset gathered for this study and the potential risk of results being influenced by complex data deviations, a rigorous screening process was undertaken. This meticulous approach aimed to identify the most representative medicinal plant species distributions, focusing on three distinct categories (Supplementary Table 2). First, we considered the “Widely Distributed medicinal plants in the Yinshan Mountains,” which included species found at many sampling points, specifically those exceeding 60 individual species of medicinal plants. Second, the “Rare medicinal plants in the Yinshan Mountains” category encompassed species with a more limited presence, typically falling within the range of 10 to 30 sampling sites for a single species. Last, we examined the “Endangered medicinal plants in Yinshan Mountains,” comprising plants listed in the Endangered Plant Protection List due to their critical status.
Supplementary Table 2 List of plants from three sources in MaxEnt analysis
Species Source Species Source Species Source
Agrimonia
pilosa
more than 60 points Euphorbia
esula
10-30 points Saussurea
japonica
10-30 points
Artemisia
scoparia
more than 60 points Fagopyrum esculentum 10-30 points Saussurea
nivea
10-30 points
Artemisia
stechmanniana
more than 60 points Fagopyrum tataricum 10-30 points Scabiosa
comosa
10-30 points
Bistorta
officinalis
more than 60 points Fallopia
convolvulus
10-30 points Schizonepeta
multifida
10-30 points
Bupleurum chinense more than 60 points Filifolium
sibiricum
10-30 points Schizonepeta
tenuifolia
10-30 points
Bupleurum
scorzonerifolium
more than 60 points Gentiana
macrophylla
10-30 points Scorzonera
sinensis
10-30 points
Delphinium grandiflorum more than 60 points Geranium
wilfordii
10-30 points Scutellaria
scordifolia
10-30 points
Dianthus
chinensis
more than 60 points Geum aleppicum 10-30 points Scutellaria
viscidula
10-30 points
Echinops sphaerocephalus more than 60 points Glycyrrhiza uralensis 10-30 points Silene aprica 10-30 points
Gentiana
dahurica
more than 60 points Grubovia
dasyphylla
10-30 points Silene repens 10-30 points
Medicago
ruthenica
more than 60 points Halenia
corniculata
10-30 points Sonchus
wightianus
10-30 points
Polygala
tenuifolia
more than 60 points Haplophyllum dauricum 10-30 points Sphallerocarpus
gracilis
10-30 points
Potentilla
chinensis
more than 60 points Hedysarum brachypterum 10-30 points Spiraea
pubescens
10-30 points
Sanguisorba officinalis more than 60 points Hibiscus trionum 10-30 points Spiraea
salicifolia
10-30 points
Saposhnikovia divaricata more than 60 points Hippophae rhamnoides 10-30 points Stellaria
dichotoma
10-30 points
Scutellaria
baicalensis
more than 60 points Hylotelephium malacophyllum 10-30 points Takhtajaniantha
austriaca
10-30 points
Stellera
chamaejasme
more than 60 points Hyoscyamus niger 10-30 points Teloxys aristata 10-30 points
Taraxacum
mongolicum
more than 60 points Imperata
cylindrica
10-30 points Thalictrum
aquilegiifolium
10-30 points
Thalictrum
petaloideum
more than 60 points Incarvillea sinensis 10-30 points Thalictrum
squarrosum
10-30 points
Ulmus pumila more than 60 points Inula britannica 10-30 points Thermopsis
lanceolata
10-30 points
Aconitum
barbatum
10-30 points Inula japonica 10-30 points Tournefortia
sibirica
10-30 points
Aconitum
kusnezoffii
10-30 points Iris dichotoma 10-30 points Tribulus
terrestris
10-30 points
Adenophora capillaris 10-30 points Iris lactea 10-30 points Trifolium
lupinaster
10-30 points
Adenophora polyantha 10-30 points Ixeris chinensis 10-30 points Triglochin
palustris
10-30 points
Agropyron
cristatum
10-30 points Ixeris
polycephala
10-30 points Trollius
chinensis
10-30 points
Allium
condensatum
10-30 points Klasea
centauroides
10-30 points Ulmus
macrocarpa
10-30 points
Allium
mongolicum
10-30 points Knorringia
sibirica
10-30 points Urtica
cannabina
10-30 points
Allium
senescens
10-30 points Lactuca tatarica 10-30 points Valeriana
officinalis
10-30 points
Allium
tenuissimum
10-30 points Lagopsis supina 10-30 points Veronica
anagallis-aquatica
10-30 points
Amaranthus
retroflexus
10-30 points Lappula
myosotis
10-30 points Vicia cracca 10-30 points
Amethystea
caerulea
10-30 points Larix gmelinii 10-30 points Viola variegata 10-30 points
Argentina
anserina
10-30 points Leibnitzia
anandria
10-30 points Xanthium
strumarium
10-30 points
Artemisia annua 10-30 points Leonurus
japonicus
10-30 points Actaea dahurica List of Key Protected Wild Plants in Inner Mongolia Autonomous Region
Artemisia
caruifolia
10-30 points Leonurus
sibiricus
10-30 points Adenophora
gmelinii
List of Key Protected Wild Plants in Inner Mongolia Autonomous Region
Artemisia
eriopoda
10-30 points Leptopyrum fumarioides 10-30 points Adenophora
stenanthina
List of Key Protected Wild Plants in Inner Mongolia Autonomous Region
Artemisia
frigida
10-30 points Lespedeza
cuneata
10-30 points Adenophora
tetraphylla
List of Key Protected Wild Plants in Inner Mongolia Autonomous Region
Artemisia
gmelinii
10-30 points Lespedeza
davurica
10-30 points Agropyron
mongolicum
List of National Key Protected Wild Plants in China
Artemisia
mongolica
10-30 points Lespedeza juncea 10-30 points Anemarrhena
asphodeloides
List of Key Protected Wild Plants in Inner Mongolia Autonomous Region
Artemisia
sacrorum
10-30 points Lespedeza
potaninii
10-30 points Anemone
sylvestris
List of Key Protected Wild Plants in Inner Mongolia Autonomous Region
Artemisia
tanacetifolia
10-30 points Lilium pumilum 10-30 points Astragalus
membranaceus
List of Key Protected Wild Plants in Inner Mongolia Autonomous Region
Asparagus dauricus 10-30 points Limonium
bicolor
10-30 points Atraphaxis bracteata List of Key Protected Wild Plants in Inner Mongolia Autonomous Region
Aster hispidus 10-30 points Linaria vulgaris 10-30 points Berberis caroli List of Key Protected Wild Plants in Inner Mongolia Autonomous Region
Aster tataricus 10-30 points Linum
stelleroides
10-30 points Bistorta
officinalis
List of Key Protected Wild Plants in Inner Mongolia Autonomous Region
Astragalus chinensis 10-30 points Linum
usitatissimum
10-30 points Bupleurum
sibiricum
List of Key Protected Wild Plants in Inner Mongolia Autonomous Region
Astragalus
dahuricus
10-30 points Malva
verticillata
10-30 points Campanula
punctata
List of Key Protected Wild Plants in Inner Mongolia Autonomous Region
Astragalus
scaberrimus
10-30 points Medicago
lupulina
10-30 points Caryopteris
mongholica
List of Key Protected Wild Plants in Inner Mongolia Autonomous Region
Atractylodes chinensis 10-30 points Medicago sativa 10-30 points Clematis
fruticosa
List of Key Protected Wild Plants in Inner Mongolia Autonomous Region
Bassia
scoparia
10-30 points Melilotus albus 10-30 points Cnidium
monnieri
List of Key Protected Wild Plants in Inner Mongolia Autonomous Region
Belamcanda chinensis 10-30 points Melilotus
suaveolens
10-30 points Cornus
officinalis
Wild herbal resources protection management regulations
Betula
platyphylla
10-30 points Mentha
canadensis
10-30 points Dasiphora
glabra
List of Key Protected Wild Plants in Inner Mongolia Autonomous Region
Bidens
parviflora
10-30 points Neopallasia pectinata 10-30 points Eleutherococcus
senticosus
Wild herbal resources protection management regulations
Bidens pilosa 10-30 points Odontites
vulgaris
10-30 points Elsholtzia ciliata List of Key Protected Wild Plants in Inner Mongolia Autonomous Region
Bothriospermum kusnetzowii 10-30 points Olgaea
lomonossowii
10-30 points Ephedra
equisetina
List of Key Protected Wild Plants in Inner Mongolia Autonomous Region
Bupleurum mithii 10-30 points Oreomecon nudicaulis 10-30 points Ephedra
monosperma
List of Key Protected Wild Plants in Inner Mongolia Autonomous Region
Calamagrostis epigeios 10-30 points Orobanche
pycnostachya
10-30 points Ephedra sinica List of Key Protected Wild Plants in Inner Mongolia Autonomous Region
Callistephus chinensis 10-30 points Orostachys
fimbriata
10-30 points Equisetum
arvense
List of Key Protected Wild Plants in Inner Mongolia Autonomous Region
Cannabis sativa 10-30 points Ostryopsis
davidiana
10-30 points Eucommia
ulmoides
Wild herbal resources protection management regulations
Caragana
microphylla
10-30 points Oxybasis glauca 10-30 points Forsythia
suspensa
Wild herbal resources protection management regulations
Caragana sinica 10-30 points Oxytropis
coerulea
10-30 points Gentiana
macrophylla
List of Key Protected Wild Plants in Inner Mongolia Autonomous Region, Wild herbal resources protection management regulations
Carduus crispus 10-30 points Paeonia
lactiflora
10-30 points Ginkgo biloba List of National Key Protected Wild Plants in China
Carduus nutans 10-30 points Parthenocissus tricuspidata 10-30 points Glycyrrhiza
uralensis
List of Key Protected Wild Plants in Inner Mongolia Autonomous Region, Wild herbal resources protection management regulations
Carum
buriaticum
10-30 points Patrinia
rupestris
10-30 points Haplophyllum
tragacanthoides
List of Key Protected Wild Plants in Inner Mongolia Autonomous Region
Caryopteris mongholica 10-30 points Patrinia
scabiosifolia
10-30 points Hemerocallis
minor
List of Key Protected Wild Plants in Inner Mongolia Autonomous Region
Catolobus
pendulus
10-30 points Pedicularis resupinata 10-30 points Leonurus
sibiricus
List of Key Protected Wild Plants in Inner Mongolia Autonomous Region
Chelidonium majus 10-30 points Pedicularis striata 10-30 points Lilium pumilum List of Key Protected Wild Plants in Inner Mongolia Autonomous Region
Chenopodium ficifolium 10-30 points Persicaria
lapathifolia
10-30 points Limonium
bicolor
List of Key Protected Wild Plants in Inner Mongolia Autonomous Region
Chloris virgata 10-30 points Phedimus
aizoon
10-30 points Malaxis
monophyllos
List of Key Protected Wild Plants in Inner Mongolia Autonomous Region
Chrysanthemum chanetii 10-30 points Phlomoides umbrosa 10-30 points Mentha
canadensis
List of Key Protected Wild Plants in Inner Mongolia Autonomous Region
Cirsium arvense 10-30 points Phragmites australis 10-30 points Olgaea
lomonossowii
List of Key Protected Wild Plants in Inner Mongolia Autonomous Region
Clematis
brevicaudata
10-30 points Polygala
sibirica
10-30 points Orobanche
pycnostachya
List of Key Protected Wild Plants in Inner Mongolia Autonomous Region
Clematis
hexapetala
10-30 points Polygonatum odoratum 10-30 points Paeonia
lactiflora
List of Key Protected Wild Plants in Inner Mongolia Autonomous Region
Clematis
intricata
10-30 points Polygonatum sibiricum 10-30 points Phedimus
aizoon
List of Key Protected Wild Plants in Inner Mongolia Autonomous Region
Convolvulus ammannii 10-30 points Populus
simonii
10-30 points Platycodon
grandiflorus
List of Key Protected Wild Plants in Inner Mongolia Autonomous Region
Convolvulus tragacanthoides 10-30 points Portulaca
oleracea
10-30 points Polygala
sibirica
List of Key Protected Wild Plants in Inner Mongolia Autonomous Region
Cuscuta
chinensis
10-30 points Potentilla
betonicifolia
10-30 points Polygala
tenuifolia
List of Key Protected Wild Plants in Inner Mongolia Autonomous Region, Wild herbal resources protection management regulations
Cymbaria
dahurica
10-30 points Potentilla
bifurca
10-30 points Polygonatum
odoratum
List of Key Protected Wild Plants in Inner Mongolia Autonomous Region
Cynanchum chinense 10-30 points Potentilla
multicaulis
10-30 points Polygonatum
sibiricum
List of Key Protected Wild Plants in Inner Mongolia Autonomous Region
Dasiphora
fruticosa
10-30 points Potentilla
tanacetifolia
10-30 points Pulsatilla
chinensis
List of Key Protected Wild Plants in Inner Mongolia Autonomous Region
Descurainia sophia 10-30 points Prunus
armeniaca
10-30 points Ranunculus
japonicus
the Convention on International Trade in Endangered Species of Wild Fauna and Flora
Dianthus
superbus
10-30 points Prunus sibirica 10-30 points Rheum
franzenbachii
List of Key Protected Wild Plants in Inner Mongolia Autonomous Region
Diarthron
linifolium
10-30 points Prunus triloba 10-30 points Saposhnikovia
divaricata
List of Key Protected Wild Plants in Inner Mongolia Autonomous Region, Wild herbal resources protection management regulations
Dontostemon dentatus 10-30 points Pseudolysimachion
linariifolium
10-30 points Schisandra
chinensis
Wild herbal resources protection management regulations
Dracocephalum rupestre 10-30 points Pulsatilla chinensis 10-30 points Scutellaria
baicalensis
List of Key Protected Wild Plants in Inner Mongolia Autonomous Region, Wild herbal resources protection management regulations
Echinochloa crusgalli 10-30 points Pulsatilla
turczaninovii
10-30 points Sophora
alopecuroides
List of Key Protected Wild Plants in Inner Mongolia Autonomous Region
Elsholtzia
ciliata
10-30 points Rehmannia
glutinosa
10-30 points Sophora
flavescens
List of Key Protected Wild Plants in Inner Mongolia Autonomous Region
Elymus
dahuricus
10-30 points Rosa xanthina 10-30 points Stellaria
dichotoma
List of Key Protected Wild Plants in Inner Mongolia Autonomous Region
Equisetum
arvense
10-30 points Rubia cordifolia 10-30 points Trollius
chinensis
List of Key Protected Wild Plants in Inner Mongolia Autonomous Region
Equisetum
ramosissimum
10-30 points Rubus saxatilis 10-30 points Vincetoxicum
pycnostelma
List of Key Protected Wild Plants in Inner Mongolia Autonomous Region
Eremogone juncea 10-30 points Salsola
komarovii
10-30 points
Eritrichium rupestre 10-30 points Saussurea
amara
10-30 points
The main objective of this study was to reveal the spatial distribution characteristics of MPD. Consequently, we did not to employ the “Jackknife” method, a commonly used in general MaxEnt model studies. This method is typically used to assess the impact of various ecological factors on the distribution of individual species or to create response curves for quantifying the relationship between ecological factors and the probability of individual species distribution. Instead, we directed our efforts toward the overarching goal of understanding MPD’s spatial distribution patterns. MaxEnt is set as follows: the maximum number of iterations of the model is 105, the convergence threshold is 0.0005, and “Crossvalidate” is used as the model repeated run type, running a total of 10 times (Kapuka et al., 2022). To ensure the precision of our model predictions, we employed the area under the curve (AUC) as an evaluation metric. In general, an AUC value exceeding 0.75 signifies robust model predictions, indicating a high degree of reliability in the results (Parichehreh et al., 2020). Consequently, we scrutinized the predicted outcomes for each species to confirm that the AUC values surpassed the 0.75 threshold. Logistic regression yielded outputs ranging from 0 to 1, aligning closely with the probability of species distribution, which aligns with our research objectives. Thus, we opted for Logistic regression as the output method while retaining default settings for the remaining parameters. Subsequently, we conducted calculations for each species in the ASC format using ArcGIS 10.8, followed by the conversion of results to the tiff format. These individual species maps were then superimposed (Zhang et al., 2022a). Last, to ensure consistency, the superimposed layers underwent a normalization process.

2.9 Construction of CASA model

NPP is the total amount of organic matter accumulated per unit of time and per unit of area by a plant during the primary production stage (Wang et al., 2019; Li et al., 2023). The CASA model is one of the most commonly used models for NPP estimation, which calculates NPP mainly from the absorbed light use efficiency (ε) and absorbed photosynthetically active radiation (APAR) by vegetation (Huang et al., 2022b). The calculation expression is as follows:
N P P x , t = A P A R x , t × ε x , t
where APAR(x,t) is the effective photosynthetic radiation that pixel x absorbed during month t (MJ·m-2 month-1), and ε(x,t) is the pixel x’s actual light utilization efficiency during month t (gC·MJ−1) (Qiu et al., 2023). The expression of APAR and ε are as follows:
A P A R x , t = 0.5 × S O L x , t × F P A R x , t
ε x , t = T ε 1 x , t × T ε 2 x , t × W ε x , t × ε max
The NPP can be validated using the measured-value validation method and the relative validation method (Wang et al., 2023). However, due to the lack of measurement data, an indirect validation method was used. The indirect validation involved a comparison between the NPP inversion results generated by the CASA model and the NPP data from MOD17A3HGF. Specifically, we randomly selected 100 points within the study area and extracted the NPP values for 2017, 2019, and 2021 from both the MOD17A3HGF dataset and the NPP estimates provided by the CASA model at these selected points. The accuracy of the CASA model was measured using the coefficient of determination (R2), as shown in Eq. (5) (Fang et al., 2021).
R 2 = 1 i = 1 n y i y d i 2 i = 1 n y i y a 2
where n represents the number of variables; yi is the NPP value estimated by the CASA model; ydi is the MOD17A3 NPP value; ya is the average of the MOD17A3 NPP values.

2.10 Vegetation index extraction

NDVI is commonly used to detect vegetation growth and vegetation cover (Zhang et al., 2022b; Shi et al., 2024; Zhou et al., 2025). Because the growth period for most wild medicinal plants is between June and September, we aimed to deepen the understanding of vegetation coverage during this critical phase by extracting NDVI data for the Yinshan Mountains from June to September in 2017, 2019, and 2021. This extraction was performed using the BandMath tool available in ENVI 5.3. In our analysis, NDVI values below 0.1 signified barren areas, typically covered by rocks, sand, or snow, with minimal surface vegetation. To reduce the influence of NDVI variations on the formulation of regression equations for exposed surfaces, we uniformly categorized NDVI ranges from [-1.0, 0.1] as areas devoid of vegetation coverage, (0.1, 0.5] as areas with low vegetation coverage, and (0.5, 1] as areas characterized by high vegetation coverage (Wei et al., 2023).

3 Results

3.1 Global autocorrelation analysis at different spatial scales

We calculated the global autocorrelation (Moran’s I) and its standardized statistic Z for the study area across different grid sizes, providing insights into the richness of these valuable resources in the region. At different grid scales, the species richness of traditional Chinese medicine resources in the Yinshan Mountains was spatially positively correlated and significantly different (Supplementary Table 3). When compared, it was found that the species richness of traditional Chinese medicine resources showed a high spatial correlation at the grid scale of 60 km × 60 km.
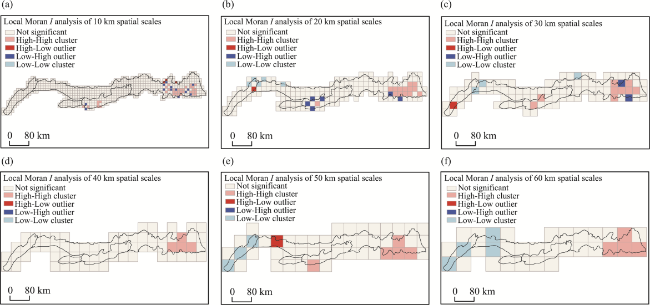
Supplementary Table 3 Results of spatial autocorrelation analysis at different spatial scales
Grid size Moran’s I Z P
10 0.324690 11.288268 0.000000
20 0.360309 6.773821 0.000000
30 0.480294 6.258639 0.000000
40 0.416629 4.544818 0.000005
50 0.427541 4.033750 0.000055
60 0.535239 4.098584 0.000042

3.2 Results of local Moran’s I analysis

There were differences in the spatial distribution of MPDs at different spatial scales (Figure 2). At 60 km×60 km, 50 km×50 km, and 40 km×40 km on a large spatial scale, the H-H aggregation areas were concentrated in the eastern region of Yinshan Mountains. At 30 km×30 km, 20 km×20 km, and 10 km×10 km on a spatial scale, the H-H aggregation area also appeared in the central region of Yinshan Mountains. With the decrease of spatial scale, the H-L and L-H outliers had scattered distribution on spatial scale and showed an increasing trend, which means that different spatial scales can indicate different aggregation degree of MPD in the same region. This finding has important guiding significance for attaining a refined understanding of the degree of aggregation of MPD resources.
Figure 2 Local Moran’s I analysis of the Yinshan Mountains at different scales: (a) 10 km; (b) 20 km; (c) 30 km; (d) 40 km; (e) 50 km; (f) 60 km

3.3 Results of hotspot analysis

Hotspot analysis can display spatial MPD distributions in different regions at the level of significance. Our hotspot analysis results for the MPD at different spatial scales were similar to those obtained using local Moran’s I analysis (Figure 3). At different spatial scales, no cold spot distribution was found in the Yinshan Mountains, indicating that the area has a rich diversity in medicinal plants. However, it is important to highlight that while cold spot aggregation areas are absent across these different spatial scales, there are instances where regions transition from being hotspot aggregation areas to yielding insignificant results.
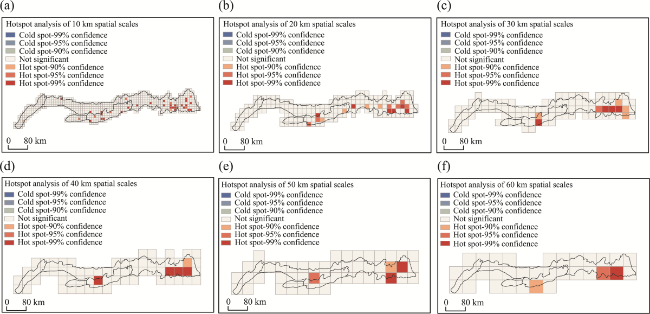
Figure 3 Hotspot analysis of the Yinshan Mountains at different scales: (a) 10 km; (b) 20 km; (c) 30 km; (d) 40 km; (e) 50 km; (f) 60 km

3.4 Habitat suitability for MPDs

The results of MPD analysis were categorized into four distinct groups by using ArcGIS 10.8: unsuitable (0-0.25), low suitability (0.25-0.5), moderate suitability (0.5-0.75), and high suitability (0.75-1). The results are shown in Figure 4. In the case of widely distributed medicinal plants, high and moderately suitable areas were predominantly situated in the eastern region, and low suitability zones were primarily concentrated in specific areas within the central and eastern regions. Notably, there were unsuitable areas between the central and eastern regions. For rare medicinal plants, high and moderately suitable regions also tended to cluster in the eastern part of the area, with low suitability areas dispersed in select locations across the central and eastern regions. Endangered medicinal plants exhibited a pattern: high suitability areas were primarily located in the eastern region, and moderate and low suitability regions were scattered across specific zones in the central and eastern areas. In summary, highly and moderately suitable regions for all three categories were predominantly in the eastern section of the Yinshan Mountains, and low suitability areas were concentrated in the central and eastern regions. The Yinshan Mountains form a boundary between monsoon and non-monsoon regions, and some regions in the western and central Yinshan Mountains are non-monsoon regions. Despite the presence of the Yellow River in the region, it still faces challenges due to insufficient precipitation and other factors conducive to plant growth. Consequently, the overall suitability for local medicinal plant distribution is reduced, leading to a lack of diversity in medicinal plant species within the area.
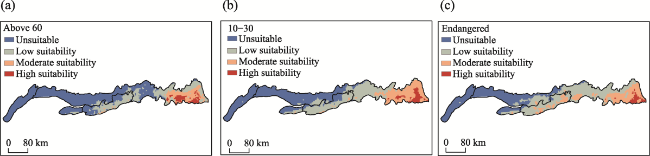
Figure 4 Habitat suitability distribution of MPD in the Yinshan Mountains: (a) Widely distributed medicinal plants; (b) Rare distribution of medicinal plants; (c) Endangered medicinal plants
Our MPD analysis results under future climatic conditions are shown in Figure 5 (Supplementary Table 4). The purple, blue, and orange boxes represent the diversity of widely distributed, rare, and endangered medicinal plants, respectively.
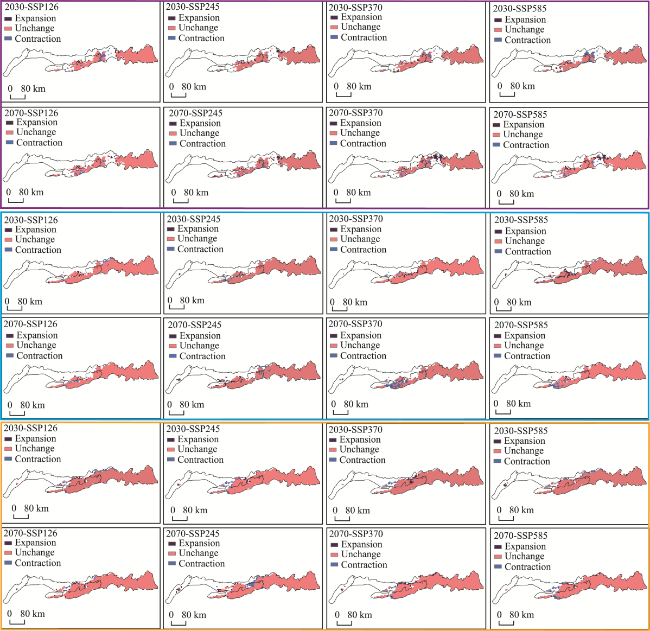
Figure 5 Habitat suitability distribution of MPD in the Yinshan Mountains under future climate (Purple represents expansion, pink represents unchanged, and blue represents contraction.)
Supplementary Table 4 Potential distribution changes under future climatic conditions (km2)
Species Period Scenario Range expansion No change Range contraction
Widely distributed
medicinal plants
(Above 60)
2021-2040 SSP126 754.89 18760.29 1062.43
SSP245 866.72 19235.59 587.13
SSP370 698.97 18983.96 838.76
SSP585 698.97 17949.49 1873.23
2061-2080 SSP126 615.09 18872.12 950.60
SSP245 1090.39 18592.54 1230.18
SSP370 1845.27 18592.54 1230.18
SSP585 1677.52 18956.00 866.72
Rare distribution of
medicinal plants
(10-30)
2021-2040 SSP126 335.50 26225.26 810.80
SSP245 279.59 26057.51 978.55
SSP370 671.01 26504.85 531.22
SSP585 1369.98 26700.56 335.50
2061-2080 SSP126 195.71 26281.18 754.88
SSP245 1090.39 26113.43 922.64
SSP370 111.83 24379.99 2656.08
SSP585 335.50 25694.05 1342.02
Endangered medicinal
plants (Endangered)
2021-2040 SSP126 698.97 30083.56 1118.35
SSP245 726.93 30111.52 1090.39
SSP370 810.80 30307.23 894.68
SSP585 643.05 30251.32 950.60
2061-2080 SSP126 726.93 30754.57 447.34
SSP245 950.60 29636.22 1565.69
SSP370 1034.47 30335.19 866.72
SSP585 726.93 29859.89 1342.02
The first is the widely distributed medicinal plants. Compared with the current habitat, in the 2030s, the area of suitable habitat under the SSP126, SSP245, SSP370, and SSP585 development pathways increased in the order of 754.89 km2, 866.72 km2, 698.97 km2, 698.97 km2, and decreased in the order of 1062.43 km2, 587.13 km2, 838.76 km2, and 1873.23 km2, respectively. These data suggest that the SSP245 development pathway is the development situation with the highest suitable area for MPD. By the 2070s, the area of suitable habitat under the SSP126, SSP245, SSP370, and SSP585 development pathways increased in the order of 615.09 km2, 1090.39 km2, 1845.27 km2, 1677.52 km2, and decreased in the order of 950.60 km2, 1230.18 km2, 1230.18 km2, and 866.72 km2, respectively. These data suggest that the SSP585 development pathway is the development situation with the highest suitable area for MPD.
The second is rare medicinal plants. Compared with the current habitat, in the 2030s, the area of suitable habitat under the SSP126, SSP245, SSP370, and SSP585 development pathways increased in the order of 335.50 km2, 279.59 km2, 671.01 km2, 1369.98 km2, and decreased in the order of 810.80 km2, 978.55 km2, 531.22 km2, and 335.50 km2, respectively. These data suggest that the SSP585 development pathway is the development situation with the highest suitable area for MPD. By the 2070s, the area of suitable habitat under the SSP126, SSP245, SSP370, and SSP585 development pathways increased in the order of 195.71 km2, 1090.39 km2, 111.83 km2, 335.50 km2, and decreased in the order of 754.88 km2, 922.64 km2, 2656.08 km2, and 1342.02 km2, respectively. These data suggest that the SSP245 development pathway is the development situation with the highest suitable area for MPD.
Finally, the distribution trend of endangered medicinal plant species. Compared with the current habitat, in the 2030s, the area of suitable habitat under the SSP126, SSP245, SSP370, and SSP585 development pathways increased in the order of 698.97 km2, 726.93 km2, 810.80 km2, 643.05 km2, and decreased in the order of 1118.35 km2, 1090.39 km2, 894.68 km2, and 950.60 km2, respectively. These data suggest that the SSP370 development pathway is the development situation with the highest suitable area for MPD. By the 2070s, the area of suitable habitat under the SSP126, SSP245, SSP370, and SSP585 development pathways increased in the order of 726.93 km2, 950.60 km2, 1034.47 km2, 726.93 km2, and decreased in the order of 447.34 km2, 1565.69 km2, 866.72 km2, and 1342.02 km2, respectively. These data suggest that the SSP126 development pathway is the development situation with the highest suitable area for MPD.

3.5 Exploring the relationship between NPP and MPD based on the CASA model

The average vegetation NPP in Yinshan Mountains in 2017, 2019 and 2021 estimated by the CASA model showed a fluctuating trend. Specifically, in 2017, the average vegetation NPP was 362.47 g CM-2·a-1, while in 2019, it increased to 428.99 g CM-2·a-1, and in 2021, it decreased slightly to 384.72 g CM-2·a-1. To further analyze these trends, we divided the vegetation NPP into three categories: low value areas (0-200 g CM-2·a-1), median value areas (200-600 g CM-2·a-1), and high value areas (600 g CM-2·a-1 or above), as depicted in Figure 6. The low-value areas in Yinshan Mountains were mainly distributed in the western region; the median-value areas, mainly in the central and eastern regions; and the high-value areas, mainly in some areas of the central and eastern regions. These findings are similar to the MPD spatial distribution characteristics. This suggested that regions with high carbon sequestration potential were more conducive to the growth of medicinal plants, potentially contributing to the rich diversity of medicinal plant species in these areas. Despite the absence of measured NPP data, this study conducted a comparison between NPP values obtained from MODIS NPP products and those derived from the CASA model. The results revealed a correlation coefficient (R2) of 0.8935 (Figure 7). These findings indicated a strong correlation between the NPP estimations produced by the CASA model and the results from the MOD17A3HGF dataset. Consequently, the NPP estimations derived from the CASA model in this study exhibit high accuracy and are suitable for NPP-related research within the Yinshan Mountains.
Figure 6 NPP values in the Yinshan Mountains: (a) 2017; (b) 2019; (c) 2021
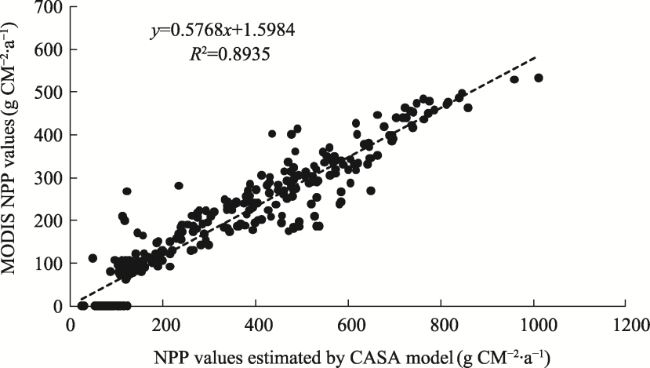
Figure 7 Correlation between MODIS NPP values and NPP values estimated by the CASA model

3.6 Research on NDVI and MPD

Using ArcGIS, we reclassified the extracted NDVI into three distinct categories: non-vegetation coverage areas, low vegetation coverage areas, and high vegetation coverage areas (Figure 8). As shown in Figure 8, high vegetation coverage areas are predominantly concentrated in the central and eastern regions of Yinshan Mountains, while low vegetation coverage areas and non-vegetation coverage areas are primarily situated in the western region of Yinshan Mountains. This distribution pattern closely resembles the hotspot areas and NPP high-value area of MPD in the Yinshan Mountains. It suggests that areas rich in vegetation have a heightened capacity for ecosystem carbon sequestration, creating favorable conditions for the survival of most medicinal plants. This, in turn, likely plays a pivotal role in shaping the diversity of medicinal plant species. By comparing vegetation coverage in 2017, 2019, and 2021, notable trends emerge. Vegetation coverage in the western region of the Yinshan Mountains exhibited a consistent decline from 2017 to 2021, and the central and eastern regions have generally maintained relative stability. However, some areas transitioned from high vegetation coverage to low vegetation coverage. As a result, it becomes imperative to bolster conservation efforts in the central and eastern regions while simultaneously focusing on initiatives to improve the ecological health of the western region in the future.
Figure 8 NDVI values in the Yinshan Mountains: (a) 2017; (b) 2019; (c) 2021

4 Discussion

4.1 MPD protection and sustainable development

Medicinal plants play a crucial role in treating various diseases worldwide, particularly in developing countries where they are integral to traditional medicine and healthcare (Romeiras et al., 2023). However, the increasing global population growth and the continual expansion of residential areas have led to increased human interference in natural ecosystems, resulting in severe ecological damage. Human activities have emerged as a primary driver of accelerated biodiversity loss on a global scale. Despite the abundant diversity of medicinal plants in China, the expansion of the human population and ecological degradation pose serious threats to these valuable wild resources. The establishment of nature reserves represents a pragmatic and effective approach to safeguarding medicinal plant resources, especially those classified as endangered species (Zhang and Gong, 2016). In this study, we employed spatial analysis methods to investigate species richness and MPD in the Yinshan Mountains across varying spatial scales. The findings underscore the importance of multi-scale analysis in providing comprehensive assessments of regional diversity and offering visual guidance for diversity reserve planning.
In September 2015, the United Nations Summit on Sustainable Development formally endorsed the “2030 Agenda for Sustainable Development,” outlining global sustainable development goals (Zhang et al., 2022c). These goals encompass three vital dimensions, namely, society, economy, and environment, and include specific biodiversity-related targets. Additionally, with the rapid global expansion of the Chinese medicine market, the demand for Chinese medicine products is expected to surge in the near future (Wang et al., 2022). Therefore, implementing measures that ensure the continued production of medicinal plants to maintain their availability is necessary (Fajinmi et al., 2023). This study not only examined the spatial distribution patterns of medicinal plants in the Yinshan Mountains and their distribution changes under climate change scenarios but also provides a foundational research framework for advancing biodiversity goals and the sustainable development of MPD in line with future development objectives.

4.2 Species distribution model to study the development direction of MPD

Species distribution models are primarily constructed based on occurrence records and environmental variables, providing probabilistic estimations of suitable habitats for species (Wen et al., 2021; Guo et al., 2024). Species distribution modeling relies on various statistical techniques, of which MaxEnt is currently the most widely used model (Kapuka et al., 2022; Dong et al., 2023). Research has demonstrated that the MaxEnt model offers stability, speed, and accuracy superior to that of other models and can yield better predictive results than other models when species distribution data is scarce (Shen et al., 2023). While species distribution models have proven invaluable in predicting future extinction risks and informing policy decisions, the choice of Global Circulation Models (GCMs) and different scenarios for gas emissions can introduce uncertainties in future distribution predictions (Song et al., 2023). Consequently, integrated models that consider these factors can enhance the accuracy of species distribution predictions, representing a promising direction for diversity model research.

4.3 Improvement of CASA model

As ecological concerns grow increasingly prominent, there is a heightened focus on the carbon sequestration capacity of vegetation. China has established relevant policies with ambitious goals, aiming to achieve a carbon peak by 2030 and carbon neutrality by 2060. NPP assumes a central role in the terrestrial carbon cycle and serves as a sensitive indicator of ecosystem performance, locally and globally (Bao et al., 2016). NPP quantifies the accumulation of aboveground and belowground organic matter within vegetation over a specific period, typically one year, offering insights into ecosystem productivity capacity (Liu et al., 2017). Consequently, accurate NPP estimation becomes pivotal. In this study, we employed MOD13A2 imagery (1 km) to predict NPP values for the Yinshan Mountains over the past three years (2017, 2019, 2021) using the CASA model. A comparison of the CASA estimates with MOD17A3HGF data at randomly selected sample points revealed a high degree of correlation. This suggests the reliability of the experiment’s results, which can serve as a foundational framework for informing policy decisions and promoting the sustainable utilization of natural resources in the Yinshan Mountains. Although the absence of measured NPP data precluded direct model comparisons in this study, future data collection efforts will be essential for refining and optimizing the CASA model. Additionally, as satellite sensor technology continues to advance, such as with MODIS, Landsat, RapidEye, and Sentinel-2, providing higher spatial resolutions (Fang et al., 2021), future research will explore prediction results and accuracy across various spatial resolutions, further enhancing and refining the CASA model.

4.4 Relationship between NDVI-NPP-MPD

This study delved into the diversity of medicinal plants within the Yinshan Mountains, revealing a noteworthy correlation among NPP, NDVI, and MPD. NPP is a direct source of food and energy for organisms (Yan et al., 2021). Notably, Zhang et al. (2023) used MODIS data and demonstrated the similarity in spatial distribution patterns and strong correlations between NPP and NDVI in the Dabie Mountains (Zhang et al., 2023). This suggests that NDVI can effectively depict the distribution and variation characteristics of NPP within a region. Correlation studies further underscored the highly significant positive relationship between NDVI and annual precipitation across all vegetation types (Sun et al., 2020). The Yinshan Mountains, at the boundary between monsoon and non-monsoon regions, include areas in the western and central regions classified as non-monsoon regions. The overall scarcity of precipitation and unfavorable growth conditions in these areas result in a low NDVI. Additionally, some studies have proposed a significant positive correlation between NDVI and plant diversity (He et al., 2021). In summary, the insufficient precipitation and unsuitable growth conditions in portions of the western and central Yinshan Mountains contribute to lower NPP and MPD levels in these areas.

4.5 Analysis of potential causes of MPD distribution from an ecological perspective

There is stratified heterogeneity in the spatial distribution of MPD in the Yinshan Mountains. Regarding vegetation type and vegetation cover, the Yinshan Mountains have a strong vertical distribution pattern, and the eastern part is located in a typical grassland area with high vegetation cover and medicinal plants such as Polygala tenuifolia and Echinops davuricus (Chinese Academy of Sciences Inner Mongolia and Ningxia Comprehensive Expedition Team, 1985). The baseband mainly consists of Stipa Bungeana grassland and Stipa grandis grassland, with local areas having Bothriochloa ischaemum grassland distribution. As the elevation rises, scrub gradually appears, and forests appear on the shady slopes above 1400 m above sea level, and grasslands dominate on the sunny slopes. Betula platyphylla forests occur at altitudes of 1600-2000 m and with increasing altitude are gradually replaced by Picea crassifolia forests, Picea wilsonii forests, and Picea meyeri forests. The central part of the Yinshan Mountains is located in the desert steppe area, and the vegetation cover is slightly lower than that of the east, with medicinal plants such as Artemisia frigida and Iris tenuifolia. The baseband mainly consists of Stipa klemenzii grassland and Stipa breviflora grassland, and with increasing altitude, sunny slope shrubs dominate. Platycladus orientalis forests dominate between 1200-1500 m above sea level, and as the elevation continues to rise, Pinus tabuliformis forests, Juniperus rigida forests, and Betula platyphylla forests appear. The western part of the Yinshan Mountains has a low vegetation cover with medicinal plants such as Convolvulus tragacanthoides and Prunus mongolica. The baseband mainly includes, for example, Convolvulus tragacanthoides desert and Reaumuria songarica desert. The medicinal plants include, for example, Convolvulus tragacanthoides, Zygophyllum xanthoxylum, and Reaumuria songarica. As the altitude continues to rise, Stipa klemenzii grassland and Lonicera microphylla shrub appear. This difference may limit the development of MPD in the western Yinshan Mountains. Regarding climatic conditions, the Yinshan Mountains are the boundary between monsoon and non-monsoon regions, and parts of the western and central regions are non-monsoon regions. Although part of the Yellow River flows through this area, there remains a lack of precipitation and other conditions suitable for plant growth. From the perspective of human factors, the ecological damage in the western region is serious, which may lead to a decrease in MPD.
In summary, the MPD of the Yinshan Mountains is subject to a combination of ecological factors such as vegetation types, climatic conditions, and human activities. Over time, changes in climatic conditions and human activities, among other factors, can lead to varying degrees of MPD excursions. Therefore, relevant departments should establish nature reserves and dynamic monitoring stations to protect MPD. Meanwhile, the policy of returning farmland to forest and grassland should be implemented to improve the ecological environment and reduce the influence of human factors.

5 Conclusions

In this study, we employed a multidisciplinary approach to investigate the spatial distribution characteristics of MPD in the Yinshan Mountains across different spatial scales. We also revealed potential shifts in MPD under future climatic conditions. Additionally, the study harnessed the CASA model to project changes in NPP for the years 2017, 2019, and 2021 while examining the relationship between NPP and MPD. Furthermore, Sentinel-2 remote sensing data were used to analyze the evolution of vegetation coverage at a high resolution from June to September in 2017, 2019, and 2021. The findings underscored the richness of MPD in the Yinshan Mountains, with no cold spot areas identified at various spatial scales. Notably, the central and eastern regions of the Yinshan Mountains emerged as primary hotspots for MPD, with relatively abundant medicinal plant resources, and other areas exhibited relative scarcity. Projections under future climatic conditions indicated varying degrees of change in the habitat suitability for MPD in the Yinshan Mountains, with a prevailing focus on the central and eastern regions. Furthermore, the CASA-derived NPP results corresponded closely with the habitat suitability areas for MPD. Analysis of vegetation coverage trends revealed a declining pattern in the western region, contrasting with the stability observed in the central and eastern regions. This divergence might account for the rich diversity of medicinal plants and high NPP in the latter areas. Consequently, future conservation efforts should prioritize the central and eastern regions, especially in transitioning from high to low vegetation coverage areas, and focus on the needs of the western region. This study offers valuable guidance for local governments in aligning with international policies on sustainable development and biodiversity conservation.
[1]
Anselin L, 1995. Local indicators of spaital association: LISA. Geographical Analysis, 27(2): 93-115.

[2]
Bao G, Bao Y, Qin Z et al., 2016. Modeling net primary productivity of terrestrial ecosystems in the semi-arid climate of the Mongolian Plateau using LSWI-based CASA ecosystem model. International Journal of Applied Earth Observations and Geoinformation, 46: 84-93.

[3]
Bivand R S, Wong D W S, 2018. Comparing implementations of global and local indicators of spatial association. TEST, 27: 716-748.

[4]
Cao Q, 2015. The global outstanding universal value of plant diversity in Altai Mountains, Xinjiang[D]. Urumqi: Xinjiang Agricultural University. (in Chinese)

[5]
Chapin III F S, Zavaleta E S, Eviner V T et al., 2000. Consequences of changing biodiversity. Nature, 405: 234-242.

[6]
China Medicinal Materials Company, 1994. China Traditional Chinese Medicine Resource Series, China Traditional Chinese Medicine Resource Series Summary. Beijing: Science Press. (in Chinese)

[7]
Chinese Academy of Sciences Inner Mongolia and Ningxia Comprehensive Expedition Team, 1985. Inner Mongolia Vegetation. Beijing: Science Press. (in Chinese)

[8]
Dong R, Hua L, Hua R et al., 2023. Prediction of the potentially suitable areas of Ligularia virgaurea and Ligularia sagitta on the Qinghai-Tibet Plateau based on future climate change using the MaxEnt model. Frontiers in Plant Science, 14: 1193690.

[9]
Ebdon D, 1985. Statistics in Geography. New Jersey: Wiley-Blackwell.

[10]
Fajinmi O O, Olarewaju O O, Van Staden J, 2023. Propagation of medicinal plants for sustainable livelihoods, economic development, and biodiversity conservation in South Africa. Plants-Basel, 12(5): 1174.

[11]
Fang P, Yan N, Wei P et al., 2021. Aboveground biomass mapping of crops supported by improved CASA model and Sentinel-2 multispectral imagery. Remote Sensing, 13(14): 2755.

[12]
Getis A, Ord J K, 1992. The analysis of spatial association by use of distance statistics. Geographical Analysis, 24(3): 189-206.

[13]
Guo J, Zhang C, Zhang M et al., 2024. Analysis of the distribution of Astragalus membranaceus var. mongholicus in Inner Mongolia under climate change using the GEE platform. Science of Traditional Chinese Medicine, 2(3): 237-244.

[14]
He R, Lei J, Yang F, 2021. Correlation and spatial distribution characteristics of remote sensing vegetation index and plant diversity: A case study of main urban area of Haikou city. Guihaia, 41(3): 351-361. (in Chinese)

[15]
Huang R, Du H, Wen Y et al., 2022a. Predicting the distribution of suitable habitat of the poisonous weed Astragalus variabilis in China under current and future climate conditions. Frontiers in Plant Science, 13: 921310.

[16]
Huang X, He L, He Z et al., 2022b. An improved Carnegie-Ames-Stanford Approach model for estimating ecological carbon sequestration in mountain vegetation. Frontiers in Ecology and Evolution, 10: 1048607.

[17]
Kapuka A, Dobor L, Hlásny T, 2022. Climate change threatens the distribution of major woody species and ecosystem services provision in southern Africa. Science of The Total Environment, 850: 158006.

[18]
Kong J M, Goh N K, Chia L S et al., 2003. Recent advances in traditional plant drugs and orchids. Acta Pharmacologica Sinica, 24(1): 7-21.

[19]
Li C, Liu Y, Zhu T et al., 2023. Considering time-lag effects can improve the accuracy of NPP simulation using a light use efficiency model. Journal of Geographical Sciences, 33(5): 961-979.

[20]
Liu J, Long S, Zhao G, 2018. Spatial statistical analysis of regional science technology and finance development in China: Based on the combination of Moran’s I index and Lisa index. Journal of Zhejiang Shuren University, 18(5): 43-50. (in Chinese)

[21]
Liu Z, Hu M, Hu Y et al., 2017. Estimation of net primary productivity of forests by modified CASA models and remotely sensed data. International Journal of Remote Sensing, 39(4): 1092-1116.

[22]
Mitchell A, 2005. The ESRI Guide to GIS Analysis, Volume 2. State of California: ESRI.

[23]
Parichehreh S, Tahmasbi G, Sarafrazi A et al., 2020. Distribution modeling of Apis florea Fabricius (Hymenoptera, Apidae) in different climates of Iran. Journal of Apicultural Research, 61(4): 469-480.

[24]
Pawson S M, Brin A, Brockerhoff E G et al., 2013. Plantation forests, climate change and biodiversity. Biodiversity and Conservation, 22: 1203-1227.

[25]
Qiu S, Liang L, Wang Q et al., 2023. Estimation of European terrestrial ecosystem NEP Based on an improved CASA model. IEEE Journal of Selected Topics in Applied Earth Observations and Remote Sensing, 16: 1244-1255.

[26]
Romeiras M M, Essoh A P, Catarino S et al., 2023. Diversity and biological activities of medicinal plants of Santiago Island (Cabo Verde). Heliyon, 9(4): e14651.

[27]
Shen L, Deng H, Zhang G et al., 2023. Effect of climate change on the potentially suitable distribution pattern of Castanopsis hystrix Miq. in China. Plants-Basel, 12(4): 717.

[28]
Shi X, Yang P, Xia J et al., 2024. Effects of precipitation on vegetation and surface water in the Yellow River Basin during 2000-2021. Journal of Geographical Sciences, 34(4): 633-653.

[29]
Song H, Zhang X, Wang X et al., 2023. Not the expected poleward migration: Impact of climate change scenarios on the distribution of two endemic evergreen broad-leaved Quercus species in China. Science of the Total Environment, 889: 164273.

[30]
Sun Q, Liu W, Gao Y et al., 2020. Spatiotemporal variation and climate influence factors of vegetation ecological quality in the Sanjiangyuan National Park. Sustainability-Basel, 12(16): 6634.

[31]
Tali B A, Khuroo A A, Nawchoo I A et al., 2019. Prioritizing conservation of medicinal flora in the Himalayan biodiversity hotspot: An integrated ecological and socioeconomic approach. Environmental Conservation, 46(2): 147-154.

[32]
Wang J, Wei X, Sun S et al., 2023. Assessment of carbon sequestration capacity of E. ulmoides in Ruyang county and its ecological suitability zoning based on satellite images of GF-6. Sensors-Basel, 23(18): 7895.

[33]
Wang Y, Turvey S T, Leader-Williams N, 2022. Global biodiversity conservation requires traditional Chinese medicine trade to be sustainable and well regulated. Global Change Biology, 28(23): 6847-6856.

[34]
Wang Y, Xu X, Huang L et al., 2019. An improved casa model for estimating winter wheat yield from remote sensing images. Remote Sensing, 11(9): 1088.

[35]
Wei X X, Zhao Z Y, Shi, T T et al., 2023. Medicinal plant resources in Inner Mongolia Autonomous Region of China and Mongolia: A comparative study. China Journal of Chinese Materia Medica, 48(15): 4078-4086. (in Chinese)

[36]
Wen W, Li Z, Shao J et al., 2021. The distribution and sustainable utilization of buckwheat resources under climate change in China. Plants-Basel, 10(10): 2081.

[37]
Yan Y, Wu C, Wen Y, 2021. Determining the impacts of climate change and urban expansion on net primary productivity using the spatio-temporal fusion of remote sensing data. Ecological Indicators, 127: 107737.

[38]
Zhang H T, Wang W T, 2023. Prediction of the potential distribution of the endangered species Meconopsis punicea Maxim under future climate change based on four species distribution models. Plants-Basel, 12(6): 1376.

[39]
Zhang H, Wang Y, Gu Z et al., 2023. Study on spatiotemporal dynamics and correlation of NPP and NDVI in Dabie Mountain area based on MODIS. Journal of Xinyang Normal University (Natural Science Edition), 36(3): 362-366. (in Chinese)

[40]
Zhang L, Gong J, 2016. Protection and sustainable reuse of traditional Chinese medicine resources. World Latest Medicine Information, 16(18): 203-204. (in Chinese)

[41]
Zhang M X, Chen Y, Guo J X et al., 2022a. Complex ecological and socioeconomic impacts on medicinal plant diversity. Frontiers in Pharmacology, 13: 979890.

[42]
Zhang M X, Jing Z X, Shi T T et al., 2020. Differences in spatial distribution of medicinal plant resources in Yinshan region of Inner Mongolia. China Journal of Chinese Materia Medica, 45(21): 5143-5149. (in Chinese)

[43]
Zhang R, Zhang M, Yan Y et al., 2022b. Promoting the development of Astragalus mongholicus bunge industry in Guyang county (China) based on MaxEnt and remote sensing. Frontiers in Plant Science, 13: 908114.

[44]
Zhang S, Zhou Y, Yu R et al., 2022c. China’s biodiversity conservation in the process of implementing the Sustainable Development Goals (SDGs). Journal of Cleaner Production, 338: 130595.

[45]
Zhang Z, Jiang W, Ling Z et al., 2025. Understanding the spatio-temporal dynamics of ecosystem services under multiple future scenarios to assess the progress of Sustainable Development Goals implementation. Journal of Geographical Sciences, 35(4): 745-762.

[46]
Zhou X, Wang X, Ren Z et al., 2025. Human activities rather than climate change dominate the growth of carbon fluxes in the Hexi Corridor oasis area, China. Journal of Geographical Sciences, 35(2): 252-272.

Outlines

/