Research Articles

Increasing threat from landfalling tropical cyclones over China due to their characteristic changes (1949-2022)

  • HE Shanfeng , 1 ,
  • LI Zheng 1, 2 ,
  • FENG Aiqing 3 ,
  • WANG Wei 1 ,
  • MA Yunjia 1 ,
  • WU Shaohong 4
Expand
  • 1. School of Geography and Tourism, Qufu Normal University, Rizhao 276800, Shandong, China
  • 2. School of Tourism, Hunan Normal University, Changsha 410081, China
  • 3. National Climate Center, Beijing 100081, China
  • 4. Institute of Geographic Sciences and Natural Resources Research, CAS, Beijing 100101, China

He Shanfeng (1980‒), PhD and Professor, specialized in environmental evolution and disaster risk. E-mail:

Received date: 2025-04-29

  Accepted date: 2025-06-06

  Online published: 2025-08-26

Supported by

Young Taishan Scholars Program of Shandong Province(tsqn202103065)

National Natural Science Foundation of China(42371084)

Abstract

Tropical cyclone activity has undergone significant changes under the impact of global warming since the 20th century. However, the characteristic and trend changes of landfalling tropical cyclones over China still need to be further clarified. The study conducted an analysis of the spatiotemporal characteristics and trends of landfalling tropical cyclones over China from 1949 to 2022 using the dataset of the best tracks of tropical cyclones from the China Meteorological Administration. Additionally, we explored the influences of ENSO and the Pacific Decadal Oscillation (PDO) on landfalling tropical cyclone activities. The results indicate that: (1) The annual average number of landfalling tropical cyclones over China is approximately 8.85, showing a significant decreasing trend, and the decreasing range becomes larger with lower latitude overall. However, both the proportion of landfalling tropical cyclones to the total number and the percentage of higher intensity tropical cyclones increase. (2) The landfall locations of tropical cyclones in China are mainly concentrated between 18°N and 26°N, accounting for approximately 88.2% of the total, and the landfall frequency shows a sharp decline in the regions north of 30°N. The central landfall location of tropical cyclones has shifted significantly northwestward, moving closer to China. Compared to 1949-1969, the central genesis location from 2010 to 2022 shifted 4.5° westward and 2.0° northward. (3) There is a correlation between ENSO and the genesis frequency variation of tropical cyclones in the Northwest Pacific and landfalling over China. El Niño promotes the genesis of strong tropical cyclones and leads to a more southeastern bias in the genesis location of landfalling tropical cyclones, while La Niña has an opposite effect. The PDO also affects the tropical cyclones to a certain extent. During the PDO warm phase, the genesis position of tropical cyclones is westward and the number is smaller than that in the cold phase. This study further clarifies the changing trends and characteristics of landfalling tropical cyclones over China since 1949. It also highlights the impacts of ENSO and the PDO on tropical cyclone activities. The findings can serve as a scientific basis for conducting simulations and assessments of tropical cyclones and for disaster prevention and mitigation efforts.

Cite this article

HE Shanfeng , LI Zheng , FENG Aiqing , WANG Wei , MA Yunjia , WU Shaohong . Increasing threat from landfalling tropical cyclones over China due to their characteristic changes (1949-2022)[J]. Journal of Geographical Sciences, 2025 , 35(7) : 1383 -1404 . DOI: 10.1007/s11442-025-2376-6

1 Introduction

Tropical cyclones are among the most lethal and destructive natural disasters, posing severe threats to human life and socio-economic security (Hu et al., 2023). Since the beginning of the 21st century, global economic losses associated with tropical cyclones have significantly increased, with the exposed population rising from 408 million in 2002 to 792 million in 2019 (Jing et al., 2024). Hurricane Katrina in 2005 caused over 1800 fatalities and USD 200 billion in economic losses, standing as the most catastrophic natural disaster to strike the United States. In 2019, Super Typhoon Lekima made landfall in China, affecting over 14 million people across nine provincial-level regions. In September 2023, Hurricane Daniell struck Libya, causing severe casualties and property damage, was the world’s worst storm disaster after the 2008 Myanmar cyclone. With an 18,400 km-long continental coastline, China is among the countries most frequently impacted by tropical cyclones and suffers the heaviest associated losses worldwide (Pan et al., 2014). Between 2003 and 2023, tropical cyclone disasters claimed over 3520 lives in China, with direct economic losses exceeding USD 141.3 billion, while coastal regions demonstrated escalating disaster exposure and loss trends (Su and Fang, 2023). The reasons for this situation are on the one hand, the increasing exposure of vulnerable objects caused by the growth of permanent population and rapid economic development in coastal areas; on the other hand, the great changes in the activity characteristics of tropical cyclones under the background of global climate change (Wu, 2023). The IPCC Sixth Assessment Report (AR6) indicates that future landfalling intense typhoons may increase in number, with average wind speeds potentially intensifying further (IPCC, 2021).
The impacts of landfalling tropical cyclones are closely related to their genesis locations, frequency, intensity, trajectory, and landfall locations. Tropical cyclones that make landfall in India, Bangladesh, and Myanmar predominantly originate in the North Indian Ocean between 5°N and 16°N (Bhardwaj and Singh, 2020), while tropical cyclones in the northwestern Pacific (including the South China Sea) mostly affect China, Japan, Vietnam, and the Philippines (Liu and Chan, 2023). In recent years, the genesis time of the first tropical cyclone in the Northwest Pacific has shown delayed onset, with genesis locations shifting westward and northward (Cha et al., 2023). Quantitatively, global annual tropical cyclone frequency in the 20th century decreased by 13% compared to the latter half of the 19th century, with approximately 9% reduction in the Northwest Pacific region (Chand et al., 2022). However, the decline in tropical cyclone frequency does not indicate a diminished threat. Kossin et al. (2023) demonstrated that the global landfall probability of tropical cyclones has significantly increased. Yao et al. (2023) further identified that the proportion of super typhoons among autumn typhoons making landfall in China had gradually increased since the 21st century. The spatial extent of cyclone impacts is determined by landfall locations and tracks, while damage magnitude primarily depends on intensity and duration (Yin et al., 2013; He et al., 2023). Since the 1970s, tropical cyclone landfalls in East and Southeast Asia have intensified by 12%-15%, while the proportion of high-intensity storms has doubled or even tripled (Mei and Xie, 2016). Meanwhile, these intense typhoons have penetrated farther inland from coastal areas and persisted longer over land (Li and Chakraborty, 2020). Furthermore, translational speed constitutes a critical parameter in landfalling cyclone research. While disaster agencies implement wind/flood preparations for approaching cyclones, faster translational speed may exacerbate losses due to lack of preparation time, which has not been given sufficient attention in previous studies (Takagi and Esteban, 2016).
The El Niño-Southern Oscillation (ENSO) and Pacific Decadal Oscillation (PDO) represent two critical factors influencing the evolutionary characteristics of tropical cyclones (Feng, 2003; Han et al., 2023). As the predominant interannual variability signal in the atmosphere-ocean coupling system, ENSO modulates tropical cyclone activity across the Pacific, Atlantic, and Indian Ocean basins by altering atmospheric dynamics including vertical wind shear and stability (Jin et al., 2014; Tan et al., 2019). However, ENSO’s modulatory effects exhibit regional disparities in both mechanisms and magnitude of tropical cyclone activities (Pan et al., 2014). During La Niña years, the number of typhoons affecting Australia decreased significantly (Chand et al., 2013), while the typhoon frequency entering the East China Sea increased compared with normal years (Lu et al., 2018). In El Niño years, the frequency of tropical cyclones landed in the Philippines was significantly lower than the average (Corporal-Lodangco et al., 2016), but the cyclone intensity increased in the Northwest Pacific in summer (Tong et al., 2023). ENSO significantly modulates tropical cyclones genesis locations. The locations of tropical cyclones landfalling in China during El Niño years have a wider distribution of longitudes (Wang and Li, 2022), while the cyclone genesis locations in the Bay of Bengal move eastward in La Niña years (Girishkumar and Ravichandran, 2012). The PDO similarly affects tropical cyclone spatiotemporal characteristics by modifying Northwest Pacific large-scale environmental fields through sea surface temperature regulation (Wang and Wang, 2023). When PDO is in the cold phase, the large-scale environment including sea surface temperature, vertical wind shear and steering wind is more conducive to the genesis of tropical cyclones in the mid-latitudes of the Northwest Pacific (Lee et al., 2021), which increases the frequency of tropical cyclones entering the East China Sea (Lu et al., 2018). Furthermore, PDO phase transitions exert notable influences on tropical cyclone genesis locations (Wang et al., 2023).
The Northwest Pacific is the most active oceanic basin for tropical cyclone genesis (Cha et al., 2023; Zhou and Xu, 2023). Although the frequency of tropical cyclones in this sea area decreased in recent years, the average intensity demonstrated an increasing trend (Wang et al., 2022), with durations becoming significantly longer (Nayak and Takemi, 2023). Current understanding remains limited regarding the evolving characteristics (frequency, intensity, landfall locations) of China-landfalling cyclones under global change, which makes it uncertain to evaluate the comprehensive impacts of future tropical cyclones. Previous studies have focused more on the specific characteristics of tropical cyclones with high intensity or large losses. There are relatively few long-term series analyses on the overall characteristics of tropical cyclones landfalling over China, and the influencing factors mainly focus on the relationship between ENSO and tropical cyclone activities. There is a lack of systematic analysis of the impact of ENSO and PDO on the frequency, intensity and locations of landfalling tropical cyclones. Therefore, this study analyzes the spatiotemporal characteristics and evolving trends of landfalling tropical cyclones over China from 1949 to 2022 using the Best Track Dataset from the China Meteorological Administration, while attempting to elucidate the impacts of ENSO and PDO on tropical cyclones. The findings aim to reveal the latest features of landfalling tropical cyclones, thereby providing scientific foundations for enhancing risk assessment and disaster response capabilities of tropical cyclones.

2 Data and methods

2.1 Data sources

Tropical cyclone data were obtained from the Best Track Dataset of the Tropical Cyclone Data Center of the China Meteorological Administration (https://tcdata.typhoon.org.cn/index.html), which includes parameters such as number, time, 6-hourly center locations, and maximum sustained wind speeds near the center for tropical cyclones generated in the Northwest Pacific from 1949 to 2022. Following the Classification of Tropical Cyclones (GB/T 19021-2006) issued by the China Meteorological Administration, tropical cyclones are classified into six intensity categories: Tropical Depression (TD), Tropical Storm (TS), Severe Tropical Storm (STS), Typhoon (TY), Severe Typhoon (STY), and Super Typhoon (Super TY). The landfall intensity of a tropical cyclone is defined as the intensity recorded at the last track point before landfall, while its movement speed at landfall is calculated using the geographical coordinates of the two track points immediately before and after landfall. Generally, tropical cyclones exhibit their lowest central pressure and highest near-center wind speeds during their initial landfall, resulting in the most destructive potential. To avoid double counting, if the same tropical cyclone makes two or more landfalls, only the first landfall is counted. In addition, only tropical cyclones landfalling over China were recorded in the landfall statistics, and coastal islands except Taiwan, Hainan Island, Hong Kong, Zhoushan Islands and Chongming Island were not included in the landfall statistics.
The temperature anomaly index of the Niño 3.4 region (5°N-5°S, 170°W-120°W) is frequently employed to characterize ENSO events. The Niño 3.4 index data utilized herein were sourced from the U.S. National Centers for Environmental Prediction (https://origin.cpc.ncep.noaa.gov/products/analysis_monitoring/ensostuff/ONI_v5.php). The average of monthly Niño 3.4 index in the season with frequent tropical cyclone landfall (May-November) is taken as the Niño 3.4 index in May-November, and the years whose average value is > 0.5 and ≤ -0.5 are defined as El Niño years and La Niña years, respectively, and the remaining years are defined as normal years (Gu et al., 2018).
The Pacific Decadal Oscillation (PDO) index was obtained from the Joint Institute for the Study of the Atmosphere and Ocean at the University of Washington (https://psl.noaa.gov/gcos_wgsp/Timeseries/Data/pdo.long.data). When the PDO index is positive within a certain period, it implies that the PDO is in the warm phase during this period; when the PDO index is negative, it indicates the cold phase.

2.2 Methods

2.2.1 Mann-Kendall test

M-K test is a non-parametric statistical method. Due to its advantages such as application limitation, small subjectivity, simple operation and intuitive results, it can objectively reflect the change trend of time series, and has been widely used in the analysis of time series. This method is adopted in this paper to analyze and detect the change trend and abrupt points of the time series of landfalling tropical cyclones. X (x1, x2,..., xn), to represent the variables of the time series, construct an order column:
$H_{m}=\sum_{i=1}^{m} z_{i}, z_{i}\left\{\begin{array}{ll} 1 & x_{i}>x_{j} \\ 0 & \text { else } \end{array}, j=1,2, \ldots, i\right.$
U F m = H m E H m / V a r H m , m = 1 , 2 , . . . , n
where E(Hm) and Var(Hm) represent the mean and variance of Hm, respectively. For a given significance level α, if |UFm| > Uα, the time series exhibits a statistically significant trend. By reversing the time series Χ to xn, xn-1, …, x1, and repeating the procedure, the inverse sequence UBm is constructed. The temporal plots of UF and UB against time can reveal trends in the data. UF value > 0, indicates an upward trend, while UF value < 0 signifies a downward trend. If the UF and UB curves intersect within the bounds of the upper and lower significance level lines, the intersection point marks the initiation time of an abrupt change.

2.2.2 Center of Gravity-Standard Deviation Ellipse analysis

The Center of Gravity-Standard Deviation Ellipse analysis is a method that visually reveals the spatial distribution characteristics of point datasets (Zhao, 2014). This method can reflect the spatial directional distribution of geographical elements. The range of the ellipses represents the main spatial area of factor distribution, the size of the ellipses reflects the clustering of factors in spatial distribution, and the direction and distance of the shift of geographical elements’ center of gravity reflect the evolution of geographical elements in spatial location. This study employs this methodology to analyze spatial distribution characteristics and temporal variations in the genesis locations of landfalling tropical cyclones. The principal computational formulas are as follows:
X = i = 1 n w i x i i = 1 n w i , Y = i = 1 n w i y i i = 1 n w i
$\sigma_{x}=\sqrt{\frac{\sum_{j=1}^{n}\left(w_{i} x_{i} \cos \theta-w_{i} y_{i} \sin \theta\right)^{2}}{\sum_{i=1}^{n} w_{i}^{2}}}$
$\sigma_{y}=\sqrt{\frac{\sum_{j=1}^{n}\left(w_{i} x_{i} \sin \theta-w_{i} y_{i} \cos \theta\right)^{2}}{\sum_{i=1}^{n} w_{i}^{2}}}$
tanθ = i = 1 n w i 2 x i 2 i = 1 n w i 2 y i 2 + i = 1 n w i 2 x i 2 i = 1 n w i 2 y i 2 4 i = 1 n w i 2 x i 2 y i 2 2 i = 1 n w i 2 x i 2 y i 2
where (X, Y) is the center of gravity coordinates; (xi, yi) is the spatial location of the research object; wi is the corresponding weight. σx and σy are the standard deviations along the x and y axes; θ is the elliptical azimuth angle; tanθ is the tangent function of an ellipse.

2.2.3 Kernel density analysis

Kernel density analysis takes a certain regular region around each point element in space as the calculation range of density, and shows the distribution of point elements in space by calculating the density of point elements in this region (Xu and Gao, 2016). This study employs kernel density analysis to identify high-incidence areas of landfalling tropical cyclone genesis locations, with the computational formula expressed as:
$H_{i}=\frac{1}{n \pi R^{2}} \times \sum_{j=1}^{n} K_{j}\left(1-\frac{D_{i j}^{2}}{R^{2}}\right)^{2}$
where Hi is the kernel density of any point i in space; Kj is the weight of the research object; Dij is the distance between the spatial point elements i and the research object j; R is the bandwidth (Dij < R) of the selected regular region; n is the number of research objects j in the range of bandwidth R.

2.2.4 Wavelet analysis

Wavelet analysis is a common tool for analyzing the local changes in time series. By dividing time series into time-frequency space, the trend and periodic composition of the series can be determined (Torrence and Compo, 1998). In this study, we employ the complex wavelet function ψ(t), commonly applied in oceanographic and meteorological research, to analyze the periodicity of tropical cyclone activity. The mathematical expression is defined as follows:
ψ ( t ) = π 1 / 4 e t 2 / 2 e i ω 0 t
where t is the time parameter; ω0 is the center frequency, which refers to the study of Torrence et al. (1998), and take 6 to meet the permissible condition.

2.2.5 Wavelet coherence analysis

Wavelet coherence analysis (WTC) reveals correlations between two time series within low-energy regions of the time-frequency space. This study applies WTC to investigate the teleconnection relationships among ENSO, PDO, and the spatiotemporal characteristics of tropical cyclones. The wavelet coherence spectrum of two time series Xi and Yi is defined as (Grinsted et al., 2004):
R 2 ( α , β ) = S α 1 W X Y ( α , β ) 2 S α 1 W X ( α , β ) 2 S α 1 W Y ( α , β ) 2
where S is the smoothing window, S α 1 W X Y ( α , β ) 2 is the cross product of two time series at a certain amplitude. S α 1 W X ( α , β ) 2 and S α 1 W Y ( α , β ) 2 are the amplitudes of two time series of vibration waves.
Additionally, this study employs linear trend analysis to evaluate the long-term changing tendencies of landfalling tropical cyclones, combined with the M-K test to assess the statistical significance of the observed trends. Correlation analysis is utilized to measure the closeness of associations between tropical cyclone characteristics and influencing factors. The strength of correlation is determined by the coefficient R, which ranges from [-1, 1]. Values closer to 1 or -1 indicate stronger correlations, with the sign denoting positive or negative relationships.

3 Results

3.1 Frequency of landfalling tropical cyclones

From 1949 to 2022, 2418 tropical cyclones generated in the Northwest Pacific, with 655 making landfall in China, averaging 8.85 annual landfalls (Figure 1a). Landfall frequencies exhibited substantial interannual variability, peaking at 15 events in 1952 and 1961, while reaching a minimum of 4 events in 1982. The landfall frequency also showed obvious interdecadal variation, and the number in the 1950s and 1960s was the maximum, with 97. The frequency of landfalling tropical cyclones has decreased significantly since the 1990s. The smallest number of landfalls occurred in the 2010s, with only 80. On the whole, the frequency of tropical cyclones generated in the Northwest Pacific and made landfall in China showed a significant downward trend (p < 0.05). Based on the M-K abrupt change test, abrupt reductions in genesis frequency and landfall frequency occurred in 1986 and 1967 respectively, followed by persistent fluctuating downward trends thereafter (Figures 1c and 1d). Annual landfall proportions relative to total genesis ranged from 13.8% to 45.8% (Figure 1b), displaying an overall increasing trend that contrasts with interannual landfall frequency variations. Decadal analysis showed the maximum landfall ratios (31.3%) during 2001-2010 versus minimum values (24.0%) in the 1960s. The M-K test confirmed a significant upward trend (p < 0.05) in landfall proportions from 1949 to 2018.
Figure 1 Interannual frequency variation of tropical cyclone genesis in the Northwest Pacific and landfalling tropical cyclones over China, the proportion of landfall frequency to the total number of tropical cyclone generated, M-K test for tropical cyclone genesis frequency and landfall tropical cyclone frequency from 1949 to 2022
The variation in tropical cyclone genesis frequency over the Northwest Pacific exhibits significant periodic oscillations, with a dominant cycle of approximately 28 a under the 45 a time scale (Figures 2a and 2b). Additionally, secondary variation cycles are observed at 31a, 18a, and 8a time scales, with both the cycle duration and oscillation intensity gradually weakening as the time scale decreases. The frequency of tropical cyclones making landfall in China shows cyclical variations at multiple time scales such as 7a and 33a, with the largest amplitude observed at the 7a scale (Figures 2c and 2d). Both genesis and landfall frequencies of tropical cyclones demonstrate low-frequency to high-frequency alternations throughout the study period, yet their variation cycles differ significantly and lack consistency.
Figure 2 Wavelet analysis and wavelet variogram of the frequency of generating tropical cyclones in the Northwest Pacific, and landfalling tropical cyclones over China from 1949 to 2022

3.2 Intensity of landfalling tropical cyclones

Figure 3a illustrates the interannual variations in the intensity categories of tropical cyclones making landfall in China. During 1949-2022, TY exhibited the highest frequency and proportion among landfalling tropical cyclones, with 155 occurrences (23.7%), followed by STS (151 occurrences). TD makes landfall almost every year. The frequency changes of STY and Super TY have no obvious rules. The landfalls of STY were most frequent (6 times) in 2005, and the landfalls of Super TY were 2 times in 1959 and 2016 respectively. Among them, the super typhoon “Rammasun” with the highest central wind speed at landfalls appeared in 2014. It can be found that the landfall frequency of TD has decreased significantly in recent years, while the landfall proportion of tropical cyclones with typhoon grade and above has increased significantly since entering the 21st century, rising from 33.7% in 1949-1999 to 46.3% in the 21st century.
Figure 3 Interannual variation of landfalling tropical cyclone intensity, moving speed and wind speed, and M-K test for wind speed variation
The translation speed of tropical cyclones before and during landfall is also a key parameter influencing their disaster potential (Figure 3b). Pre-landfall translation speeds of tropical cyclones predominantly range from 4 to 6 m/s, with a mean value of 5.01 m/s, exhibiting an overall slight decreasing trend. In contrast, the moving speed of tropical cyclones during landfall is higher than that before landfall, and it shows a slight upward trend. The interannual variations are quite different. The highest value is 8.21 m/s, which is 83.3% higher than the lowest value. Furthermore, the correlation analysis of the wind speed at landfalling time and the moving speed at landfalling time found that the two were independent and weakly correlated (R = 0.14). So the moving speed can not be predicted according to the central wind speed of the tropical cyclone, which undoubtedly increases the difficulty of predicting its movement trend.
As shown in Figure 3c, the average maximum wind speed during the lifetime of landfalling tropical cyclones was 37.27 m/s, showing an extremely significant downward trend (p < 0.01). In contrast, wind speeds at landfall show a slight upward trend with a mean value of 29.82 m/s. The correlation between these two parameters reached a highly significant level (R = 0.67, p < 0.01). The wind speed of a tropical cyclone at landfall is usually lower than the maximum wind speed of its lifetime. This is due to the influence of the surrounding atmospheric and land and sea conditions. When a tropical cyclone approaches land, the reduced water vapor supply and increased friction in the surrounding environment lead to lower wind speed and weaker intensity. The M-K test was applied to analyze the mutation in both maximum wind speed and landfall wind speed. As shown in Figure 3d, the maximum wind speed during the lifetime of tropical cyclones initially increased and then decreased, with a notable shift occurring around 1990. After the late 1990s, the decreasing trend became statistically significant (p < 0.05). Landfall wind speeds showed a distinct strengthening trend during 1960-1970 with three crossover points around 1980. However, moving t-test analysis indicated non-significant results, suggesting no abrupt changes during this period. An intensification mutation occurred in landfall wind speeds during 1988, with the strengthening trend briefly attaining significance (p < 0.05) in the mid-2010s.

3.3 Geographic distribution of landfalling tropical cyclones

As illustrated in Figure 4a, tropical cyclone landfall locations are predominantly distributed in coastal areas between 18°N and 30°N, with Guangdong, Fujian, Taiwan, and Hainan provinces experiencing the highest frequency. North of 30°N, landfalling tropical cyclones in China decrease sharply, primarily due to prevailing westerlies in the mid-latitude troposphere and strong westerly steering currents. These factors direct most mid-latitude cyclones entering East Asia toward Korea and Japan. Another reason is that China’s coastline runs northwestward from north of the Yangtze River estuary. According to the statistical analysis of tropical cyclone landfall intensity (Figure 4b), higher intensities are observed in the regions between 22°N-25°N and 27°N-30°N, covering the eastern part of Taiwan Island, eastern Guangdong, southeastern Fujian, and the coastal areas of eastern Zhejiang. Among these, the landfall intensity is highest between 27°N and 28°N, with an average wind speed of 34.2 m/s.
Figure 4 Tropical cyclone landfall locations, wind speed and the change of landfall frequency along the latitude interval
Longitudinal variation analysis requires consideration of coastal configuration and other factors, whereas latitude better reflects spatial patterns of landfall locations. Therefore, this study focuses on latitudinal changes in landfall locations. Annual landfall frequencies across latitudes exhibit substantial interannual fluctuations, demonstrating the irregular nature of tropical cyclone activity. The landfall frequency of tropical cyclones decreased gradually from south to north, and the landfall frequency of tropical cyclones from 18°N to 26°N accounted for 88.2% of the total, among which the landfall frequency of tropical cyclones from 22°N to 23°N was the largest, with an annual average of 2.8. Figure 4c shows the variation of the landfall frequency of tropical cyclones in every interval of certain latitudes. Except for a slight increase in the interval of 24°N to 26°N, the landfall frequency of tropical cyclones in other latitudes showed a decreasing trend, and in general, the decreasing rate of landfall frequency of tropical cyclones was faster the farther south. The frequency of tropical cyclones landfalling at 18°N-20°N (concentrated in Hainan Island) has a significant decreasing trend (p < 0.1). If 18°N-22°N or 18°N-24°N is combined into a statistical group, the decreasing trend of tropical cyclone landfall frequency passes the significance test of 0.05 and 0.01, respectively. The linear trend of landfall frequency of tropical cyclones in other latitudes is not significant. The analysis of the annual mean location of tropical cyclone landfalls on the interdecadal scale shows that there is a southward - northward - southward shift in latitude. So before 1980, the mean landfall location of tropical cyclones gradually shifted to the south in latitude, while the trend of northward shift was obvious from 1980 to 2000, and then gradually shifted to the south.

3.4 Genesis location changes of landfalling tropical cyclones

Statistical analysis of landfalling tropical cyclone genesis locations aids in understanding their trajectories and potential landfall locations. As shown in Figure 5a, all tropical cyclones generated in the vast area between 0°N-36°N and 106°E-180°E in the Northwest Pacific Ocean are likely to land in China, but the distribution of genesis locations is highly uneven. According to the kernel density calculations of the genesis locations, three main high-incidence areas, A, B and C, were delimited. Zone A, situated in the northern South China Sea (13°N-22°N, 110°E-120°E), generated 172 tropical cyclones with a density of 1.62 per 10,000 km2. Zone B, located east of the Philippines (10°N-20°N, 125°E-135°E), accounted for 142 tropical cyclones (21.7% of total) with a density of 1.19 per 10,000 km2. Zone C covers waters near Saipan and the Mariana Islands (7°N-14°N, 135°E-150°E) with a density of 0.93 per 10,000 km². A total of 224 tropical cyclones formed in the rest of the ocean, and the density was much lower than in areas A, B, and C, especially in the ocean north of 20°N and east of 150°E, where the number of tropical cyclones was relatively small and very scattered.
Figure 5 Distribution of genesis locations of tropical cyclones landfalling over China, changes in mean annual latitude and longitude and changes in genesis-landfall distance and time
It can be seen from Figure 5a that the standard deviation ellipse of landfalling tropical cyclone genesis location shows a decreasing trend with time, indicating that the genesis locations of tropical cyclones tend to be more and more concentrated. At the same time, the spatial distribution center of gravity of landfalling tropical cyclone genesis locations also gradually moved to the northwest, and the center of gravity of tropical cyclone genesis location in 2010-2022 moved 4.5 longitudes to the west and 2.0 latitudes to the north, closer to China than that in 1949-1969. The linear fitting results also confirmed this phenomenon (Figure 5b). From 1949 to 2022, there was a significant trend of westward shift of longitude and northward shift of latitude at the genesis location of landfalling tropical cyclones, both of which passed the significance test (p < 0.01). Further analysis showed that the movement speed of tropical cyclone genesis locations to the northwest gradually accelerated. Compared with 1949-1969, the movement speed of the center of gravity of tropical cyclone genesis locations was 30.2 km/10a during 1970-1989, and 83.7 km/10a during 2010-2022, compared with 1990-2009. The speed is nearly 1.8 times faster. The northwestward movement of the genesis location of landfalling tropical cyclones explains to some extent the reason for the increasing proportion of landfalling tropical cyclones in China. Guan et al. (2018) also pointed out in their study that in recent years, the genesis locations of landfalling tropical cyclones in China are more westward than that of non-landfalling tropical cyclones. The genesis locations of the landfalling tropical cyclones are closer to the land, which increases the chance of tropical cyclone landfalling. In addition, the time and distance from the genesis of tropical cyclones to landfall in China also showed a significant shortening trend during the study period (p < 0.01, Figure 5c). Before 2000, it took an average of 130.8 hours for tropical cyclones to land in China, but after entering the 21st century, it only took 109.9 hours to land in China, shortening the time by 16.0% on average. The average distance between tropical cyclone genesis and landfall has also decreased from 2065.4 km in the 20th century to 1693.8 km in the 21st century.

4 Relationship between ENSO, PDO and the spatiotemporal features of tropical cyclones

4.1 Relationship between ENSO, PDO and the frequency of tropical cyclones

From 1949 to 2022, there were 19 El Niño years and 24 La Niña years. With the exception of a few years, the number of tropical cyclones in the Northwest Pacific is lower in El Niño years than in normal years, while the opposite is true in La Niña years (Figure 6a). There is a significant negative correlation between Niño 3.4 index and the frequency of tropical cyclones. During super El Niño periods, such as 1982-1983, 1997-1998 and 2014-2016, the frequency of tropical cyclones is much lower than that in the years before and after El Niño years. It shows that ENSO affects the genesis frequency of tropical cyclones in the Northwest Pacific to some extent. However, this influence has changed since 1990. For example, although 1995, 1998 and 2010 are La Niña years, the occurrence frequency of tropical cyclones is less, and other years do not show obvious correlation with Niño 3.4 index. In terms of landfall frequency, the average number of tropical cyclones landfalling in China in El Niño year is 7.79, which is lower than the 8.92 in La Niña year (Figure 6b), reflecting the same trend as the frequency of tropical cyclones. In 1982, when the frequency of landfall tropical cyclones was the lowest (4), and in 1997 (5) and 2015 (5), there were very strong El Niño periods. The wavelet coherence analysis results also verify that the frequency of tropical cyclones is negatively correlated with the Niño 3.4 index during the study period (Figures 6c and 6d). During 1966-1988, the negative correlation between Niño 3.4 index and the frequency of tropical cyclones on the 2-6 a scale reached a significant degree, but after 1990, ENSO became mainly positive. The number of landfall tropical cyclones was negatively correlated with ENSO in two periods from 1965 to 2000, but no significant correlation was found in the 21st century.
Figure 6 Frequency variations of tropical cyclone genesis and landfall over China under different ENSO phases, and wavelet coherence spectra between tropical cyclone activity and ENSO
Figures 7a and 7b show the changes in the frequency of tropical cyclone genesis and landfall in China along with the conversion of warm and cold phases of PDO index. The PDO index underwent an abrupt shift around 1977, with North Pacific sea surface temperatures persisting in a cold phase prior to 1976, followed by two decades of warm-phase dominance. During PDO warm phases, the annual mean genesis frequency was 30.64 tropical cyclones-lower than the 34.32 tropical cyclones during cold phases, showing a statistically significant negative correlation (R= -0.27, p < 0.05). This indicates that PDO affects the genesis frequency of tropical cyclones to a certain extent, which means that, when PDO is in the warm phase, the frequency of tropical cyclones is less, and when PDO is in the cold phase, it is more. The frequency of landfalling tropical cyclones in China also has a similar rule in response to PDO phase changes. The annual landfall number in warm phase is 8.18, which is smaller than that in cold phase years, which is 9.39. Figure 7c shows significant quasi-2-5 a scale negative correlations between cyclone genesis frequency and PDO index during 1966-1985. The PDO exerted relatively strong influences on landfall frequencies during 1967-1975, 1985-2001, and 2006-2016 (Figure 7d), while showing weak resonance energy and sporadic significance in other periods.
Figure 7 Frequency variations of tropical cyclone genesis and landfall over China under different PDO phases, and wavelet coherence spectra between tropical cyclone activity and the PDO

4.2 Relationship between ENSO, PDO and the intensity of landfalling tropical cyclones

Although there is no significant correlation between the maximum wind speed of landfalling tropical cyclones and the Niño 3.4 index (Figure 8a), the maximum wind speed of tropical cyclones in El Niño years is higher than that in La Niña years on the whole, and the former is 13.1% higher than that in La Niña years, indicating that the intensity level of tropical cyclones occurring in El Niño years is relatively higher. The relationship between wind speed at the time of tropical cyclone landfall and the Niño 3.4 index is more complex, and the positive and negative correlations occur alternately during the whole study period (Figure 8b), indicating that ENSO has a relatively weak influence on the intensity at the time of tropical cyclone landfall. Wavelet coherence analysis reveals positive correlations within several high-energy resonance periods between ENSO and tropical cyclone wind speeds (Figures 8c and 8d). Consistent resonance cycles existed between ENSO and maximum lifetime wind speeds during 1965-2010, whereas landfall wind speed-ENSO resonance displayed intermittent patterns.
Figure 8 Variations in maximum wind speed and landfall wind speed of tropical cyclones under different ENSO phases, and wavelet coherence spectra between wind speed and ENSO
No significant linear relationship was observed between the maximum wind speed during the lifetime of landfalling tropical cyclones, the wind speed at landfall, and the PDO index (Figures 9a and 9b). In the late 1970s, the maximum wind speed of tropical cyclones weakened as the PDO transitioned to a warm phase; subsequently, both maximum and landfall wind speeds varied with phase shifts. Prior to 2000, the average wind speed during PDO cold phases was marginally higher than that during warm phases. However, this relationship changed after the 21st century, with tropical cyclone wind speeds during PDO warm phases becoming relatively stronger than those during cold phases. Wavelet coherence analysis revealed that the PDO index shared identical resonance periods with both the maximum and landfall wind speeds before 1960 and after the beginning of the 21st century. Since the 21st century, the PDO has shifted to exerting a positive influence on tropical cyclone wind speeds (Figures 9c and 9d). The study found that PDO cold and warm phases alternated frequently in the early 21st century, and changes in the correlation between wind speeds and the PDO emerged after 2000. The rapid phase transitions may explain the altered relationship between tropical cyclone intensity and the PDO.
Figure 9 Variations in maximum wind speed and landfall wind speed of tropical cyclones under different PDO phases, and wavelet coherence spectra between wind speed and the PDO

4.3 Relationship between ENSO, PDO and landfalling tropical cyclone genesis locations

Analysis of the spatial distribution of tropical cyclone genesis locations under different ENSO events (Figure 10a) reveals that during El Niño years, genesis locations shift eastward by 4.7° of longitude and southward by 1.1° of latitude compared to La Niña years. The more southeastern orientation of genesis locations implies that tropical cyclones need to propagate over the warm ocean for a longer time and traverse a longer path before possibly landfalling in China. This might be the main cause for the stronger intensity but lower frequency of tropical cyclones landfalling in China during El Niño years. Wavelet coherence analysis further confirms that the Niño 3.4 index exerts a negative influence on the latitudes of tropical cyclone genesis locations and a positive influence on their longitudes. During the periods of 1967-1974, 1981-1990, and 1990-2010, ENSO exhibited multi-scale resonant cycles with tropical cyclone genesis latitudes, showing significant negative correlations. In contrast, a positive correlation has persisted between ENSO and genesis longitude since 1981.
Figure 10 Genesis locations of tropical cyclones under different events of ENSO and PDO
In contrast to the cold phase of the PDO, the genesis locations of tropical cyclones that landed in China during the warm phase were slightly westward on the whole (Figure 10b). This might be attributed to the fact that when the PDO was in the cold phase, the intensity of the subtropical high in the Northwest Pacific was relatively weak, and the center of the subtropical high moved eastward and northward, thereby influencing the genesis locations of tropical cyclones to be more eastward. The situation was opposite in the warm phase. Wavelet coherence analysis reveals a negative correlation between the PDO index and the latitude of tropical cyclone genesis locations, coupled with a positive correlation with longitude. However, due to shorter and discontinuous resonance periods between them, the influence of PDO on tropical cyclone genesis locations remains statistically insignificant overall.

5 Conclusions

This study employed tropical cyclone data from the China Meteorological Administration, utilizing linear regression analysis, Mann-Kendall test, standard deviational ellipse centroid analysis, kernel density estimation, and wavelet analysis to systematically characterize the long-term spatiotemporal patterns and trends of landfalling tropical cyclones over China since 1949. Furthermore, statistical correlation methods and wavelet coherence analysis were integrated to investigate the relationships between ENSO, PDO, and landfalling tropical cyclone activities. The main findings are as follows:
(1) From 1949 to 2022, 655 tropical cyclones made landfall in China, exhibiting substantial interannual variability with an overall significant declining trend, but the proportion of landfalling tropical cyclones to the total number generated in the Northwest Pacific was increasing. In terms of intensity change, the landfall frequency of tropical depressions showed a decreasing trend, and the landfall proportion of typhoons and higher grade increased significantly in the 21st century.
(2) The landfall locations of tropical cyclones are concentrated between 18°N to 25°N, while the frequency of tropical cyclone landfalls north of 30°N is rather low. In terms of the variation of landfalling latitudes, the frequency decreases at a faster rate towards the south in general. The genesis locations of landfalling tropical cyclones are widely and unevenly distributed. The high-incidence areas are mainly concentrated in the northern part of the South China Sea, the eastern part of the Philippines, and the waters surrounding Saipan Island and the Mariana Islands. The center of genesis locations has shifted significantly towards the northwest. Compared with the period from 1949 to 1969, the center of genesis sources shifted westward by 4.5° of longitude and northward by 2.0° of latitude from 2010 to 2022. The distance and time from genesis to landfall of tropical cyclones have both exhibited remarkable shortening trends.
(3) ENSO exerts a distinct influence on the characteristics of tropical cyclones, such as frequency intensity, and genesis location. In El Niño years, the genesis frequency of tropical cyclones in the Northwest Pacific and the number of landfalls in China are lower than in normal years, but their intensities are relatively higher. In contrast to El Niño years, the genesis locations of landfalling tropical cyclones in La Niña years are more northwestward. PDO also has a certain impact on the activities of tropical cyclones. During the cold phase, the frequency of tropical cyclone genesis and landfall is higher than that in the warm phase, and the genesis locations are more eastward.

6 Discussion

Under the background of global change, the intensity of tropical cyclones making landfall has intensified (Mei and Xie, 2016), with a marked rise in high-destructive cyclones, exposing coastal regions to heightened typhoon disaster risks in the future (Wu, 
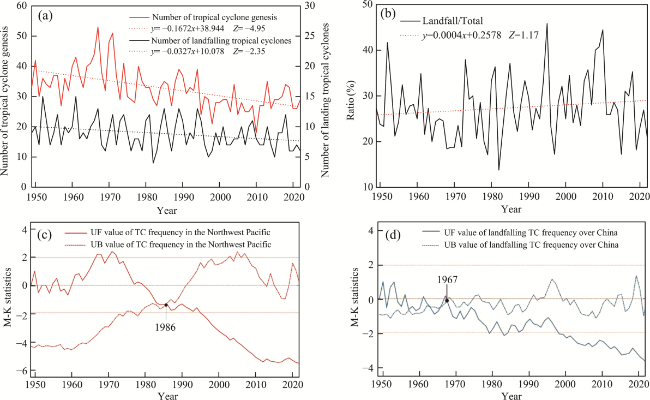
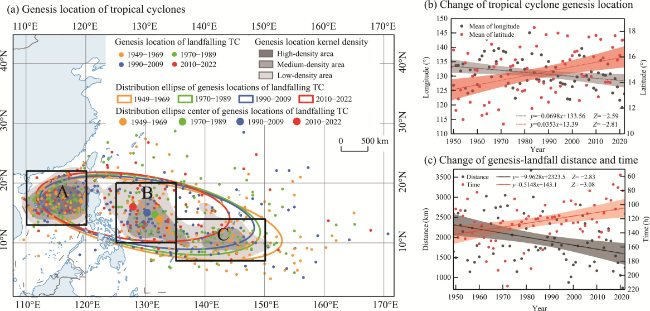
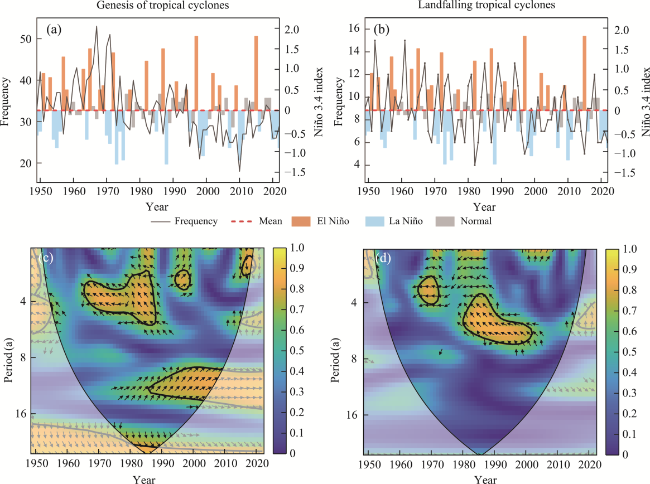
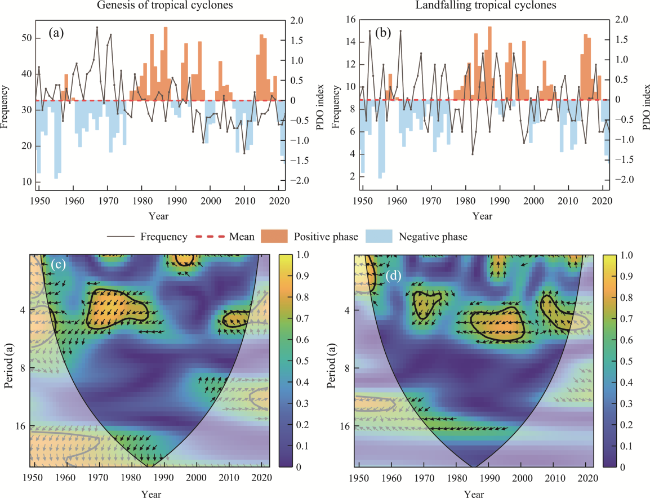
2023). This article discovers that in recent years, significant changes have occurred in the characteristics such as the frequency, intensity, landfall locations, and genesis locations of tropical cyclones making landfall in China. The significant decline in the frequency of tropical cyclone landfalls is to some extent attributed to the fact that the number of tropical cyclones generated in the Northwest Pacific has been in a low-frequency period since the mid-1990s. Global warming has led to the shift of tropical cyclones in the Northwest Pacific towards the Central and Eastern Pacific, thereby resulting in a reduction in the number of tropical cyclones in the Northwest Pacific (Tan et al., 
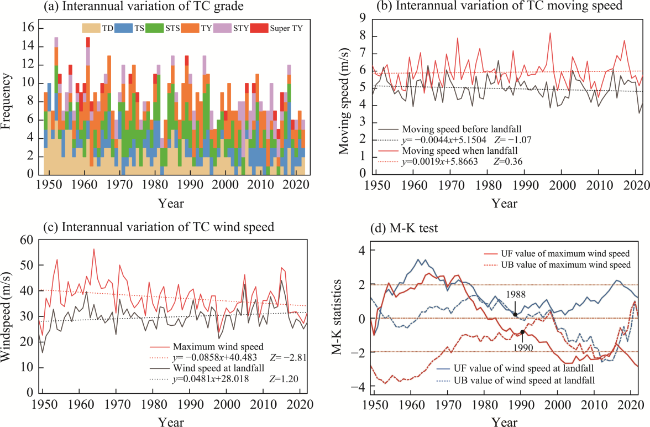
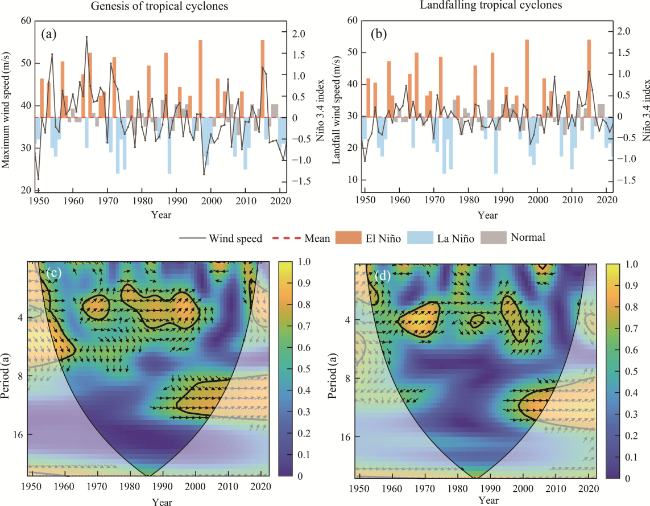
2019). Meanwhile, the research reveals that the proportion of tropical cyclones making landfall in China to the total number generated each year, as well as the proportion of high-intensity tropical cyclones, is on an upward trend, which is consistent with the research conclusion of Guan et al. (2018) regarding the long-term changes of tropical cyclones making landfall in East Asia. Wang et al. (
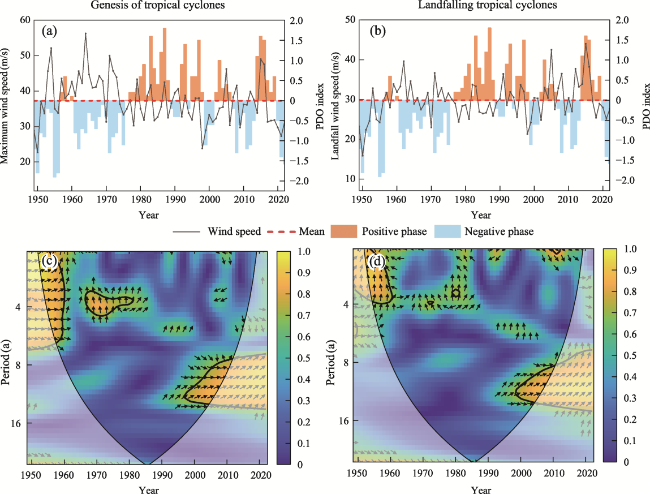
2022) contend that the increase in the intensity of tropical cyclones in recent years is primarily induced by ocean warming. Along with the rising global sea surface temperature, tropical cyclones can acquire more heat from the warm ocean surface and continuously intensify. It is highly probable that the average intensity of tropical cyclones making landfall in China will continue to rise in the future (Nie et al., 
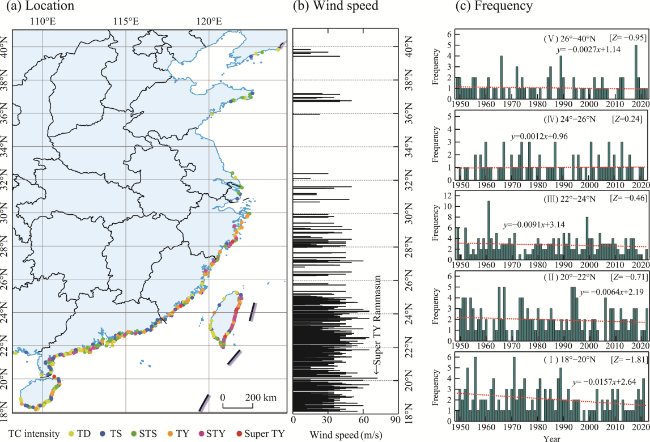
2023). There are also certain interdecadal patterns in the latitude variations of the landfall locations of tropical cyclones making landfall in China. Lu et al. (2018) assert that the location and intensity variations of the subtropical high in the Northwest Pacific are among the main causes for the displacements of the landfall locations. When the center of the subtropical high moves towards the northeast and is relatively weak, the landfall locations of tropical cyclones tend to be further north; conversely, they tend to be further south. In recent years, the frequency of tropical cyclones making landfall in low-latitude regions of China has exhibited a significant decreasing trend. This decline may be attributed to the gradual northward shift in the landfall locations of tropical cyclones in the Northwest Pacific (Chen et al., 2022). Concurrently, there is an observable northward trend in the locations where tropical cyclones reach their maximum intensity (Kossin and Emanuel, 
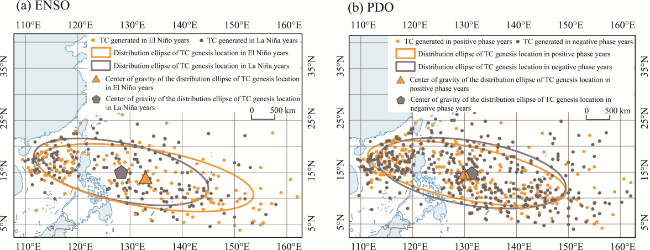
2014), implying that mid- and high-latitude regions of China may now face more severe typhoon risks than before. Additionally, the northwestward movement of the genesis locations of tropical cyclones that eventually make landfall in China is noteworthy and requires attention. Choi et al. (2024) found that since 1998, the genesis locations of tropical cyclones in the Northwest Pacific have shifted westward; however, they did not examine latitudinal changes. A closer genesis location to China would significantly reduce the time from genesis to landfall, thereby increasing the potential for rapid-onset damage. During the study period, both the average distance and time from genesis to landfall in China have shown a significant reduction, which imposes higher demands on disaster preparedness and early warning systems in coastal areas.
Although previous studies have not identified a significant linear correlation between tropical cyclone activity and ENSO (Wang et al., 2022), the results of this study indicate that the frequency of tropical cyclones generated in the Northwest Pacific and making landfall in China varies significantly during different ENSO phases. Specifically, during El Niño years, the Intertropical Convergence Zone, which plays a crucial role in tropical cyclone genesis, tends to be less active, leading to environmental conditions unfavorable for tropical cyclone formation. Consequently, the frequency of tropical cyclones is lower during El Niño years than during La Niña years (Lu et al., 2018). In contrast to frequency, the impact of ENSO on the intensity of tropical cyclones, particularly for those making landfall, is less pronounced. While data suggest that tropical cyclones generated during El Niño years may exhibit greater intensity, the factors influencing the formation and intensity of tropical cyclones are likely distinct. Frank et al. (2007) noted that stronger tropical cyclones typically exhibit higher correlations across different ocean basins and demonstrate a more pronounced relationship with ENSO. This also suggests that the factors governing the genesis number of tropical cyclones differ in importance from those ultimately deciding the intensity of tropical cyclones. Regarding the genesis location, this study concludes that tropical cyclones tend to generate further east and south during El Niño years, which is consistent with previous research findings (Gu et al., 2018). However, the ENSO phenomenon is highly complex. In the context of global warming, the impact of ENSO on the climate system has become more pronounced. ENSO events of the same magnitude now lead to more significant anomalies in atmospheric circulation, temperature, and precipitation. This suggests that future ENSO events may result in more severe climate disasters (Hu et al., 2021), and have a stronger influence on tropical cyclone activities. On the other hand, the movement of the accumulated energy of tropical cyclones in the Northwest Pacific can markedly influence the intensity variations of ENSO. The former can impact the latter via channels such as atmospheric circulation and oceanic processes (Wang et al., 2019). Therefore, the future development of ENSO and its specific impacts on tropical cyclone activities warrant further in-depth investigation.
Although both PDO and ENSO are sea surface temperature-based modes, they differ significantly in temporal scales: ENSO events typically last about one year, while PDO characteristics may persist for up to 30 years (Cha et al., 2023). This study reveals that tropical cyclone frequency during PDO warm phases is significantly lower than during cold phases, and Wang and Wang (2023) also demonstrated that variations in tropical cyclone frequency are closely linked to PDO phase transitions. The PDO cold phase generally corresponds to elevated sea surface temperature anomalies in the northwestern Pacific, and such anomalies may influence air-sea interactions through thermal exchange, thereby affecting tropical cyclone intensity. However, this study did not detect a significant correlation between the PDO index and tropical cyclone intensity. This, on the one hand, suggests that the relationship between the PDO and tropical cyclone activities is highly complex. On the other hand, it might be attributed to the fact that the PDO is a long-term ocean-atmosphere climate change pattern (Basconcillo and Moon, 2022), while the time coverage analyzed in this paper is relatively limited. Regarding the genesis location, the source of landfalling tropical cyclones was slightly more westward during the PDO warm phase and was closer to China. Wang et al. (2023) also paid attention to this aspect. The alteration of the genesis location of tropical cyclones resulted in the change of the translation distance, and the abrupt change point of the translation distance of tropical cyclones was consistent with the phase transition time of the PDO.
This study still has the following limitations that require further investigation. First, the research scope is limited to the tropical cyclones that made landfall in China. Some tropical cyclones that did not make landfall but had a considerable influence on China were not accounted for in the statistics. Second, regarding influencing factors, only ENSO and PDO, which significantly affect tropical cyclone activities, were analyzed, while other regulators such as solar activity, aerosols, and the Atlantic Multidecadal Oscillation were not examined. Furthermore, the spatiotemporal characteristics of tropical cyclones are highly complex, being simultaneously influenced by multiple factors that interact with each other. For instance, the PDO can alter the climatic background state of the tropical Pacific, affecting ENSO’s amplitude and frequency, while ENSO can modulate PDO intensity over certain timescales. Therefore, changes in tropical cyclone activity may depend on interactions among these factors, necessitating further studies to comprehensively understand their mechanistic influences.
[1]
Basconcillo J, Moon I J, 2022. Increasing activity of tropical cyclones in East Asia during the mature boreal autumn linked to long-term climate variability. NPJ Climate and Atmospheric Science, 5(1): e4.

[2]
Bhardwaj P, Singh O, 2020. Climatological characteristics of Bay of Bengal tropical cyclones: 1972-2017. Theoretical and Applied Climatology, 139: 615-629.

[3]
Cha Y M, Choi J W, Ahn J B, 2023. Interdecadal changes in the genesis activity of the first tropical cyclones over the Western North Pacific from 1979 to 2016. Climate Dynamics, 60(5/6): 1885-1906.

[4]
Chand S S, Tory K J, McBride J L et al., 2013. The different impact of positive-neutral and negative-neutral ENSO regimes on Australian tropical cyclones. Journal of Climate, 26(20): 8008-8016.

[5]
Chand S S, Walsh K J E, Camargo S J et al., 2022. Declining tropical cyclone frequency under global warming. Nature Climate Change, 12(7): 655-661.

[6]
Chen T, Chen S M, Zhou M S et al., 2022. Northward shift in landfall locations of tropical cyclones over the Western North Pacific during the last four decades. Advances in Atmospheric Sciences, 39(2): 304-319.

[7]
Choi J W and Seo K H, 2024. Interdecadal variation of tropical cyclone genesis longitudes over the Western North Pacific. Climate Dynamics, 62(5): 3965-3975.

[8]
Corporal-Lodangco I L, Leslie L M, Lamb P J, 2016. Impacts of ENSO on Philippine tropical cyclone activity. Journal of Climate, 29(5): 1877-1897.

[9]
Feng L H, 2003. Relationship between tropical cyclones landing in China and sea surface temperature in the Pacific. Acta Geographica Sinica, 58(2): 209-214. (in Chinese)

[10]
Frank W M, Young G S, 2007. The interannual variability of tropical cyclones. Monthly Weather Review, 135(10): 3587-3598.

[11]
Girishkumar M S and Ravichandran M, 2012. The influences of ENSO on tropical cyclone activity in the Bay of Bengal during October-December. Journal of Geophysical Research: Oceans, 117: C02033.

[12]
Grinsted A, Moore J C, Jevrejeva S, 2004. Application of the cross wavelet transform and wavelet coherence to geophysical time series. Nonlinear Processes in Geophysics, 11(5/6): 561-566.

[13]
Gu C L, Kang J C, Yan G D et al., 2018. Variation characteristics of tropical cyclones making landfall over China during 1951-2015 and its relationship with the ENSO. Journal of Catastrophology, 33(4): 129-134, 140. (in Chinese)

[14]
Guan S, Li S, Hou Y et al., 2018. Increasing threat of landfalling typhoons in the Western North Pacific between 1974 and 2013. International Journal of Applied Earth Observation and Geoinformation, 68: 279-286.

[15]
Han Y S, Jiang W, Xiao Y W et al., 2023. Main change characteristics and influencing factors of tropical cyclones under the background of global change. Advances in Earth Science, 38(5): 515-532. (in Chinese)

[16]
He S F, Li Z, Chen C B et al., 2023. Evolution of landing typhoon characteristics and typhoon hazard in Hainan province of China. Progress in Geography, 42(7): 1355-1364. (in Chinese)

[17]
Hu K M, Huang G, Huang P et al., 2021. Intensification of El Niño-induced atmospheric anomalies under greenhouse warming. Nature Geoscience, 14(6): 377-382.

[18]
Hu L, Wen T, Shao Y et al., 2023. Economic impacts of tropical cyclone-induced multiple hazards in China. Earth’s Future, 11(9): e2023EF003622.

[19]
IPCC, 2021. Climate Change 2021: The Physical Science Basis. Cambridge: Cambridge University Press.

[20]
Jin F F, Boucharel J, Lin I I, 2014. Eastern Pacific tropical cyclones intensified by El Niño delivery of subsurface ocean heat. Nature, 516(7529): 82-85.

[21]
Jing R Z, Heft-Neal S, Chavas D R et al., 2024. Global population profile of tropical cyclone exposure from 2002 to 2019. Nature, 626(7999): 549-554.

[22]
Kossin J P, Emanuel K A, Vecchi G A, 2014. The poleward migration of the location of tropical cyclone maximum intensity. Nature, 509(7500): 349-352.

[23]
Kossin J P, Knapp K R, Olander T L et al., 2020. Global increase in major tropical cyclone exceedance probability over the past four decades. Proceedings of the National Academy of Sciences, 117(22): 201920849.

[24]
Lee M, Kim T, Cha D H et al., 2021. How does Pacific decadal oscillation affect tropical cyclone activity over far East Asia? Geophysical Research Letters, 48(24): e2021GL096267.

[25]
Li L, Chakraborty P, 2020. Slower decay of landfalling hurricanes in a warming world. Nature, 587(7833): 230-234.

[26]
Liu K S and Chan J C L, 2020. Recent increase in extreme intensity of tropical cyclones making landfall in South China. Climate Dynamics, 55(5/6): 1059-1074.

[27]
Lu X J, Dong C M, Li G, 2018. Variations of typhoon frequency and landfall position in East China Sea from 1951 to 2015. Transactions of Atmospheric Sciences, 41(4): 433-440. (in Chinese)

[28]
Lu X Q, Yu H, Ying M et al., 2021. Western North Pacific tropical cyclone database created by the China Meteorological Administration. Advances in Atmospheric Sciences, 38(4): 690-699.

[29]
Mei W, Xie S P, 2016. Intensification of landfalling typhoons over the Northwest Pacific since the late 1970s. Nature Geoscience, 9(10): 753-757.

[30]
Nayak S, Takemi T, 2023. Statistical analysis of the characteristics of typhoons approaching Japan from 2006 to 2019. Geomatics, Natural Hazards and Risk, 14(1): 2208722.

[31]
Nie X Y, Tan H J, Cai R S et al., 2023. Projection of the tropical cyclones landing in China in the future based on regional climate model. Climate Change Research, 19(1): 23-37. (in Chinese)

[32]
Pan Wei, Man Zhimin, Liu Dawei et al., 2014. The changing of Chinese coastal typhoon frequency based on historical documents, 1644-1911AD. Geographical Research, 33(11): 2195-2204. (in Chinese)

[33]
Qian Y T, Hsu P C, Murakami H et al., 2024. Intraseasonal variability of anticyclonic Rossby wave breaking and its impact on tropical cyclone activity over the Western North Pacific. Journal of Climate, 37(1): 179-197.

[34]
Su Z H, Fang W H, 2023. Analysis of tropical cyclone exposure changes in coastal areas of China from 1980 to 2015. Journal of Natural Disasters, 32(3): 102-117. (in Chinese)

[35]
Takagi H, Esteban M, 2016. Statistics of tropical cyclone landfalls in the Philippines:Unusual characteristics of 2013 Typhoon Haiyan. Natural Hazards, 80: 211-222.

[36]
Tan K X, Huang P, Liu F et al., 2019. Simulated ENSO’s impact on tropical cyclone genesis over the Western North Pacific in CMIP5 models and its changes under global warming. International Journal of Climatology, 39(8): 3668-3678.

[37]
Tong B, Wang X, Wang D et al., 2023. A novel mechanism for extreme El Niño events: Interactions between tropical cyclones in the Western North Pacific and sea surface warming in the Eastern Tropical Pacific. Journal of Climate, 36(8): 2585-2601.

[38]
Torrence C, Compo G P, 1998. A practical guide to wavelet analysis. Bulletin of the American Meteorological Society, 79(1): 61-78.

[39]
Wang G H, Wu L W, Mei W, 2022. Ocean currents show global intensification of weak tropical cyclones. Nature, 611(7936): 496-500.

[40]
Wang H, Wang C, 2023. What caused the increase of tropical cyclones in the Western North Pacific during the period of 2011-2020? Climate Dynamics, 60(1/2): 165-177.

[41]
Wang L, Gu X, Slater L J et al., 2023. Phase shifts of the PDO and AMO alter the translation distance of global tropical cyclones. Earth’s Future, 11(3): e2022EF003079.

[42]
Wang Q, Li J, Jin F F et al., 2019. Tropical cyclones act to intensify El Niño. Nature Communications, 10(1): 3793.

[43]
Wang X J, Li Q S, 2022. Quantile regression analysis of interannual variation characteristics of landing tropical cyclones in China under the influence of ENSO events. Journal of Tropical Meteorology, 38(1): 11-22. (in Chinese)

[44]
Wu S H, 2023. Research progress in climate change impact, risk, and adaptation: An interpretation of Part 2 of China’s Fourth National Assessment Report on Climate Change. China Population, Resources and Environment, 33(1): 80-86. (in Chinese)

[45]
Xu Z N, Gao X L, 2016. A novel method for identifying the boundary of urban built-up areas with POI data. Acta Geographica Sinica, 71(6): 928-939. (in Chinese)

[46]
Yao X P, Peng S Y, 2023. Research progress and outlook of autumn tropical cyclones over Western North Pacific. Journal of Marine Meteorology, 43(3): 1-8. (in Chinese)

[47]
Yin J, Dai E F, Wu S H et al., 2013. A study on the relationship between typhoon intensity grade and disaster loss in China. Geographical Research, 32(2): 266-274. (in Chinese)

[48]
Zhao Z Q, 2014. Spatial Pattern Statistics and Spatial Economic Analysis. Beijing: Science Press. (in Chinese)

[49]
Zhou M Z, Xu J, 2023. Covariation relationship between tropical cyclone intensity and size change over the Northwest Pacific. Journal of Applied Meteorological Science, 34(4): 463-474. (in Chinese)

Outlines

/