Research Articles

Evaluation of cropland suitability and key potential areas on the Qinghai-Tibet Plateau

  • YANG Hua , 1, 2 ,
  • XU Yong , 1, 2, * ,
  • LI Jiuyi 1, 2 ,
  • ZHOU Kan 1, 2
Expand
  • 1. Key Laboratory of Regional Sustainable Development Modeling, Institute of Geographic Sciences and Natural Resources Research, CAS, Beijing 100101, China
  • 2. University of Chinese Academy of Sciences, Beijing 100049, China
*Xu Yong (1964-), PhD and Professor, specialized in mechanistic modeling of land use and human-land relationships, and carrying capacity of resources and environment. E-mail:

Yang Hua (1995-), specialized in mechanistic modeling of land use and human-land relationships, and territorial function zoning. E-mail:

Received date: 2024-07-16

  Accepted date: 2025-01-23

  Online published: 2025-04-28

Supported by

The Second Tibetan Plateau Scientific Expedition and Research Program(2019QZKK0406)

Abstract

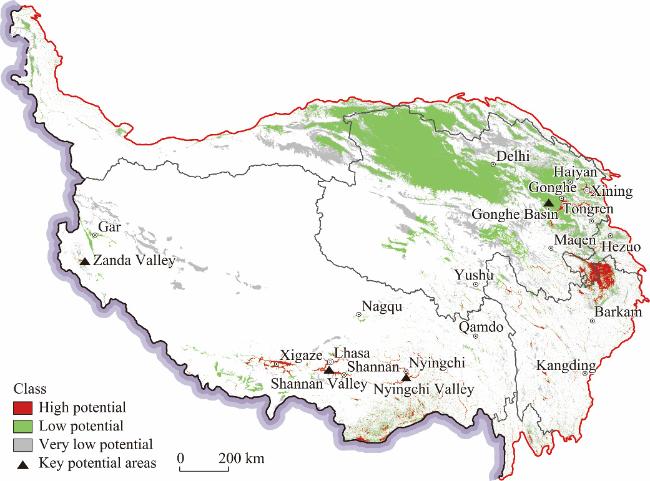
Cropland suitability analysis is a vital tool for ensuring food security and sustainable agriculture, coordinating ecological space with human activity space on the Qinghai-Tibet Plateau (QTP). However, there are few studies on complete and accurate cropland suitability assessments on the QTP, let alone on identifying key potential areas for cropland development. We used a novel assessment model to generate a 30-m cropland suitability map for the QTP. The identification of areas with cropland development potential and the evaluation of potentially available cropland were further integrated into a unified analytical framework. We found that only 10.18% of the study area is suitable for large-scale and permanent cropland. Moreover, approximately 72.75% of the existing cropland was found to be distributed in suitable or marginally suitable areas. Considering the trade-offs related to irrigation water supply convenience, approximately 1.07% of the study area was identified as having high potential for cropland development. Four key potential areas were further identified: the Shannan Valley, the Nyingchi Valley, the Zanda Valley, and the Gonghe Basin. These areas boast abundant potentially available cropland resources and ecological resettlement capacities, which leads us to recommend strategic priorities for comprehensive land consolidation and water development. This study has practical significance for optimizing land resource allocation and guiding decision-making related to ecological migration on the QTP.

Cite this article

YANG Hua , XU Yong , LI Jiuyi , ZHOU Kan . Evaluation of cropland suitability and key potential areas on the Qinghai-Tibet Plateau[J]. Journal of Geographical Sciences, 2025 , 35(4) : 800 -820 . DOI: 10.1007/s11442-025-2347-y

1 Introduction

Ensuring food security and sustainable agriculture is crucial for achieving the Sustainable Development Goals by 2030 (United Nations, 2015; FAO, 2016). As significant land resources for collecting and producing food, feed, fiber, and fuel to meet human needs, rational cropland development and utilization are of great importance for increasing crop yields and safeguarding food security (Eitelberg et al., 2015; Zabel et al., 2019). The Qinghai-Tibet Plateau (QTP), known as the “Third Pole of the Earth”, also serves as an important highland agricultural and pastoral region (Chen et al., 2021). However, due to population growth, rising living standards, and changes in dietary structure, the balance between food production and demand on the QTP has become increasingly challenging (Ding et al., 2022; Duan et al., 2023). Furthermore, unreasonable cropland expansion has led to the loss of forests and grasslands, a decrease in biodiversity, and soil erosion in certain areas (Sun et al., 2012; Fan et al., 2015). Since the 1980s, the Chinese government has carried out comprehensive land development projects in the regions of the Yarlung Zangbo, Lhasa, and Nyangchu rivers in Xizang and the Yellow River-Huangshui River Valley region in Qinghai (Duan et al., 2019). However, the coverage of these projects is limited, and the population benefiting from them is small. The population and urbanization rate on the QTP are expected to markedly increase, further escalating the demand for food and cropland (Fang, 2022). Therefore, in view of the above problems, the best solution is to identify the suitable spaces and key potential areas for cropland development, which will help policymakers formulate the most suitable plan for the right regions. To our knowledge, there are almost no complete reports on suitable cropland of the QTP, and the key potential areas for cropland development remain unclear, which may hinder scientific decision-making.
Land suitability analysis serves as a critical foundation and technical tool in land evaluation and land use planning, aiming to determine whether a given type of land is suitable for a defined use, such as rain-fed or irrigated cropland, extensive grazing, and forestry (FAO, 1976). Among these, the suitability analysis for agricultural land is the most common component of land suitability assessment (Akpoti et al., 2019). Typically, the agricultural land suitability analysis typically focuses on two areas: the planting of specific crops like rice and wheat (Li et al., 2023), and the farming of arable land (Yao et al., 2021; Zhang et al., 2022; Zhu et al., 2022). The multi-criteria decision analysis (MCDA) technique is the most popular and widely used analytical method and framework for land suitability assessment (Akpoti et al., 2019). The MCDA analysis procedure typically involves five stages: goal, decision-maker preferences, alternatives, criteria, and outcomes (Malczewski, 2006). Both decisionmaker preferences and evaluation criteria play pivotal roles in the accuracy of MCDA. Most studies allocate weights to different criteria based on the significance or priority of decision goals, using methods like Hierarchical Analysis (Romano et al., 2015), Fuzzy Logic Techniques (Budak et al., 2024), and the Best-Worst Method (Uyan et al., 2023), which are commonly employed. Evaluation criteria slightly differ depending on the decision goals, but they can be categorized into four types: climate, soil, water resources, and socio-economic and technical requirements (Akpoti et al., 2019). With the advancement of spatial analysis technology and geographic observation data, machine learning algorithms such as Random Forest, Artificial Neural Networks, and Maximum Entropy modeling are considered promising land suitability analysis methods (Yin et al., 2022; Li et al., 2023; Zhu et al., 2023). However, both traditional and novel approaches face several challenges. MCDA is limited by research scale, criteria selection, weight allocation, and data validity (Nguyen et al., 2015; Akpoti et al., 2019). The effectiveness of machine learning methods in indicating land suitability is still debated, as their results are often considered more aligned with observed land use (Møller et al., 2021).
Differing from the plains at low altitudes, differences in oxygen levels and temperature, or heat, affected by topographic elevation, are key factors influencing the human activity suitability on the QTP. Xu et al. (2023) developed an analytical framework for this characteristic to express cropland suitability by reflecting both elevation and slope in the vertical direction. This framework replaces elevation and slope with corresponding temperature and soil erosion characteristics, transforming topographic elements into a parametric model of cropland suitability analysis. This model has the advantages of simplicity, requiring few parameters, and being deployable quickly at large scales. It is important to note that this model does not consider the productivity of specific crops but simply whether the land characteristics allow farming.
It is worth noting that while several studies worldwide have explored land suitability for cropland and specific crops farming, such studies have been relatively scarce on the QTP. Only a few preliminary studies have been conducted, including an analysis of arable land suitability for the entire QTP and its crucial areas, such as the regions of the Yarlung Zangbo, Lhasa, and Nyangchu rivers in Xizang (Jin et al., 2014; Yao et al., 2021), as well as the planting suitability and potential distribution of crops such as highland barley and pepino (Yin et al., 2022; Hou et al., 2023). Currently, both central and local governments are committed to ecological migration to enhance ecological protection and residents’ well-being, and there is an urgent need to identify suitable land for large-scale settlement (Zang et al., 2022). In this context, this research aims to answer two questions: (1) Which areas of the QTP are suitable for cultivation? (2) Are there key areas for new cropland development and population settlement? To answer these questions, we evaluated the cropland suitability across QTP, identified the high-priority potential areas considering the irrigation water supply convenience, and calculated the potentially available cropland of proposed key potential areas. The findings will provide decision-making support for optimizing land resource allocation and ecological migration on the QTP.

2 Materials and methods

2.1 Study area

The QTP spans six provincial-level regions: Xizang, Qinghai, Sichuan, Gansu, Xinjiang, and Yunnan. It covers an area of approximately 2.58 million km², or about 26.9% of China’s land area. QTP is also the highest highland, with 73% of its area above 4000 m (Figure 1). The climate is characterized by dry and cold conditions, with annual mean temperatures ranging from 6-20℃ and annual precipitation from 20-4500 mm. Highland barley, wheat, and maize are the main grain crops, harvested once a year. Farming activities are mainly concentrated in the regions of the Yarlung Zangbo, Lhasa, and Nyangchu rivers, the Yellow River-Huangshui River Valley, and some valleys in the Hengduan Mountains.
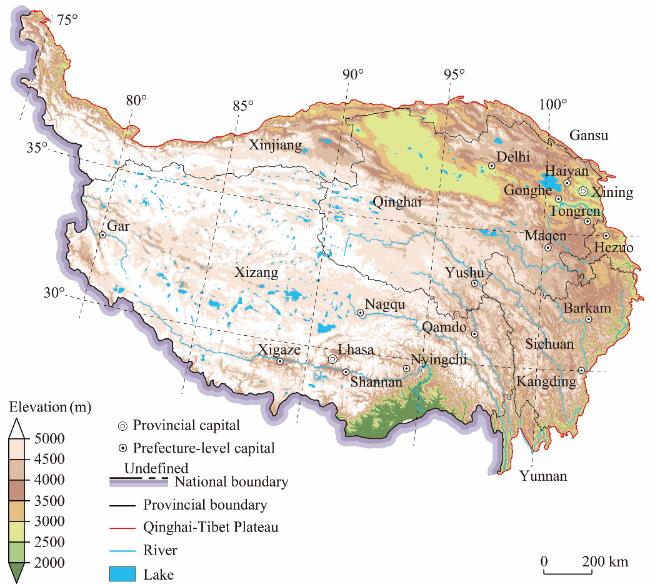
Figure 1 Topographic elevation of the Qinghai-Tibet Plateau (QTP)

Note: This map is based on the standard map GS (2022) 4312 of the Map Technical Review Center of the Ministry of Natural Resources, with no modifications to the boundaries of the base map.

2.2 Data sources

Table 1 presents the data sources used in this study. The land use data primarily come from the second land use survey data of Xizang and the third national land resource survey data of Qinghai, while data from other regions are supplemented with remote sensing monitoring data of land use in China (CNLUCC). To ensure consistency in land use types, we used the more universal CNLUCC classification system, consolidating the types from different land survey data into six categories: construction land, cropland, forest land, grassland, water bodies, and unused land. Notably, construction land includes urban and rural land, industrial and mining land, and transportation land, as defined in the classification system. Additionally, because garden land is quite rare in this region, we combined it with cropland. Unused land corresponds to other land types in the classification system, including bare land, vacant land, bare rocky and gravel land, sandy land, salt-affected land, and marshland. The vector data were converted to raster format, and all data were resampled to 30 m resolution. All data were projected using the Albers projection, with standard parallels of 25°N and 47°N.
Table 1 Data sources
Dataset Type Spatial
scale
Spatial
resolution
Temporal
resolution
Sources
Digital elevation model (DEM) Raster QTP 30 m 2023 FABDEM version 1-2 (Hawker et al., 2022; Neal et al., 2023)
Topographic slope Raster QTP 30 m 2023 FABDEM version 1-2
The second land use survey data of
Xizang
Vector Xizang - 2018 Department of Natural Resources of Xizang Autonomous Region
The third national land resource survey data of Qinghai Vector Qinghai - 2019 Department of Natural Resources of Qinghai Province
Remote sensing monitoring data of land use in China Raster Sichuan, Gansu, Xinjiang, and Yunnan 30 m 2020 Data Registration and Publishing System of the Resource and Environmental Science Data Center of the Chinese Academy of Sciences (https://www.resdc.cn/) (Xu et al., 2018)
State-level nature reserves Vector QTP - 2021 Forestry and grassland administration of QTP provinces
QTP boundary Vector QTP - - Global Change Research Data Publishing and Repository website (http://www.geodoi.ac.cn)
Natural river
networks
Vector QTP - 2013 HydroATLAS (https://www.hydrosheds.org/hydroatlas) (Lehner et al., 2013)

2.3 Methodological framework and methods

This research establishes an explicit analytical framework for evaluating cropland suitability and identifying key potential areas (Figure 2). The framework is divided into four stages: (1) Defining classifications and thresholds for elevation and slope to map the corresponding temperature parameters and the soil erosion resistance coefficient for sloping cropland. (2) Generating a cropland suitability map through the suitability index calculation, further validated against the existing cropland layer to confirm its matching characteristics. (3) Based on the assessment results of cropland suitability and irrigation water supply convenience, cropland development potential areas with convenient access to irrigation water are identified using a four-quadrant model. The key potential areas are further identified from high potential regions by considering regional development degree and ecological constraints. (4) Evaluating potentially available cropland in the key potential areas by accounting for ecological and social costs, i.e., excluding land restricted by regulations and costs.
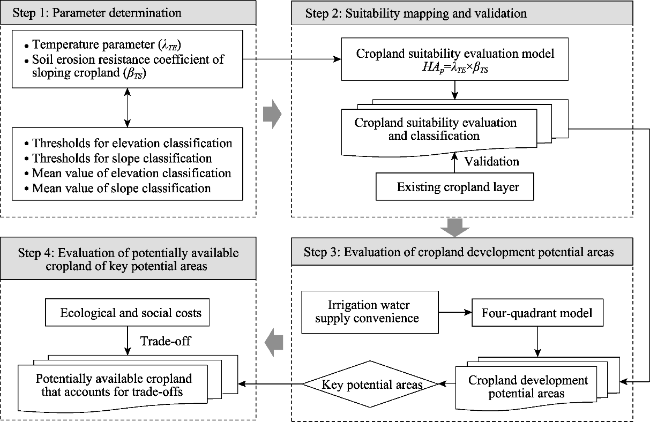
Figure 2 Principal stages of the research

2.3.1 Suitability evaluation models and parameters

The growth and development of crops are influenced by a combination of factors, including climate, soil, topography, and agricultural management (Yang et al., 2022; Li et al., 2023). However, within the context of the QTP, the primary limitation to crop cultivation is the restricted accumulated temperature due to high elevation. Xu et al. (2023) constructed a cropland suitability assessment model consisting of the temperature parameter and the soil erosion resistance coefficient of sloping cropland. The temperature parameter is derived from a linear function of standardized temperature values and topographic elevation, reflecting the climatic productivity of crops at various altitudes. As elevation increases, temperatures decline, and consequently, the accumulated temperature, which is closely linked to crop productivity, also decreases. The soil erosion resistance coefficient of sloping cropland is a characteristic value that inversely represents the relationship between soil erosion on cropland and the terrain slope. It is calculated through a quadratic function of the normalized soil erosion modules of crops and terrain slope, representing the potential soil erosion risk and environmental sustainability of agricultural lands across different slopes. Their product represents the comprehensive suitability index. The formulas are as follows:
H A p = λ T E × β T S
λ T E = 1.999 0.0002 T E
β T S = 0.535 0.0097 T S 0.0002 T S 2
where HAp is the cropland suitability index, λTE is the temperature parameter, βTS is the coefficient of soil erosion resistance of sloping cropland. TE is the average value of elevation class, and T E 2000 , 5000. TS is the average value of slope class. T S 0 , 30, and when TS≥30°, βTS = 0.
The elevation and slope classification referred to the scheme of existing studies (Yang et al., 2023), while maintaining consistency with the slope classification used in the territory spatial planning and cultivated land quality evaluation being implemented in China (Fan, 2019; Ministry of Natural Resources of China, 2019). The elevation was divided into eight classes: ≤2000 m, 2000-2500 m, 2500-3000 m, 3000-3500 m, 3500-4000 m, 4000-4500 m, and ≥5000 m, and the slope was divided into eight classes: ≤3°, 3°-5°, 5°-8°, 8°-12°, 12°-15°, 15°-20°, and ≥25°. The suitability map based on this simplified classification scheme has the advantages of acceptable accuracy loss, as well as better patch integrity and consistency (Yang et al., 2023).
The topographic elevation and slope were spatially overlaid, followed by the input of the corresponding temperature parameters (λTE) and the coefficient of soil erosion resistance of sloping cropland (βTS) for each elevation and slope classification, respectively, leading to the calculation of cropland suitability index (HAp). The suitability priority was classified into five classes: highly suitable, suitable, moderately suitable, marginally suitable, and currently not suitable. (1) The highly suitable class has almost no limitations for cropland use. (2) The suitable class is significantly inferior to the highly suitable class. (3) The moderately suitable class has moderately severe limitations for cropland use. (4) The marginally suitable class has severe limitations for sustaining cropland, which are only marginally justifiable. (5) The currently not suitable class has limitations so severe that they preclude the farming possibilities, but its priority could increase with climate change and technological advancements.

2.3.2 Evaluation model of irrigation water supply convenience

Water resources are crucial for agriculture, and a sustainable irrigation water supply is a key consideration in the spatial layout of agricultural production (Dalin et al., 2015). Agricultural spaces are primarily concentrated in river valley areas of the QTP, where irrigation predominantly relies on water diversion projects. Consequently, the cost of water supply is a major determinant of irrigation convenience. Li (2022) developed an assessment model for irrigation water supply convenience to characterize the spatial variability of water resource conditions. This model simulates the minimum water supply cost for each grid to identify optimal water supply routes. Within the model, the convenience of the irrigation water supply is a function of water source reliability and supply cost. The volume of water resources determines the reliability of irrigation water sources; greater volumes result in higher reliability. On the other hand, the cost of the irrigation water supply is related to the distance and lifting height of the water source. The shorter the distance and the lower the lifting height, the lower the supply cost. The formula is as follows:
C i = i d A i D A m a x + i h A i H A m a x
where Ci is the index of irrigation water supply convenience in grid i, simulated using the Path Distance tool in ArcGIS Pro software. dAi and hAi are the distance and lifting height of the natural river networks under the optimal water supply path, respectively. DAmax and HAmax are the maximum distance and lifting height accepted by water supply, set to 40 km and 60 m, respectively (Liu et al., 2023). The vertical factor is a tangent function of the vertical relative moving angle. Considering the sustainability and ecological impact of large-scale water resource utilization, the irrigation water source is defined as river sections with a long-term average runoff of ≥20 m3/s. Ci represents the ratio of potential water supply cost to affordable cost, ranging from 0-1. A higher Ci value indicates lower water supply convenience. When Ci reaches 1, the potential water supply cost has reached a critical value, and any area exceeding this threshold will face an economically unfeasible irrigation water supply. Ci is classified into three levels: 0-0.5 (high), 0.5-1 (moderate), and ≥1 (low).

2.3.3 The four-quadrant model for identifying cropland development potential areas

The four-quadrant model is a method that combines both qualitative and quantitative analyses to examine the relationship between two variables (Sun et al., 2020; Lv et al., 2024). It is an effective tool for identifying areas with potential for cropland development, supported by a sustainable water supply. In this model, cropland suitability is plotted on the X-axis and irrigation water supply convenience on the Y-axis, resulting in four quadrants (Figure 3). The first quadrant represents high-potential areas (high suitability, high convenience). The second quadrant represents low-potential areas (low suitability, high convenience). The third quadrant represents very low-potential areas (low suitability, low convenience). The fourth quadrant represents low-potential areas (high suitability, low convenience). For cropland suitability, the high-level includes three suitability classes: highly suitable, suitable, and moderately suitable, with a suitability index ≥0.22; the low-level corresponds to the marginally suitable class, with a suitability index of 0.16-0.22; the currently not suitable class is excluded. For irrigation water supply convenience, the high-level includes two convenience classes: high and moderate, with a convenience index of 0-1; the low-level corresponds to the low convenience class, with a convenience index ≥1. Table 2 shows the classes of cropland suitability and irrigation water supply convenience corresponding to different levels of cropland development potential.
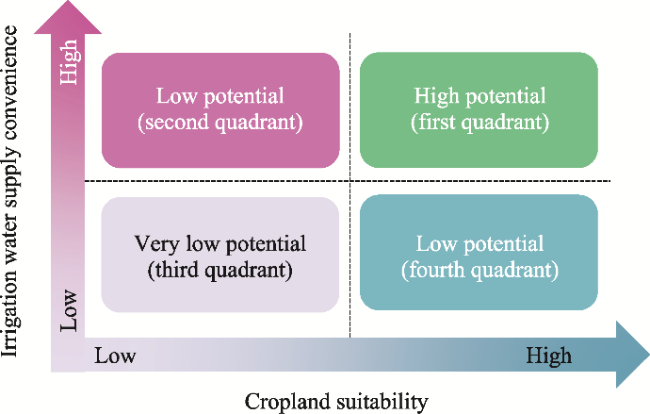
Figure 3 The four-quadrant model for evaluating the cropland development potential
Table 2 Four-quadrant partition table of cropland suitability and irrigation water supply convenience
Irrigation water
supply
convenience
Cropland suitability
Highly suitable Suitable Moderately suitable Marginally suitable Currently not suitable
High High potential High potential High potential Low potential -
Moderate High potential High potential High potential Low potential -
Low Low potential Low potential Low potential Very low potential -

2.3.4 Evaluation model of potentially available cropland

Investigating the extent and spatial location of potential land resources that could be converted into cropland in the future is a crucial research task in land-use modeling (Eitelberg et al., 2015). Within most land-use models, the transformation of land systems into cropland is constrained by a matrix encompassing a range of societal, political, economic, and physical limitations (Lambin et al., 2013). We used a trade-off analysis method to provide a spatially explicit potential dataset (Breure et al., 2024): the potentially available cropland that accounts for trade-offs (PACt) (Schneider et al., 2022). Initially, PACt excludes settlements, infrastructure, and existing cropland that are technically challenging or unlikely to be cultivated or further converted into cropland. Subsequently, forests, water bodies, wetlands, and protected areas are excluded from PACt due to strict legal restrictions aimed at protecting fragile ecosystems. Further consideration was given to the potential for land consolidation and hydraulic engineering construction to enhance the irrigation capacity of cropland, with tidal flats incorporated into the PACt framework. Lastly, we considered the scale and intensity of cropland development, excluding land patches smaller than 0.1 km2 to avoid fragmented patches lacking the capacity for large-scale development. All estimates were subject to the same CLS constraints, specifically the highly suitable, suitable, and moderately suitable classes.
P A C t = A s A c A a l A w A f A p A p a t c h
where PACt refers to the potentially available cropland that accounts for trade-offs (PACt). As represents the areas of highly suitable, suitable, and moderately suitable classes in cropland suitability. Ac represents construction land, including settlements and transportation land. Aal represents the existing cropland. Aw represents water bodies and wetlands, excluding tidal flats. Af represents forests. Ap refers to state-level nature reserves. Apatch refers to land patches smaller than 0.1 km².

3 Results

3.1 Results of the cropland suitability assessment

Based on the characteristics of crop growth and agricultural distribution on the QTP, the cropland suitability index is classified into five classes, using thresholds of ≥0.37 (highly suitable), 0.30-0.37 (suitable), 0.22-0.30 (moderately suitable), 0.16-0.22 (marginally suitable), and ≤0.16 (currently not suitable). Figure 4 shows the elevation and slope distribution across the different suitability classes. Except for the currently not suitable class, the other classes are constrained by maximum elevation and slope thresholds. The maximum elevations for the highly suitable, suitable, moderately suitable, and marginally suitable classes are 2500 m, 3000 m, 4000 m, and 4500 m, respectively, while the maximum slopes are 6°, 15°, 20°, and 25°, respectively.
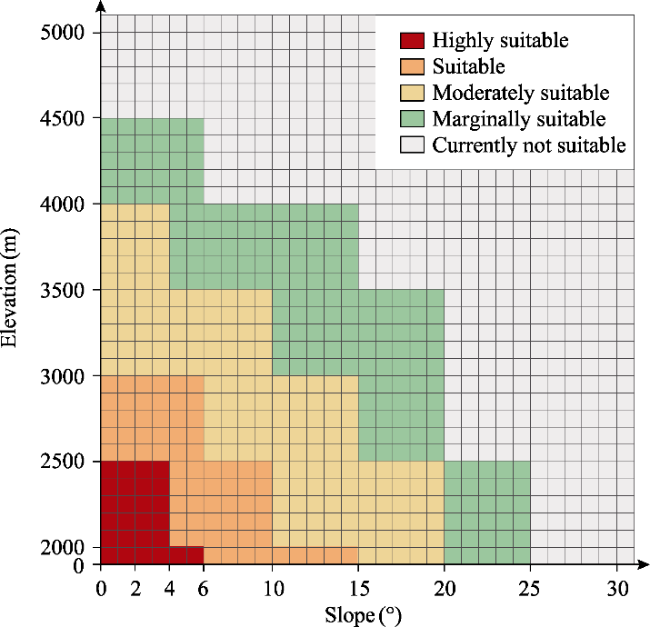
Figure 4 Corresponding relationships between cropland suitability and elevation and slope
Figure 5 and Table 3 present the spatial distribution of cropland suitability classes and their respective areas on the QTP. The highly suitable, suitable, moderately suitable, marginally suitable, and unsuitable CLS classes cover areas of 4133 km² (0.16%), 103,210 km² (4.00%), 155,511 km² (6.02%), 212,639 km² (8.23%), and 2,106,808 km² (81.59%) of the total area, respectively. Only 10.18% of the land is classified as highly suitable, suitable, and moderately suitable class, while at least 81.59% is considered unsuitable for sustainable cultivation under current economic and technological conditions.
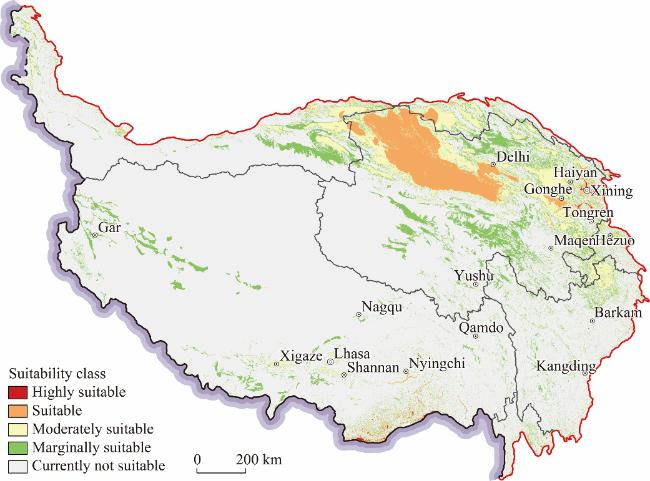
Figure 5 Spatial distributions of each cropland suitability class

Note: This map is based on the standard map GS (2022) 4312 of the Map Technical Review Center of the Ministry of Natural Resources, with no modifications to the boundaries of the base map.

Table 3 Area of each cropland suitability class
Regions Highly suitable Suitable Moderately suitable Marginally suitable Currently not suitable
Area
(km2)
Ratio
(%)
Area
(km2)
Ratio
(%)
Area
(km2)
Ratio
(%)
Area
(km2)
Ratio
(%)
Area
(km2)
Ratio
(%)
Xizang 2456 0.20 4530 0.38 12,719 1.06 42,949 3.57 1,139,431 94.79
Qinghai 1165 0.17 92,032 13.25 84,009 12.09 98,619 14.19 418,992 60.30
Sichuan 214 0.08 658 0.26 12,583 4.94 22,032 8.65 219,208 86.07
Xinjiang 118 0.04 2001 0.66 22,508 7.42 30,298 9.99 248,380 81.89
Gansu 76 0.08 3679 3.93 22,127 23.66 15,668 16.76 51,957 55.56
Yunnan 104 0.31 311 0.92 1566 4.62 3074 9.07 28,841 85.09
QTP 4133 0.16 103,210 4.00 155,511 6.02 212,639 8.23 2,106,808 81.59
The highly suitable class is distributed in the low-altitude valleys of southeastern Xizang and the Yellow River-Huangshui River Valley in Qinghai, covering 2456 km² and 1165 km², respectively. The suitable class is distributed in the Qaidam Basin, the Yellow River- Huangshui River Valley, and the Gonghe Basin in Qinghai, covering 89.17% of the total suitable area on the QTP. The moderately suitable class is distributed in the Gonghe Basin, the Qinghai Lake Basin, the peripheral areas of the Qaidam Basin in Qinghai, the valleys of Lhasa, Shannan, and Xigaze in Xizang, and the Songpan Plateau in Sichuan. The marginally suitable class is distributed in the intermountain valleys of the Qilian Mountains and the southern Qinghai Plateau in Qinghai, the intermountain basins of the Kunlun Mountains in Xinjiang, and the intermountain valleys of the Gangdis Mountains, the northern Tibet Plateau, and the Himalayan Mountains in Xizang. The currently not suitable class extends throughout the QTP, predominantly in the northern Tibet Plateau, the Gangdis Mountains, the Himalayan Mountains, the alpine-gorge regions in Xizang, the Kunlun Mountains in Xinjiang, and the Hengduan Mountains in Sichuan.

3.2 Matching analysis results between suitability map and existing cropland layer

The suitability map was spatially overlaid with the existing cropland layer. Figure 6 shows the spatial distribution of existing cropland in the currently not suitable class of cropland suitability, and Table 4 reports the existing cropland area in each suitability class. The total area of cropland on the QTP is 17,955 km2, of which 72.75% is distributed in the highly suitable, suitable, moderately suitable, and marginally suitable classes. However, 4892 km² of this cropland, accounting for 27.25% of the total, is distributed in areas considered unsuitable for farming. The existing cropland in Qinghai and Gansu shows a higher degree of matching, with unsuitable cropland mainly located in the Yellow River-Huangshui River Valley and the southern Gansu Mountains. In contrast, the cropland in Sichuan, Xizang, and Yunnan exhibits low matching with suitable areas, with unsuitable land predominantly found in the alpine-gorge region and the southern valleys in Xizang.
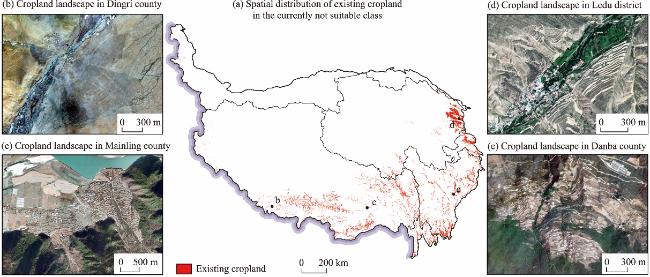
Figure 6 Spatial distribution of existing cropland in the currently not suitable class. The samples of cropland landscape are located in (b) Dingri county (28°30°51.08''N, 86°29°29.45''E), (c) Mainling county (29°25°58.34''N, 94°31°24.00''E), (d) Ledu district (36°22°6.82''N, 102°16°13.35''E), and (e) Danba county (30°52°4.80''N, 101°52°56.14''E), respectively. Remote sensing imagery used the World Imagery serviced by ESRI.

Note: This map is based on the standard map GS (2022) 4312 of the Map Technical Review Center of the Ministry of Natural Resources, with no modifications to the boundaries of the base map.

Table 4 Area of existing cropland in each cropland suitability class
Regions Highly suitable Suitable Moderately suitable Marginally suitable Currently not suitable
Area
(km2)
Ratio
(%)
Area
(km2)
Ratio
(%)
Area
(km2)
Ratio
(%)
Area
(km2)
Ratio
(%)
Area
(km2)
Ratio
(%)
Xizang 508 9.70 248 4.74 1776 33.90 1535 29.30 1171 22.36
Qinghai 339 5.61 1294 21.40 3093 51.13 855 14.14 467 7.72
Sichuan 64 1.57 180 4.43 877 21.63 699 17.24 2236 55.13
Xinjiang 2 2.01 7 6.75 84 79.77 7 6.74 5 4.74
Gansu 28 1.99 231 16.48 476 33.87 282 20.06 388 27.60
Yunnan 28 2.55 82 7.46 230 20.91 136 12.35 625 56.74
QTP 969 5.40 2043 11.38 6537 36.41 3515 19.57 4892 27.25

3.3 Evaluation results of cropland development potential areas

Figure 7 shows the spatial distribution of the different classes of irrigation water supply convenience. By considering the trade-offs between water source quantity and water supply cost, the high and moderate convenience classes cover areas of 79,452 km² and 74,141 km², respectively, accounting for 3.08% and 2.87% of the total area. In contrast, 94.05% of the land has very low convenience. Spatially, the areas of high and moderate classes are primarily distributed in the valleys of exoreic rivers and their tributaries, where the constraining terrain results in high irrigation water supply costs, thus severely limiting the extent of these areas. In contrast, regions such as the northern Tibet Plateau, the Qaidam Basin, the Qilian Mountains, and the Kunlun Mountains have almost no rivers that are considered reliable for irrigation. This is because the rivers in these areas are mainly endorheic, and large-scale exploitation of water resources may lead to severe ecological impacts, resulting in low reliability of irrigation water supplies.
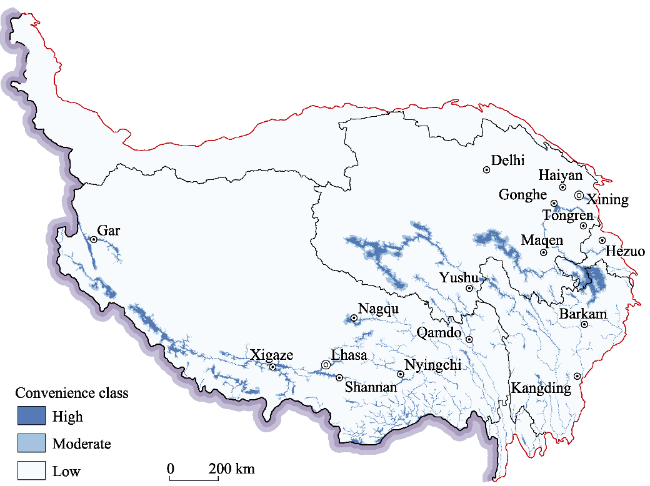
Figure 7 Spatial distributions of each class of irrigation water supply convenience

Note: This map is based on the standard map GS (2022) 4312 of the Map Technical Review Center of the Ministry of Natural Resources, with no modifications to the boundaries of the base map.

Based on the irrigation water supply convenience analysis, the cropland development potential areas of the QTP were mapped using a four-quadrant model (Figure 8). Table 4 reports the class area of cropland development potential. The areas with high, low, and very low potential for cropland development are 27,759 km², 270,068 km², and 177,666 km², respectively, accounting for 1.07%, 10.46%, and 6.88% of the total area of the QTP. High- potential areas are primarily located in the Yarlung Zangbo River valleys in Lhasa, Shannan, Xigaze, Nyingchi, and Zanda, the Yellow River-Huangshui River Valley, the Songpan Plateau, and some small valleys in the alpine gorge region, which possess the potential for large-scale cropland development projects due to their high cropland suitability and convenient irrigation water supply conditions. Low-potential areas are mainly found in the Qaidam Basin, where cropland suitability is high, but water scarcity reduces the priority for large-scale agricultural development. Very low-potential areas are mostly in the northern Tibet Plateau, the southern Qinghai Plateau, the Kunlun Mountains, and some valleys in the Qilian Mountains, where both cropland suitability and water resources are severely constrained.
Figure 8 Spatial distribution of cropland development potential classes and key potential areas

Note: This map is based on the standard map GS (2022) 4312 of the Map Technical Review Center of the Ministry of Natural Resources, with no modifications to the boundaries of the base map.

By comprehensively considering factors such as the degree of regional development, restrictions from nature reserves, and the scale of the areas, we identified four key potential areas within high-potential areas for cropland development: the Shannan Valley, the Nyingchi Valley, the Zanda Valley, and the Gonghe Basin. The spatial locations of these four areas are indicated in figure 8 using black triangle symbols. These proposed key potential areas have not yet undergone large-scale development and face fewer ecological restrictions, making them suitable for comprehensive land consolidation and water development projects at both national and regional levels. The regions around the Yarlung Zangbo, Lhasa, and Nyangchu rivers in Xizang, as well as the Yellow River-Huangshui River Valley in Qinghai have historically been major centers of human activity, where numerous large-scale land development and consolidation projects have been implemented. These include the comprehensive development of the central basin of the Yarlung Zangbo, Lhasa, and Nyangchu rivers, the high-standard cropland consolidation in the Huangshui River Valley, and the development and consolidation of million-acre land in the Yellow River Valley. As a result, the population density and development level in these areas are already high, making them unsuitable for further prioritization of cropland expansion. Although the mainstream valley of the Yarlung Zangbo River in Xigaze is geographically similar to the Shannan Valley, it lies within an important national nature reserve for the black-necked crane. The Songpan Plateau demonstrates high suitability and development potential in terms of terrain, climate, and water supply, but it is occupied by important pastures and is part of nature reserves. Some valleys in the Hengduan Mountains are too small, and most of the suitable land has already been developed for agriculture and thus should not be prioritized.

3.4 Evaluation results of potentially available cropland in key potential areas

Figure 9 shows the spatial distribution of PACt in the four proposed key potential areas: Shannan Valley, Nyingchi Valley, Zanda Valley, and the Gonghe Basin. Table 5 reports the PACt area and their components across different elevation ranges.
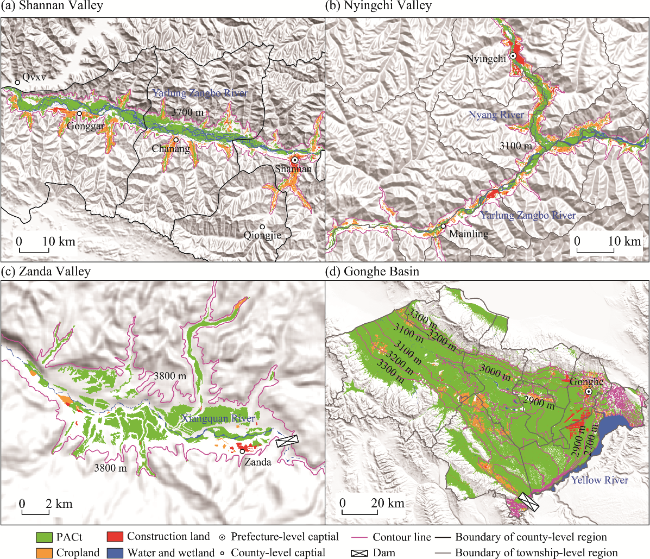
Figure 9 Spatial distribution of potentially available cropland that accounts for trade-offs (PACt) in the key potential areas
Table 5 Area of the potentially available cropland that accounts for trade-offs (PACt) in the key potential areas
Key potential areas Elevation (m) Grassland Tidal flats Unused land PACt
(km2)
Area
(km2)
Ratio
(%)
Area
(km2)
Ratio
(%)
Area
(km2)
Ratio
(%)
Shannan Valley ≤3700 69 21.13 231 70.30 28 8.57 328
Nyingchi Valley ≤3100 31 20.48 114 75.87 5 3.64 150
Zanda Valley ≤3800 20 65.50 4 12.27 7 22.23 30
Gonghe Basin 2900-3000 1087 82.36 14 1.10 218 16.55 1320
3000-3100 1410 90.12 19 1.19 136 8.69 1565
3100-3200 811 91.23 11 1.23 67 7.54 889
The Shannan Valley is a broad valley formed by the alluvial action of the Yarlung Zangbo River, extending across Gonggar, Chanang county, Naidong, and Qiongjie county in Shannan city (Figure 9a). In terms of climatic conditions, the accumulated temperature in this region supports the growth of annual crops. However, the development of irrigation farming here faces significant constraints due to inadequate precipitation. With the construction of feasible hydraulic projects, the substantial river runoff from the Yarlung Zangbo River and the Lhasa River can provide water sources for irrigation. The PACt area below 3700 m altitude in Shannan Valley is 328 km², 70.3% of which consists of river tidal flats, making it the area with the highest potential for cropland development in Xizang.
The Nyingchi Valley, formed by the alluvial action of the Yarlung Zangbo River and Nyang River, extends across Mainling county and Bayi district of Nyingchi city (Figure 9b). At a relatively low altitude, the valley experiences minimal biophysical constraints on crop growth. Fluvial processes have resulted in substantial alluvial land, offering a wealth of potential cropland for agricultural development. Moreover, this region is strategically close to China’s borders, making the effective development of cropland important for national defense. In this region, the PACt area below 3100 m encompasses 150 km², of which 75.87% consists of river tidal flats.
The Zanda Valley, located in Zanda county in Ngari, is carved by the flow of the Xiangquan River (Figure 9c). The PACt area below 3800 m in Zanda Valley is approximately 30 km2, 65.5% of which consists of grassland. This region has high potential for cropland development, with increased irrigation capacity due to better light and heat conditions, as well as higher runoff from the Xiangquan River. Similar to the Nyingchi Valley, cropland development in this region is equally important for national defense.
The Gonghe Basin, located near the Yellow River and distributed across nine townships in Gonghe and Xinghai counties, is characterized by relatively low elevation and aboundant sunlight and land resources (Figure 9d). However, the region also faces serious issues, including an arid climate, grassland degradation, and severe land desertification. The shortage of water resources further restricts cropland expansion. Expanding the scale of the water diversion project from the Yellow River and improving the agricultural irrigation capacity would significantly enhance this region’s agricultural development potential. The PACt area between 2900-3200 m in Gonghe Basin is 3774 km2, 87.67% of which consists of grassland, which remains considerable even when considering only the low-altitude area between 2900-3000 m.

4 Discussion

4.1 Spatial differences in the cropland suitability

Historically, agricultural geography studies about the QTP have predominantly focused on the distribution patterns of various sectors, with scant attention given to agricultural suitability (The Tibetan Plateau Scientific Expedition of Chinese Academy of Sciences, 1984). While early studies have explored the suitability for crop cultivation on the QTP (Yin et al., 2022; Hou et al., 2023), the broader concept of cropland suitability as a land-use attribute has received little attention (Yao et al., 2021). This research represents the first application of human activity suitability of land resource evaluation models across the QTP (Xu et al., 2023). The results indicate that this model has high user accuracy, with at least 72.75% of the existing cropland matching the suitability map. Lower match rates in areas such as the Yellow River-Huangshui River Valley, the Hengduan Mountains, and the alpine-gorge region of southern Xizang are attributed to the prevalence of steeply sloped cropland (Figures 6c-6e) (He et al., 2024). Steeply sloped cropland is often transformed into terraces, an engineering solution that mitigates soil erosion and reduces the negative impacts of slope on land suitability (Chen et al., 2017). In fact, as a result of long-term human adaptation to and transformation of nature, terraces are generally high-quality cropland in mountainous areas. They serve crucial functions such as controlling soil erosion, enhancing soil fertility, and increasing crop yields. In China, terraces account for 13.7% of the total cropland and represent a vital agricultural resource in the mountainous regions of southwestern China (Dong et al., 2023). Additionally, some croplands in the Himalayan region of Xizang are often considered unsuitable due to their high altitude (Chen et al., 2023). However, these regions may exhibit microscale climatic variations that are non-zonal, meaning that, with the support of water resources and localized warm climates, farmland can be cultivated at higher altitudes (Figure 6b) (Tao et al., 2022). It is essential to consider these localized anomalies caused by topography or management when evaluating land suitability for agriculture.
Our suitability map is consistent with existing research findings. The suitability maps developed by Yao et al. (2021) and Li et al. (2023) appear visually distinct compared to ours. In our study, the Qaidam Basin is classified as a suitable region due to its lower altitude and gentle slope. Although water scarcity limits agricultural development in this area, favorable climate conditions and land resources enhance its prioritization (Yu et al., 2022). In the map developed by Yao et al. (2021), only a small portion of the Qaidam Basin was deemed suitable for cropland, which aligns closely with observed farmland distribution. This discrepancy may reflect the limitations of the MCDA approach. Furthermore, the suitability map developed by Li et al. (2023), based on crop distribution, categorized the northern Tibet-southern Qinghai Plateau as a poorly suitable region. This is due to the absence of a maximum elevation limit in the altitude factor used, a limitation that our study addresses. These differences highlight the distinct methodologies applied. The cropland suitability assessment in this research is a fundamental evaluation from the perspective of land resources, without considering factors such as water and soil. While these factors are equally important, they can be addressed through agricultural management practices and engineering solutions, and their impact is generally less significant than that of climatic and topographical factors (Li et al., 2023; Wang et al., 2023).

4.2 Importance and strategies for key potential areas

Optimizing human activity and land resource allocation is a critical issue for the sustainable development of the QTP. However, no studies have attempted to identify key regions suitable for large-scale human settlement and agricultural development through suitability analysis. By considering the trade-offs between cropland suitability and irrigation water supply convenience, we identified the Shannan Valley, the Nyingchi Valley, the Zanda Valley, and the Gonghe Basin as the proposed key potential areas for cropland development. These areas could serve as primary destinations for future ecological resettlement. Promoting the relocation and concentration of herders in high-altitude areas into these key potential areas is a key strategy to resolve the contradiction between the human activity pressures and herders’ livelihoods in ecological regions, achieved through optimal land and water resources allocation. Since the 1990s, both central and local governments have initiated ambitious ecological migration programs, such as the ecological migration of the Sanjiangyuan Nature Reserve in Qinghai and the extremely high-altitude ecological relocation in Xizang, aimed at restoring and protecting the region’s ecology. In these efforts, herders are relocated to the nearest towns. The proposed key potential areas for cropland development offer spatially explicit options for further ecological resettlement initiatives.
The key potential areas should implement strategies for comprehensive land consolidation and water development. The focus of land consolidation and water development in the Shannan Valley and Nyingchi Valley includes excavating gravity-flow ditches along both sides of the river, undertaking river channel consolidation and bank protection projects to confine the scattered river channels, elevating and leveling land through earthwork filling, and improving the soil fertility. In the Zanda Valley and the Gonghe Basin, the focus should be on constructing hydraulic engineering projects upstream and establishing gravity-flow irrigation systems for large-scale development of irrigated cropland and grazing land. In addition, the abundance of solar and wind resources in these areas support the construction of wind and photovoltaic turbine pump systems, as well as pumped storage power stations, to extract water from the Longyangxia Reservoir. Based on the standard of 0.005 km² of irrigated cropland or grassland per capita, it is estimated that the valleys of Shannan, Nyingchi, and Zanda can accommodate approximately 65,000, 30,000, and 6000 additional migrants, respectively. Even when considering only the low-altitude areas between 2900-3000 m, the Gonghe Basin could accommodate approximately 260,000 additional migrants.

4.3 Limitations and uncertainty

In this study, we did not consider the consistency between cropland suitability and crop yield, which some studies suggest is an important component of the validation process for the suitability map. However, other studies have reported a lack of significant correlation between the two, leaving the issue of validation unresolved (Akpoti et al., 2019). Notably, this study addressed this gap by using the existing cropland layer as a substitute for crop yield. In addition, a semi-quantitative methodology was employed to identify key potential areas based on the anticipated availability of water resources and improved irrigation capacity, aiming to avoid expanding cropland into areas that are technically unable to access water (Schneider et al., 2022). While certain valleys in southeastern Xizang, northwestern Yunnan, and western Sichuan receive enough rainfall to reduce the need for irrigation, agricultural yields in these areas remain unstable due to seasonal rainfall variability. Our field surveys show that this rainfed cropland still requires supplementary irrigation for optimal production. Therefore, incorporating the irrigation water supply convenience to assess land development potential is a fundamental aspect of the feasibility study. In practical applications, this process could also consider additional factors such as soil and geological conditions, transportation accessibility, and regional development strategies.
The factors influencing the potential for cropland expansion remain debated, and including grasslands and tidal flats in the trade-off matrix of PACt may be controversial. Most land-use models exclude forests, wetlands, and protected areas from the scope of available cropland, while grasslands are often considered significant convertible land (Eitelberg et al., 2015). Coastal and inland tidal flats, on the other hand, are considered valuable reserve land resources (Xiao et al., 2015; Long et al., 2016). Our research indicates that areas with high suitability for cultivation and development potential are mainly concentrated in valley regions, such as the Yarlung Zangbo River Valley. These areas not only have flat terrain but are also close to water sources, making them ideal for farming and economically feasible. In these valley regions, implementing appropriate engineering measures—such as river channel consolidation, bank protection projects, and land leveling through earthwork filling—can help prioritize the conversion of tidal flats into cropland. Human activity at the QTP is largely concentrated in specific areas, with valley regions being the primary hubs. However, the ecological functions of grasslands and tidal flats in these areas have been diminished due to human activity, which has shifted their role form ecological to more productive functions (Zhang et al., 2009; Xiao et al., 2015).

5 Conclusion

Cropland suitability analysis is an essential tool for harmonizing ecological space and human activity space. This study developed a high spatial-resolution cropland suitability map for the Qinghai-Tibet Plateau (QTP) and assessed potential areas for cropland development by considering the trade-offs between cropland suitability and irrigation water supply convenience. The results indicate that most of the land on the QTP land is unsuitable for sustainable farming, with suitable areas accounting for only 10.18% of the total area. When the existing cropland layer was overlaid with cropland suitability map, the distribution of cropland matched well with the suitability classification, validating the effectiveness of this suitability map. Compared to traditional multi-criteria decision analysis techniques, this approach offers a more advanced assessment framework for land suitability on the QTP and provides a novel perspective for such studies. By combining qualitative and quantitative analyses, this study identified spatially explicit maps of potential cropland development areas, with high-potential areas accounting for 1.07% of the total QTP area. By considering the degree of regional development and ecological restrictions, certain areas within the high potential areas-namely, the Shannan Valley, the Nyingchi Valley, the Zanda Valley, and the Gonghe Basin-were identified as key potential areas. These areas, rich in land resources and favorable for water use, are recommended for comprehensive land consolidation and water development projects. Despite ongoing ecological migration projects by central and local governments, the transformation of migrants’ livelihoods has not been fully realized. The proposed key potential areas provide a strategic prospect that ecological migration projects on the QTP should prioritize key areas with good potential for land and agricultural development to support the sustainable livelihood transition of migrants.
[1]
Akpoti K, Kabo-bah A T, Zwart S J, 2019. Agricultural land suitability analysis: State-of-the-art and outlooks for integration of climate change analysis. Agricultural Systems, 173: 172-208.

[2]
Breure T S, Estrada-Carmona N, Petsakos A et al., 2024. A systematic review of the methodology of trade-off analysis in agriculture. Nature Food, 5: 211-220.

[3]
Budak M, Kilic M, Günal H et al., 2024. Land suitability assessment for rapeseed potential cultivation in upper Tigris basin of Turkiye comparing fuzzy and boolean logic. Industrial Crops and Products, 208: 117806.

[4]
Chen D, Wei W, Chen L D, 2017. Effects of terracing practices on water erosion control in China: A meta analysis. Earth-Science Reviews, 173: 109-121.

[5]
Chen F H, Ding L, Piao S L et al., 2021. The Tibetan Plateau as the engine for Asian environmental change: The Tibetan Plateau Earth system research into a new era. Science Bulletin, 66(13): 1263-1266.

[6]
Chen W X, Yang L Y, Zeng J et al., 2023. Untangling the increasing elevation of cropland in China from 1980 to 2020. Geography and Sustainability, 4(4): 281-293.

[7]
Dalin C, Qiu H, Hanasaki N et al., 2015. Balancing water resource conservation and food security in China. Proceedings of the National Academy of Sciences of the United States of America, 112(15): 4588-4593.

[8]
Ding R, Shi W J, Lu C H et al., 2022. Future unbalanced-trends of grain supply and demand on the Tibetan Plateau. Journal of Cleaner Production, 367: 132993.

[9]
Dong S J, Xin L J, Li S F et al., 2023. Extent and spatial distribution of terrace abandonment in China. Journal of Geographical Sciences, 33(7): 1361-1376.

[10]
Duan J, Wang W T, Chen J et al., 2023. Scales and spatial distribution patterns of grain reserves on the Qinghai-Tibet Plateau. Progress in Geography, 42(10): 1869-1881. (in Chinese)

[11]
Duan J, Xu Y, Sun X Y, 2019. Spatial patterns and their changes of grain production, grain consumption and grain security in the Tibetan Plateau. Journal of Natural Resources, 34(4): 673-688. (in Chinese)

[12]
Eitelberg D A, van Vliet J, Verburg P H, 2015. A review of global potentially available cropland estimates and their consequences for model-based assessments. Global Change Biology, 21(3): 1236-1248.

[13]
Fan J, 2019. Assessment Guidelines for Resource and Environmental Carrying Capacity and Territorial Development Suitability. Beijing: Science Press. (in Chinese)

[14]
Fan J, Xu Y, Wang C S et al., 2015. The effects of human activities on the ecological environment of Tibet over the past half century. Chinese Science Bulletin, 60(32): 3057-3066. (in Chinese)

[15]
Fang C L, 2022. Special thinking and green development path of urbanization in Qinghai-Tibet Plateau. Acta Geographica Sinica, 77(8): 1907-1919. (in Chinese)

[16]
FAO, 1976. A framework for land evaluation. FAO Soils Bulletin No.32. Rome: Food and Agriculture Organization of the United Nations (FAO).

[17]
FAO, 2016. Food and Agriculture:Key to Achieving the 2030 Agenda for Sustainable Development. Retrieved 2024-05-09 from https://sdgs.un.org/sites/default/files/publications/2313foodandagriculture.pdf.

[18]
Hawker L, Uhe P, Paulo L et al., 2022. A 30 m global map of elevation with forests and buildings removed. Environmental Research Letters, 17(2): 024016.

[19]
He T T, Li J H, Zhang M X et al., 2024. Uphill cropland and stability assessment of gained cropland in China over the preceding 30 years. Journal of Geographical Sciences, 34(4): 699-721.

[20]
Hou Z C, Sun Z, Du G L et al., 2023. Assessment of suitable cultivation region for Pepino (Solanum muricatum) under different climatic conditions using the MaxEnt model and adaptability in the Qinghai-Tibet Plateau. Heliyon, 9(8): e18974.

[21]
Jin G, Wang Z Q, Li W S et al., 2014. Suitable evaluation on cultivated land based on Fuzzy weights of evidence method in the Yarlung Zangbo River, Nyangqu River and Lhasa River region, Tibet. Journal of Natural Resources, 29(7): 1246-1256. (in Chinese)

[22]
Lambin E F, Gibbs H K, Ferreira L et al., 2013. Estimating the world’s potentially available cropland using a bottom-up approach. Global Environmental Change-Human and Policy Dimensions, 23(5): 892-901.

[23]
Lehner B, Grill G, 2013. Global river hydrography and network routing: Baseline data and new approaches to study the world’s large river systems. Hydrological Processes, 27(15): 2171-2186.

[24]
Li J Y, 2022. Evaluation methods for water resource suitability in territorial spatial planning: A case study of Baiyin city in a semi-arid region. International Journal of Environmental Research and Public Health, 19(19): 12973.

[25]
Li X L, Wu K N, Hao S H et al., 2023. Mapping cropland suitability in China using optimized MaxEnt model. Field Crops Research, 302: 109064.

[26]
Liu Y M, Wang Z Y, Wang C S et al., 2023. Construction of a water resource suitability index for agricultural production and matching analysis of cultivated land in Lhasa, Tibet. Frontiers in Environmental Science, 11: 1130269.

[27]
Long X H, Liu L P, Shao T Y et al., 2016. Developing and sustainably utilize the coastal mudflat areas in China. Science of the Total Environment, 569-570: 1077-1086.

[28]
Lv F R, Tang H P, 2024. Sustainable photovoltaic power generation spatial planning through ecosystem service valuation: A case study of the Qinghai-Tibet plateau. Renewable Energy, 222: 119876.

[29]
Malczewski J, 2006. GIS-based multicriteria decision analysis: A survey of the literature. International Journal of Geographical Information Science, 20(7): 703-726.

[30]
Ministry of Natural Resources of China, 2019. Technical Regulation of the Third Nationwide Land Survey, TD/T 1055-2019. Beijing: Geology Press. (in Chinese)

[31]
Møller A B, Mulder V L, Heuvelink G B M et al., 2021. Can we use machine learning for agricultural land suitability assessment? Agronomy, 11(4): 703.

[32]
Neal J, Hawker L, 2023. FABDEM V1-2. Queens Road, Bristol: University of Bristol.

[33]
Nguyen T T, Verdoodt A, Tran V Y et al., 2015. Design of a GIS and multi-criteria based land evaluation procedure for sustainable land-use planning at the regional level. Agriculture Ecosystems & Environment, 200: 1-11.

[34]
Romano G, Dal Sasso P, Liuzzi G T et al., 2015. Multi-criteria decision analysis for land suitability mapping in a rural area of southern Italy. Land Use Policy, 48: 131-143.

[35]
Schneider J M, Zabel F, Mauser W, 2022. Global inventory of suitable, cultivable and available cropland under different scenarios and policies. Scientific Data, 9(1): 527.

[36]
Sun H L, Zheng D, Yao T D et al., 2012. Protection and construction of the national ecological security shelter zone on Tibetan Plateau. Acta Geographica Sinica, 67(1): 3-12. (in Chinese)

[37]
Sun Y X, Liu S L, Shi F N et al., 2020. Spatio-temporal variations and coupling of human activity intensity and ecosystem services based on the four-quadrant model on the Qinghai-Tibet Plateau. Science of The Total Environment, 743: 140721.

[38]
Tao J, Zhu J T, Zhang Y J et al., 2022. Divergent effects of climate change on cropland ecosystem water use efficiency at different elevations in southwestern China. Journal of Geographical Sciences, 32(8): 1601-1614.

[39]
The Tibetan Plateau Scientific Expedition of Chinese Academy of Sciences, 1984. Agricultural geography in Tibet. In: Tibetan Plateau Scientific Expedition Series. Beijing: Science Press. (in Chinese)

[40]
United Nations, 2015. Transforming our World: The 2030 Agenda for Sustainable Development. Retrieved 2024-05-09 from https://sdgs.un.org/publications/transforming-our-world-2030-agenda-sustainable-development-17981.

[41]
Uyan M, Janus J, Ertunç E, 2023. Land Use Suitability Model for Grapevine (Vitis vinifera L.) Cultivation Using the Best Worst Method: A case study from Ankara/Türkiye. Agriculture-Basel, 13(9): 1722.

[42]
Wang Y, Li Y C, 2023. Mapping the ratoon rice suitability region in China using random forest and recursive feature elimination modeling. Field Crops Research, 301: 109016.

[43]
Xiao L L, Yang X H, Chen S X et al., 2015. Suitability assessment of reserve cultivated land resources south of the Yangtze River. Resources Science, 37(10): 2030-2038. (in Chinese)

[44]
Xu X L, Liu J Y, Zhang S W et al., 2018. Remote Sensing Monitoring Data of Land Use in China. Beijing: Data Registration and Publishing System of the Resource and Environmental Science Data Center of the Chinese Academy of Sciences. (in Chinese)

[45]
Xu Y, Wang L J, Yang H, 2023. Evaluation method and empirical application of human activity suitability of land resources in Qinghai-Tibet Plateau. Journal of Geographical Sciences, 33(7): 1397-1418.

[46]
Yang H, Xu Y, Wang L J, 2023. Evaluation method and empirical application of construction land suitability and arable land suitability in alpine-gorge region of Qinghai-Tibet Plateau: A case study of Nyingchi city. Journal of Natural Resources, 38(5): 1283-1299. (in Chinese)

[47]
Yang S L, Wang H M, Tong J P et al., 2022. Impacts of environment and human activity on grid-scale land cropping suitability and optimization of planting structure, measured based on the MaxEnt model. Science of The Total Environment, 836: 155356.

[48]
Yao M L, Shao D G, Lv C H et al., 2021. Evaluation of arable land suitability based on the suitability function: A case study of the Qinghai-Tibet Plateau. Science of The Total Environment, 787: 147414.

[49]
Yin Y Y, Wang J A, Leng G Y et al., 2022. Future potential distribution and expansion trends of highland barley under climate change in the Qinghai-Tibet Plateau (QTP). Ecological Indicators, 136: 108702.

[50]
Yu H, Huang M, Zhao T et al., 2022. Analysis of agricultural production potential and enhancement strategy in the Qaidam Basin based on the agro-ecological zone method. Frontiers in Environmental Science, 10: 908888.

[51]
Zabel F, Delzeit R, Schneider J M et al., 2019. Global impacts of future cropland expansion and intensification on agricultural markets and biodiversity. Nature Communications, 10: 2844.

[52]
Zang Z H, Guo Z Q, Fan X Y et al., 2022. Assessing the performance of the pilot national parks in China. Ecological Indicators, 145: 109699.

[53]
Zhang F R, Guo L N, Guan X K et al., 2009. Study on the evaluation indicators of the arable land from the view of ecological security. China Land Science, 23(9): 4-14. (in Chinese)

[54]
Zhang J J, Sun H T, Jiang X H et al., 2022. Evaluation of development potential of cropland in Central Asia. Ecological Indicators, 142: 109250.

[55]
Zhu X F, Xiao G F, Wang S, 2022. Suitability evaluation of potential arable land in the Mediterranean region. Journal of Environmental Management, 313: 115011.

[56]
Zhu Y Q, Sun L, Luo Q Y et al., 2023. Spatial optimization of cotton cultivation in Xinjiang: A climate change perspective. International Journal of Applied Earth Observation and Geoinformation, 124: 103523.

Outlines

/