
Journal of Geographical Sciences >
Influence mechanism of the flow of high-skilled talents on technological evolution in emerging countries
This paper is initially published in Acta Geographica Sinica (Chinese edition), 2024, 79(10): 2621‒2637.
|
Jin Wenwan (1996-), PhD and Lecturer, specialized in innovative geography and talent mobility. E-mail: jinwenwan@nbu.edu.cn |
Received date: 2024-08-05
Accepted date: 2024-11-05
Online published: 2025-03-14
Supported by
National Natural Science Foundation of China(42122006)
National Natural Science Foundation of China(41971154)
National Natural Science Foundation of China(42271201)
Key Project of National Natural Science Foundation of China(41731278)
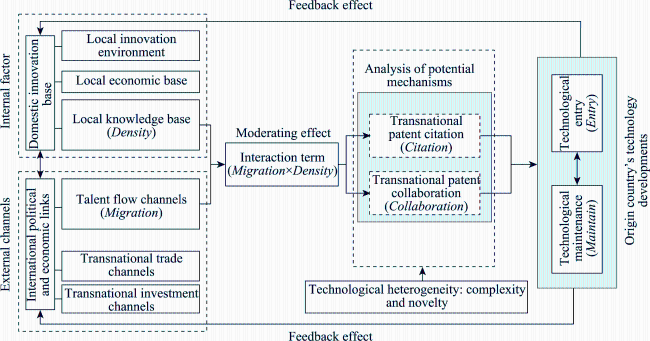
Globalization has resulted in a notable rise in the flow of high-skilled talent from emerging countries to developed nations. Current research on transnational talent flow mainly focuses on the destination countries, with less attention given to the perspective of the sending countries, particularly lacking a dynamic discussion on its impact on technological evolution in the origin countries. Based on the OECD REGPAT database, this paper aims to explore how talent groups migrating to developed countries facilitate the return of knowledge and technology to emerging countries and achieve breakthroughs in their technological evolution paths, while further discussing the potential mechanisms involved. The findings of this paper are as follows: (1) The technological development of emerging countries is a path-dependent process, where countries often branch into new technologies related to their preexisting knowledge base. Consequently, knowledge feedback from high-skilled talents increases the likelihood of sending countries developing unrelated technologies. (2) The mobility of talents across borders fosters more international collaborations and citations for patents that are unrelated to the local knowledge base, thus enriching the technological paths of sending countries. (3) The mobility of high-skilled talents primarily affects complex technologies, which have significant economic effects that encourage imitation by other countries. However, the effect on novel technologies is less significant due to their strong geographical stickiness. In general, this paper addresses the gaps in existing research on talent outflow and the technological evolution of origin countries, providing empirical evidence for the positive role of transnational talent mobility in the technological catch-up of emerging nations. Besides, it offers recommendations for talent export, import, and innovation policy formulation in these countries.
JIN Wenwan , ZHU Shengjun , LIN Xiongbin . Influence mechanism of the flow of high-skilled talents on technological evolution in emerging countries[J]. Journal of Geographical Sciences, 2025 , 35(2) : 409 -431 . DOI: 10.1007/s11442-025-2328-1
Figure 1 Research framework |
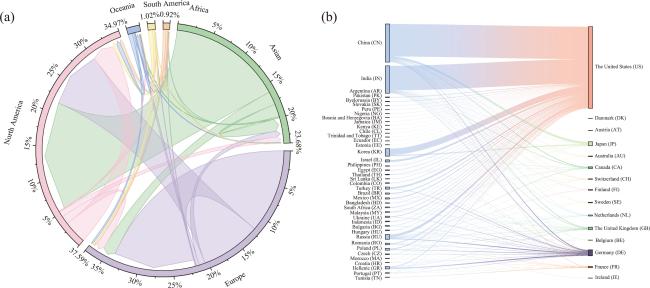
Figure 2 International mobility of inventors from 2006 to 2010 |
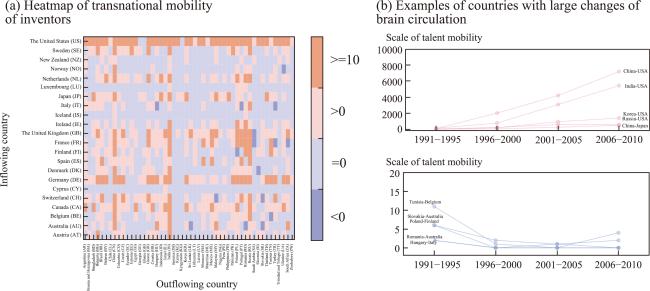
Figure 3 Changes in the international mobility of inventors (1990 and 2010) |
Table 1 Proportion of patents with technological novelty in different periods |
| Period | Proportion of breakthrough patents | |||||||
|---|---|---|---|---|---|---|---|---|
| 0-0.1% | 0.1%-1.0% | 1.0%-10.0% | > 10.0% | |||||
| Number | Main countries | Number | Main countries | Number | Main countries | Number | Main countries | |
| 1996-2000 | 83 | Malaysia, Thailand, Vietnam, Chile, Colombia | 24 | India, Singapore, Mexico, Russia, Portugal | 15 | China, South Korea, Japan, Norway, Denmark | 2 | USA, Germany |
| 2001-2005 | 85 | Thailand, Vietnam, Chile, Egypt, Colombia | 23 | India, Malaysia, Denmark, Norway, Russia | 14 | China, South Korea, UK, Germany, France | 2 | USA, Japan |
| 2006-2010 | 86 | Thailand, Vietnam, Egypt, Colombia, Argentina | 24 | Malaysia, Denmark, Norway, Chile, Russia | 12 | China, South Korea, India, UK, Germany | 2 | USA, Japan |
| 2011-2015 | 85 | Egypt, Vietnam, Argentina, Portugal, Philippines | 30 | Malaysia, Denmark, Norway, Thailand, Colombia | 6 | South Korea, France, Germany, India, UK | 3 | USA, Japan, China |
Table 2 Descriptive statistics of variables |
| Variables | Interpretation | Observations | Mean value | Standard deviation | Minimum | Maximum |
|---|---|---|---|---|---|---|
| Density | Technological relatedness density | 36,404 | 0.28 | 0.12 | 0.028 | 110.59 |
| Migration | Perform an inverse hyperbolic sine transformation on the product of the number of migrants and the technological comparative advantage of the destination country | 36,404 | 3.27 | 2.03 | 0.00 | 6325.20 |
| FDI | Perform an inverse hyperbolic sine transformation on the product of the foreign direct investment value and the technological comparative advantage of the destination country | 36,404 | 12.64 | 0.99 | 0.00 | 9625.40 |
| Trade | Perform an inverse hyperbolic sine transformation on the product of trade value and the technological comparative advantage of the destination country | 36,404 | 21.26 | 1.36 | 0.00 | 43.00 |
| Total_pat | Perform an inverse hyperbolic sine transformation on the cumulative number of patents from the previous period in the country | 36,404 | 0.53 | 1.10 | 0.00 | 8.44 |
Table 3 Regression of talent outflow and technological entry of sending country |
| Entry | ||||
|---|---|---|---|---|
| (1) | (2) | (3) | (4) | |
| Migration | 0.0226*** | 0.0173*** | 0.0269*** | |
| (0.0029) | (0.0037) | (0.0037) | ||
| Density | 12.2057*** | 12.5667*** | 12.9290*** | |
| (0.0679) | (0.0792) | (0.0794) | ||
| Migration×Density | -0.0943*** | -0.1270*** | ||
| (0.0112) | (0.0112) | |||
| Trade | -0.0236*** | |||
| (0.0037) | ||||
| FDI | 0.0346*** | |||
| (0.0118) | ||||
| Total_pat | 0.0829*** | |||
| (0.0031) | ||||
| “Country-period” control | YES | YES | YES | YES |
| “Technology-period” control | YES | YES | YES | YES |
| N | 36383 | 36383 | 36383 | 36383 |
| R2 | 0.169 | 0.575 | 0.576 | 0.576 |
Note: *** p<0.01, ** p<0.05, * p<0.1; the values in parentheses represent robust standard errors. |
Table 4 Regression of talent outflow and technological maintenance of sending country |
| Maintain | ||||
|---|---|---|---|---|
| (1) | (2) | (3) | (4) | |
| Migration | 0.0343*** | 0.0119* | 0.0215*** | |
| (0.0052) | (0.0066) | (0.0066) | ||
| Density | 14.0775*** | 14.5398*** | 14.5946*** | |
| (0.1071) | (0.129) | (0.1277) | ||
| Migration×Density | -0.0981*** | -0.1224*** | ||
| (0.0176) | (0.0176) | |||
| Trade | -0.0346*** | |||
| (0.0063) | ||||
| FDI | -0.0034 | |||
| (0.0166) | ||||
| Total_pat | 0.0830*** | |||
| (0.0047) | ||||
| “Country-period” control | YES | YES | YES | YES |
| “Technology-period” control | YES | YES | YES | YES |
| N | 16445 | 16445 | 16445 | 16445 |
| R2 | 0.247 | 0.660 | 0.662 | 0.670 |
Note: *** p<0.01, ** p<0.05, * p<0.1; the values in parentheses represent robust standard errors. |
Table 5 Regression of IV variable |
| IV | Entry | Maintain | ||
|---|---|---|---|---|
| (1) | (2) | (3) | (4) | |
| Migration | -0.0394* | 0.4764*** | 0.0221 | 0.1210*** |
| (0.0213) | (0.0293) | (0.0243) | (0.0405) | |
| Density | 13.2815*** | 15.7947*** | 15.3863*** | 16.7016*** |
| (0.1313) | (0.2266) | (0.2335) | (0.3783) | |
| Migration×Density | -0.1846*** | -1.0103*** | -0.2948*** | -0.6241*** |
| (0.0313) | (0.0581) | (0.0499) | (0.0916) | |
| “Country-period” control | YES | YES | YES | YES |
| “Technology-period” control | YES | YES | YES | YES |
| Control variables | YES | YES | YES | YES |
| N | 36383 | 36383 | 16445 | 16445 |
| R2 | 285.140 | 239.076 | 255.673 | 166.417 |
Note: *** p<0.01, ** p<0.05, * p<0.1; the values in parentheses represent robust standard errors. |
Table 6 Regression on talent outflow and probability of patent collaboration (citation) |
| Collaboration_rate | Citation_rate | |||
|---|---|---|---|---|
| (1) | (2) | (3) | (4) | |
| Migration | 0.0496** | 0.0609*** | -0.0194 | 0.0650*** |
| (0.0247) | (0.0112) | (0.0150) | (0.0037) | |
| Trade | 0.4187*** | 0.3609*** | ||
| (0.0022) | (0.0007) | |||
| FDI | 0.0146 | 0.0125*** | ||
| (0.0098) | (0.0041) | |||
| Previous rate | -0.3602*** | -0.2729*** | ||
| (0.0079) | (0.0034) | |||
| “Country-period” control | YES | YES | YES | YES |
| “Technology-period” control | YES | YES | YES | YES |
| N | 11707 | 11707 | 22695 | 22695 |
| R2 | 0.005 | 0.792 | 0.003 | 0.938 |
Note: *** p<0.01, ** p<0.05, * p<0.1; the values in parentheses represent robust standard errors. |
Table 7 The effect of patents collaboration (citation) on Density indicator |
| Density | ||
|---|---|---|
| (1) | (2) | |
| Collaboration | -0.0054*** | |
| (0.0001) | ||
| Citation | -0.0014*** | |
| (0.0001) | ||
| “Country-period” control | YES | YES |
| “Technology-period” control | YES | YES |
| N | 5467312 | 670993 |
| R2 | 0.803 | 0.911 |
Note: *** p<0.01, ** p<0.05, * p<0.1; the values in parentheses represent robust standard errors. |
Table 8 Heterogeneity analysis on technological complexity |
| Entry | Maintain | |||
|---|---|---|---|---|
| Low complexity | High complexity | Low complexity | High complexity | |
| (1) | (2) | (3) | (4) | |
| Migration | 0.0351*** | 0.0546*** | 0.0582*** | 0.0454*** |
| (0.0109) | (0.0069) | (0.0188) | (0.0128) | |
| Density | 12.9930*** | 12.4044*** | 15.7067*** | 13.9160*** |
| (0.1975) | (0.1572) | (0.3184) | (0.2491) | |
| Migration×Density | -0.1193*** | -0.2358*** | -0.1990*** | -0.1419*** |
| (0.0323) | (0.0213) | (0.0497) | (0.0343) | |
| Trade | -0.0190 | -0.0290*** | -0.0295* | -0.0288** |
| (0.0117) | (0.0067) | (0.0166) | (0.0117) | |
| FDI | 0.0663 | 0.0249 | 0.0684 | -0.0440 |
| (0.0433) | (0.0186) | (0.0690) | (0.0272) | |
| Total_pat | 0.1420*** | 0.0717*** | 0.1057*** | 0.0733*** |
| (0.0106) | (0.0051) | (0.0104) | (0.0093) | |
| “Country-period” control | YES | YES | YES | YES |
| “Technology-period” control | YES | YES | YES | YES |
| N | 7187 | 9946 | 3867 | 4494 |
| R2 | 0.580 | 0.575 | 0.650 | 0.676 |
Note: *** p<0.01, ** p<0.05, * p<0.1; the values in parentheses represent robust standard errors. |
Table 9 Heterogeneity analysis on technological novelty |
| Entry | Maintain | |||
|---|---|---|---|---|
| Low novelty | High novelty | Low novelty | High novelty | |
| (1) | (2) | (3) | (4) | |
| Migration | 0.0393*** | 0.0227** | 0.0248** | 0.0004 |
| (0.0064) | (0.0093) | (0.0115) | (0.0180) | |
| Density | 12.1587*** | 11.1634*** | 13.4935*** | 13.8471*** |
| (0.1432) | (0.1802) | (0.2239) | (0.3237) | |
| Migration×Density | -0.1901*** | -0.1141*** | -0.1543*** | -0.0254 |
| (0.0196) | (0.0271) | (0.0308) | (0.0467) | |
| Trade | -0.0201*** | -0.0200** | -0.0483*** | -0.0455** |
| (0.0060) | (0.0100) | (0.0104) | (0.0179) | |
| FDI | 0.0223 | 0.0602** | -0.0595** | 0.0085 |
| (0.0164) | (0.0305) | (0.0282) | (0.0540) | |
| Total_pat | 0.0515*** | 0.1114*** | 0.0798*** | 0.1015*** |
| (0.0051) | (0.0127) | (0.0094) | (0.0131) | |
| “Country-period” control | YES | YES | YES | YES |
| “Technology-period” control | YES | YES | YES | YES |
| N | 10903 | 6491 | 4875 | 2567 |
| R2 | 0.559 | 0.590 | 0.662 | 0.736 |
Note: *** p<0.01, ** p<0.05, * p<0.1; the values in parentheses represent robust standard errors. |
| [1] |
|
| [2] |
|
| [3] |
|
| [4] |
|
| [5] |
|
| [6] |
|
| [7] |
|
| [8] |
|
| [9] |
|
| [10] |
|
| [11] |
|
| [12] |
|
| [13] |
|
| [14] |
|
| [15] |
|
| [16] |
|
| [17] |
|
| [18] |
|
| [19] |
|
| [20] |
|
| [21] |
|
| [22] |
|
| [23] |
|
| [24] |
|
| [25] |
EBRD, 1998. European Bank for Reconstruction and Development. Transition Report 1998.
|
| [26] |
|
| [27] |
|
| [28] |
|
| [29] |
|
| [30] |
|
| [31] |
|
| [32] |
|
| [33] |
|
| [34] |
|
| [35] |
|
| [36] |
|
| [37] |
|
| [38] |
|
| [39] |
International Finance Corporation, 1999. Draft Education Strategy. Washington, DC.
|
| [40] |
|
| [41] |
|
| [42] |
|
| [43] |
|
| [44] |
|
| [45] |
|
| [46] |
|
| [47] |
|
| [48] |
|
| [49] |
|
| [50] |
|
| [51] |
|
| [52] |
|
| [53] |
|
| [54] |
|
| [55] |
|
| [56] |
|
| [57] |
|
| [58] |
|
| [59] |
|
| [60] |
|
| [61] |
|
| [62] |
|
| [63] |
|
| [64] |
|
| [65] |
|
| [66] |
|
| [67] |
|
| [68] |
|
| [69] |
|
| [70] |
|
| [71] |
|
| [72] |
|
| [73] |
|
| [74] |
|
| [75] |
|
| [76] |
|
| [77] |
|
/
| 〈 |
|
〉 |