Research Articles

Unveiling the role of social networks: Enhancing rural household livelihood resilience in China’s Dabie Mountains

  • TANG Lanyun , 1 ,
  • LIU Chongchong 1 ,
  • WANG Ying , 1, 2, *
Expand
  • 1. Department of Land Resources Management, School of Public Administration, China University of Geosciences, Wuhan 430074, China
  • 2. The Key Laboratory of the Ministry of Natural Resources for Legal Research, Wuhan 430074, China
*Wang Ying (1989-), PhD and Associate Professor, specialized in ecosystem services management, sustainable rural livelihoods, land related policies, and agent-based modeling. E-mail:

Tang Lanyun (1999-), Master, E-mail:

Received date: 2024-04-19

  Accepted date: 2024-12-12

  Online published: 2025-03-14

Supported by

National Natural Science Foundation of China(42371315)

National Natural Science Foundation of China(41901213)

Abstract

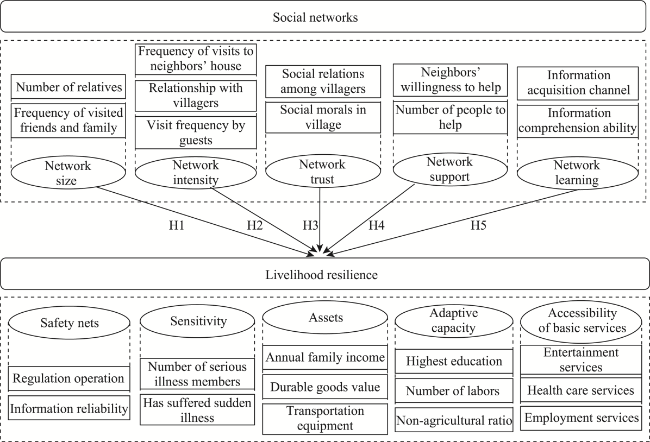
Social networks are vital for building the livelihood resilience of rural households. However, the impact of social networks on rural household livelihood resilience remains empirically underexplored, and most existing studies do not disaggregate social networks into different dimensions, which limits the understanding of specific mechanisms. Based on 895 household samples collected in China’s Dabie Mountains and structural equation modeling, this paper explored the pathway to enhance livelihood resilience through social networks by disaggregating it into five dimensions: network size, interaction intensity, social cohesion, social support, and social learning. The results indicate that: (1) Livelihood assets, adaptive capacity and safety nets significantly contribute to livelihood resilience, whereas sensitivity negatively affects it. Accessibility to basic services has no significant relationship with livelihood resilience in the study area. (2) Social networks and their five dimensions positively impact livelihood resilience, with network support having the greatest impact. Therefore, both the government and rural households should recognize and enhance the role of social networks in improving livelihood resilience under frequent disturbances. These findings have valuable implications for mitigating the risks of poverty recurrence and contributing to rural revitalization.

Cite this article

TANG Lanyun , LIU Chongchong , WANG Ying . Unveiling the role of social networks: Enhancing rural household livelihood resilience in China’s Dabie Mountains[J]. Journal of Geographical Sciences, 2025 , 35(2) : 335 -358 . DOI: 10.1007/s11442-025-2325-4

1 Introduction

Among the 17 Sustainable Development Goals (SDGs) established by the United Nations in 2015, poverty elimination is listed as the highest priority. As of 2020, China had fully eradicated absolute poverty, 10 years ahead of schedule, but its durability and stability remain a major concern (Guo and Liu, 2021; Wang et al., 2022). However, despite the shift from the poverty elimination strategy to the rural revitalization strategy in Chinese rural development, it remains crucial to focus on regions that face underpinning challenges for eliminating poverty, such as the contiguous poverty-stricken areas (CPSA). Due to their remote geographical location, adverse environment, and relatively poor infrastructure and public services, (Zhou and Liu, 2022), rural areas in CPSA have weak endogenous development capacity and low external driving forces for socio-economic development (Zhou et al., 2020). In CPSA, therefore, enhancing the resilience of rural households is essential to preventing poverty recurrence, consolidating poverty eradication efforts, and revitalizing rural areas (Li et al., 2021).
During the last few decades, resilience has gained prominence in many disciplines, including ecology, the social sciences, and interdisciplinary studies. However, resilient thinking focuses primarily on ecological processes and ignores social or political aspects of social-ecological systems (Brown, 2013; Quandt, 2018). In this study, we propose a livelihood perspective on resilient thinking, because linking livelihoods to resilience thinking not only places humans at the center of research but also emphasizes their ability to cope with shocks (Tanner et al., 2015). In the 1990s, the UK Department for International Development (DFID) introduced resilience to the field of poverty alleviation as part of the Sustainable Livelihoods Framework (SLF) and stated that livelihood resilience is the capability of an individual, household or community to deal with adverse conditions by utilizing available capitals (DFID, 1999). Thus, building resilience against different kinds of shocks and stresses is vital to eradicating poverty and achieving the SDGs. In earlier studies, livelihood resilience was associated with sustainable livelihoods, and generally considered as the ability to sustain and improve well-being by regrouping livelihood capital to maintain or even strengthen their livelihood capacity in the present and future (Chambers and Conway, 1991; Tanner et al., 2015). Later scholars pointed out the difference between livelihood resilience and sustainable livelihoods, arguing that livelihood resilience is the ability to adopt timely and targeted strategies in the face of stress and shocks, that is, the transformation of available resources into livelihood capacity by enhancing the ability to interact with the external environment, emphasizing a self-adaptive process (Nyamwanza, 2012; Liu et al., 2020).
Livelihood resilience delves into households’ responses to multiple challenges, including natural disasters (Sina et al., 2019), food insecurity (Pratiwi et al., 2018), and climate change (Tanner et al., 2015). Meanwhile, the current research primarily focuses on developing various frameworks to quantify livelihood resilience (Quandt, 2018; Sina et al., 2019), exploring its determinants (Li et al., 2016; Alam et al., 2018), and outlining strategies for strengthening it (Li and Zander, 2019; Huck et al., 2020). However, research on how social networks influence rural households’ livelihood resilience by altering livelihood behaviors remains relatively limited. Essentially, the livelihood behavior of rural households is not independent of the social environment but is embedded in the network of social relations that shape their existence and are influenced by mutual social relations. Social networks based on kinship/clan, friendship and neighborhood relations play an important role in enhancing household resilience and facilitating the reciprocal sharing of resources and labor. These social relationships not only help families manage and diversify risks and increase resilience (Gina et al., 2018) but also strengthen social support through the exchange of information and resources (Beaman and Dillon, 2018). In addition, social networks translate these supports into various forms of livelihood capital to enhance farmers’ livelihood security (Claasen and Lemke, 2019), and promote livelihood diversification to increase farmers’ adaptive capacity (Frederick et al., 2020). Therefore, overall, these social network factors provide important support for livelihood resilience and effective informal insurance and support in the face of disruption. However, the intricate relationship between social networks and household livelihood resilience remains underexplored in current academic research, with limited understanding of the multifaceted pathways through which social networks influence resilience. Furthermore, there is a dearth of empirical studies delving into the specific contributions of various aspects of social networks in fostering the livelihood resilience of vulnerable groups, such as the CPSA. The CPSA typically faces multiple challenges, including resource scarcity and inaccessibility, which make the livelihoods of households in the area more vulnerable. This, coupled with the fact that households in the region usually lack adequate external support and assistance, further exacerbates their predicament in enhancing livelihood resilience. In this environment, social networks, as an important social capital with the ability to enhance information flow, resource integration, and social support, are even more likely to have a significant impact on the resilience of households’ livelihoods. Thus, the main purpose of this study is to conduct a systematic empirical analysis of the specific mechanisms and effects of social networks on the resilience of households’ livelihoods in the context of CPSA, which not only fills the existing research gaps, but also helps to promote the country’s poverty eradication and rural revitalization, and to provide empirical support and policy recommendations for the sustainable development of livelihoods.
This study aims to address the pivotal research question: what are the specific mechanisms and pathways through which social networks exert influence on the resilience of household livelihoods in the CPSA? Given the complexity of the relationship between social networks and livelihood resilience, which is characterized by multiple interacting factors, this study employs Structural Equation Modeling (SEM) to explore the intricate connections and mechanisms between social networks and livelihood resilience. SEM is particularly advantageous for simultaneously modeling multiple dependent variables, testing specific hypotheses, elucidating variable effects, and identifying key factors based on sample data. Our research objectives include: (1) developing a theoretical framework that elucidates the mechanisms by which social networks impact household livelihood resilience; (2) constructing a livelihood resilience framework to assess households’ livelihood resilience to withstand external and internal shocks and pressures; (3) quantitatively assessing the impact of social networks on livelihood resilience using SEM; and (4) formulating policy recommendations aimed at enhancing household livelihood resilience and fostering sustainable livelihood development.

2 Theoretical background and analytical framework

2.1 Theoretical background

2.1.1 Livelihood resilience

Livelihood resilience, which integrates the concepts of livelihoods and resilience theory, is proposed as a component of sustainable livelihoods to describe a system’s ability to recover and adapt following changes in its environment (Joakim and Wismer, 2015). Nyamwanza (2012) emphasizes that livelihood resilience is a self-adaptive iterative process. However, considering the information-processing capacities of human actors and their ability to take purposeful actions and engage in reflective learning, livelihood resilience also highlights human agency (Schlüter and Pahl-Wostl, 2007). Folke (2006) points out that disturbances and challenges can provide a basis for innovation and development, enabling actors to advance from lower to higher levels of stability. These understandings indicate three core ideas of livelihood resilience: responding to change and uncertainty, adapting through learning processes, and self-organization using existing resources. Furthermore, these ideas can be summarized into four core processes: anticipating livelihood challenges, mitigating the impacts of vulnerabilities, recovering from vulnerabilities, and thriving in adversity.
Different understandings and varying emphases provide diverse perspectives on measuring livelihood resilience. For example, Li and Zander (2019) constructed a composite livelihood resilience index (LRI) based on disturbance, sensitivity and adaptation, Alam et al. (2018) viewed resilience as a function of sensitivity and adaptive capacity, while Sarker et al. (2020) proposed an assessment framework based on adaptive, absorptive and transformative capacities. Ifejika-Speranza et al. (2014) defined resilience as buffering mechanisms, self-organization and the ability to learn from experience. In addition, scholars have also measured household resilience based on a capital-based perspective, focusing on emphasizing the impact of the diversity of capital in response to disruption (Constas et al., 2014; Quandt, 2018; Daniel et al., 2019). Although these approaches provide useful frameworks for measuring livelihood resilience, they often focus on specific aspects of resilience and may not provide a comprehensive understanding.
In this context, the Resilience Index Measurement and Analysis (RIMA) framework proposed by the Food and Agriculture Organization (FAO) in 2016 is particularly significant. The RIMA framework encompasses essential elements of resilience assessment, including the availability of basic services, asset ownership, the presence of social safety nets, sensitivity, and adaptive capacity, and potentially incorporates factors such as climate change and institutional environments (2016). This framework has demonstrated effectiveness in assessing livelihood resilience among rural households in developing countries (Atara et al., 2020; Sarker et al., 2020). By integrating various assessment methods, it provides a systematic perspective that considers the interplay of economic, social, and environmental factors and is effective in capturing the complexity and dynamics of livelihood resilience.
This study focuses on livelihood resilience in CPSA of China, which faces multiple challenges such as poor natural environments, lagging economic development, resource scarcity, etc. The RIMA framework is ideally suited for analyzing the complexity of the livelihood environments in the region and can effectively capture the coping capacities and adaptive strategies of farmers in the region in the face of economic, social, and environmental pressures. By using the RIMA framework, we can obtain more comprehensive and in-depth analyses to provide a scientific basis for improving the livelihood resilience of rural households and formulating relevant policies. Therefore, to more deeply understand the resilience performance of farm households in complex livelihood environments through a comprehensive assessment perspective, this study adopts the RIMA framework to assess the livelihood resilience of farm households.

2.1.2 Social networks

The concept of social networks originated from anthropological studies of interpersonal relationships and emerged as a new theory in response to the limitations of traditional role and status structure theories. Mitchell (1969) defined social networks as the sum of all formal and informal relationships between individuals. Subsequently, scholars like Putnam (1993) and Uzii (1996) refined this definition, suggesting that social networks consist of closely-knit, trust-based interactive relationships formed for information sharing and maintaining mutual interests. The study of social networks continues to focus on these relatively stable relationship networks formed through interpersonal interactions. In the context of China, the social network is a relationship network based on blood ties and geography (Fei et al., 1992), and gradually forms a traditional stable network based on blood ties and geography and a new relationship network based on business ties and new geography (Xiong and Payne, 2017). In China, the social network is also known as “Guanxi”, which is formed through cultural and social interaction unique to rural China, involving material and emotional interaction and reciprocity among group members (Chung et al., 2016). In this paper, the social network is defined as a stable relational network formed by actors through various relationships. Our focus is on understanding how these relationships build and maintain a relatively stable social relationship network based on interpersonal interactions.
Contemporary social network theory primarily focuses on two main factors: relationship and structure. Key contributions to this field include the embedding theory, the strong and weak ties theory (Granovetter, 2002), the social capital theory (Claire and Neill, 2007), and the structural hole theory (Nicolas, 2009). Embeddedness theory posits that individuals’ economic activities and behaviors are deeply embedded within social networks, relying on mechanisms of trust established through interpersonal relationships. Strong and weak ties theory emphasizes the frequency of interactions, emotional intensity, intimacy, and reciprocity within relationships. Social capital theory argues that an individual’s social capital exists within social groups and their relationships. Structural hole theory, on the other hand, focuses on the position individuals occupy within networks, suggesting that the position determines their influence and control over the network.
The intangible and multifaceted nature of social networks presents a significant challenge for empirical measurement. Currently, evaluations of social networks primarily focus on their network structural attributes. For example, studies often employ graphical, matrix-based, and statistical methods to delineate a network’s size, density, centrality, cohesion, and subgroup dynamics (Wang et al., 2021). Zhang et al. (2023) examined the influence of social network embedding on farmers’ participation in water environmental management, addressing both relational embedding—comprising relationship quality, intimacy, and trust—and structural embedding, which includes network intensity, position, and scale. Diehl et al. (2022) evaluated social networks across micro, meso, and macro scales, capturing interactions within households, the farming community, and broader societal connections. Previous research on social networks has predominantly focused on network structural aspects, such as overall network characteristics (e.g., density, efficiency) and key node features (degree, closeness, and betweenness), with limited attention given to the social functional characteristics of social networks, such as the provision of information, material support, and emotional support.
Therefore, this study aims to measure social networks from both structural and functional perspectives and seeks to more comprehensively describe rural social networks. Combining the characteristics of rural social networks in China, this study decomposes social networks into five dimensions: network size, network intensity, network trust, network support, and network learning, based on the social relationships of interaction and reciprocity among households. Network size reflects the number of connections in a social network, which is crucial for understanding the range of resources and information available to individuals (Claire and Neill, 2007). Network intensity is associated with the quality and depth of relationships within the network, which is critical for assessing the robustness of the support system within the network (Zhang et al., 2023). Trust within the network, on the other hand, underpins information sharing and collaboration in social networks (Granovetter, 2002), and the inclusion of this dimension helps to capture the dynamics of relationships that facilitate or hinder network interactions. Network support includes the emotional and material support received through the network, and it provides insight into the tangible and intangible benefits provided by the network (Chung et al., 2016). However, the network learning dimension takes it a step further as it reflects the functionality of social networks, which refers to the process by which individuals acquire new knowledge or skills from their social relationships (Saint et al., 2016). By incorporating these dimensions, we aim to comprehensively analyze how different aspects of social networks work together to influence livelihood resilience, thereby providing deeper insights for related research.

2.2 Analytical framework and hypotheses

2.2.1 Measure of livelihood resilience

Since the resilience measurement framework proposed by FAO in 2016 is highly applicable to assessing households’ livelihood resilience in developing countries (Atara et al., 2019), this study employs it to measure livelihood resilience in five dimensions: assets, adaptive capacity, accessibility to basic services, safety nets, and sensitivity (Table 1).
Table 1 Measurement factors and driving factors of livelihood resilience for rural households
Component Indicator Description Mean SD
Livelihood resilience Assets (A) Annual family income (A1) Annual household income range (1<10,000 yuan, 2=10,000−50,000 yuan, 3=50,000−100,000 yuan, 4=100,000−150,000 yuan, 5=150,000−200,000 yuan, 6>200,000 yuan) 2.755 1.180
Durable goods value (A2) Durable goods value (1=rice cooker, 2=washing machine, 3=refrigerator, 4=solar water heater, 5=air conditioning) 0.955 0.538
Transportation equipment (A3) Transportation equipment (1=pedal cars, 2=electric bikes, 3=motorcycles, 4=small trucks, 5=cars) 0.427 0.291
Adaptive capacity (AC) Highest education (AC1) Highest education of family members (1= no schooling,
2=elementary school, 3=junior middle school, 4=high school, 5=college, junior college, 6=graduate)
3.651 1.146
Number of labors (AC2) Number of working age members [16, 65) 2.569 1.434
Non-agricultural ratio (AC3) Number of labors in non-agricultural sectors / Total number of labors 0.513 0.362
Accessibility to basic services (ABS) Cultural and entertainment services (ABS1) Satisfaction with the cultural and entertainment services of the village (Very unsatisfied 1−2−3−4−5−>Very
satisfied)
3.204 1.002
Health care services (ABS2) Satisfaction with medical and health services in the
village (Very unsatisfied 1−2−3−4−5−>Very satisfied)
3.390 0.894
Employment services (ABS3) Satisfaction with labor and employment services in the village (Very unsatisfied 1−2−3−4−5−>Very satisfied) 3.155 0.920
Safety nets (SN) Regulation operation (SN1) Whether the village’s rules and regulations are considered to be well operated (Very bad 1−2−3−4−5−>Very good) 3.496 0.754
Information reliability (SN2) Whether the village’s policy information is considered to be reliable (Unreliable 1−2−3−4−5−>Very reliable) 3.572 0.821
Sensitivity (S) Number of serious illness members (S1) Number of members with serious illness or disability 0.325 0.645
Has suffered sudden illness (S2) Whether family members have suffered a serious illness within the past three years (Yes=1, No=0) 0.259 0.438
Social network Network size (NS) Number of relatives (NS1) The total number of family members and relatives 13.263 8.878
Number of visited relatives and friends (NS2) Number of visited relatives and friends during festivals (1=0−10, 2=11−20, 3=21−30, 4>31) 2.522 3.493
Network intensity (NI) Frequency of visits to neighbors’ house (NI1) Frequency of visits to neighbors’ homes (Never 1−2−3−4−5−> Very frequent) 3.422 1.144
Relationship with villagers (NI2) The relationship between your family and other villagers (Very alienating 1−2−3−4−5−>Very tight) 3.810 0.736
Visit frequency by guests (NI3) How often does guests visit your house (Never 1−2−3−4−5−>Very frequent) 3.210 1.079
Network support (NS) Neighbors’ willingness to help (NS1) Neighbors’ willingness to help when has a family event (Very reluctant 1−2−3−4−5−>Very willing) 4.077 0.646
Number of people to help (NS2) Number of people who provide help in case of difficulty (Rare 1−2−3−4−5−>Many) 3.836 0.806
Network trust (NT) Social relations among villagers (NT1) Evaluation of social relations in our village (Not harmonious 1−2−3−4−5−> Very harmonious) 3.916 0.633
Social morals in village (NT2) Evaluation of the values and norms of the village (Very bad 1−2−3−4−5−> Very good) 3.790 0.720
Network learning (NL) Information acquisition channel (NL1) Number of channels to access information (Rare 1−2−3−4−5−> Many) 3.248 1.014
Information comprehension ability (NL2) Whether it is easy to understand the various messages disseminated by TV, cell phone and other sources (Very easy 1−2−3−4−5−>Very hard) 3.539 1.073
Rural households rely on assets to enhance their resilience. Households with more assets are likely to have better adaptive capacity (Thulstrup, 2015; Erdiaw-Kwasie et al., 2019) and greater livelihood resilience. Income growth leads to wealth accumulation, and in turn, income derived from wealth raises the income level of the entire household, thus enriching household assets. Farmers can liquidate material assets such as transportation and durable goods to maintain basic needs when they encounter livelihood risks, so in this study, annual family income, durable goods value, and transportation equipment are chosen as proxies of household assets.
Household adaptive capacity is the ability of farm households to maintain stability, take advantage of new opportunities, cope with changes, etc., after being disturbed by both internal and external poverty-causing risks (Dasgupta et al., 2022), reflecting its ability to recover from risks after exposure (Vincent, 2007). Adaptive capacity is closely related to knowledge and skills (Gallopín, 2006) and can be represented by the highest years of education of household members. The number of laborers in a rural household is a crucial part of the adaptive capacity to cope with multiple shocks, as more laborers can provide more income sources, skills, and social networks. The non-farm ratio is known as the proportion of the household labor force that comes from the non-farm sector. It is common sense that farm households are more at risk from natural disasters such as droughts and floods, so more people in the household working in non-farming can reduce the household’s dependence on agriculture and thus reduce exposure to natural disasters to some extent. In addition, non-farmers have more opportunities to earn money, which helps to counteract household shocks. So highest education, number of laborers and non-agricultural ratio are chosen to measure household adaptive capacity.
Accessibility to basic services, such as education, employment, social security, health care, entertainment and cultural services, can be measured by availability, affordability, quality, etc. In this study, we use a rural household’s satisfaction with entertainment services, health care services, and employment services as a proxy for the quality of basic services provided by local communities. Studies have shown that access to basic services is closely correlated with recovery speed after disasters (Khan, 2014; Mekuyie et al., 2018).
A safety net is defined as a universal, explicit, and pre-defined framework of institutional arrangements provided by the state and society for nationals, especially the poor, that can proactively help members of society to eliminate, mitigate, and cope with these threats and their impact on the basic livelihood security of poor farmers when they face various threats. It includes both formal and informal institutional arrangements, and the operation of the regulations and the reliability of the information were selected for assessment. In general, the stronger the safety nets in the village, the greater the likelihood that the village can provide resources and support to the needy to cope in case of livelihood risks.
Sensitivity reflects the degree to which a rural household is susceptible to, or unable to cope with, the adverse effects of internal and external disturbances and pressures (Brooks, 2003; Dasgupta et al., 2022). This study selected the number of serious illness members and whether a household has suffered sudden illnesses in the past three years (Khan et al., 2022) to assess a household’s sensitivity. Having a sick member or suffering a sudden illness would exacerbate the household’s financial strain, make it more susceptible to shocks, and reduce its resilience.

2.2.2 Measure of social network

Based on the definition of the social network concept, this paper examines social networks from two perspectives: interaction and reciprocity among households. Interaction is further categorized into network size, network intensity, and network trust, while reciprocity is divided into network support and network learning (Jing et al., 2021). With these detailed categorizations in mind, the paper constructs a relevant index system for social networks.
Network size refers to the extent of a farm household’s social network relationships, i.e., the number of social network members in which a rural household can participate and receive support. Specifically, network size can be measured by indicators such as the number of relatives and the frequency of visits to friends and family during significant occasions, such as New Year festivals.
Network intensity gauges the depth of connection and frequency of support, affection, and information exchange among rural households. Increased social interaction intensity correlates with swifter information dissemination and resource accessibility. The frequency of visits to neighbors’ houses, relationship with villagers, and visit frequency by neighbors are employed to assess social interaction intensity.
Network trust refers to the sense of trust among members within a rural community. This trust is established through long-term interactive relationships, shared social norms, and common values. The mutual trust among villagers is reflected in their cooperative and supportive social relationships (Jayashankar and Raju, 2020), while the community’s social morals guide behavior and reinforce these relationships, thus enhancing the level of mutual trust among community members. Mutually trusting social relationships and good social ethics together build a high level of network trust environment.
Network support refers to the emotional and material support and help that social networks can provide when households experience major family events or encounter difficulties that require support (Karunarathne and Lee, 2019; Atara et al., 2020). This study examines the willingness of neighbors to help during major events such as weddings and funerals, and the number of people who help when a household encounters difficulty.
Network learning among rural households refers to learning new behaviors or practices by observing and imitating others in the rural context. Social learning can also facilitate the diffusion of agricultural innovations and technologies among rural households and help them adapt to shocks and pressures. The information acquisition channel determines the quantity and quality of information that rural households can access (Wu et al., 2022), and information comprehension ability reflects their cognitive capacity to process and understand the information. Therefore, these two indicators are chosen to present social learning.

2.2.3 Hypothesized pathways

Social networks, as informal relational networks, play a crucial role in the dissemination of information (Isaac and Matous, 2017) and are instrumental in the spread of agricultural technology and related knowledge (Mittal et al., 2018). Households, as key actors within these networks, can access and leverage resources embedded in their social connections (Lin, 2001). They view one another as primary sources of information, which enables the rapid dissemination of knowledge and resources. The flow, dissemination, and sharing of information within social networks play a significant role in the effective allocation of household production factors. These provide essential information, resources, support, and trust, which are vital for maintaining and enhancing livelihood resilience.
Firstly, with the help of social network connections, information exchange among farm households becomes more rapid and effective. Meanwhile, resources that are dispersed among individual households can also be gathered quickly through social networks, relying on social networks to form an efficient information acquisition and resource mobilization mechanism among households. The size of the network affects the breadth of resources and information available. According to social capital theory, the broader the range of social network relationships of individual members, the greater their ability to access social resources (Claire and Neill, 2007). The degree of interaction among farmers influences the diffusion of technology, particularly the spread of knowledge within groups (Liu et al., 2022). Therefore, the larger the size of the social network, the more households can access more resources through their social network (Marsden and Hurlbert, 1988), while higher interaction intensity results in tighter connections among network members, facilitating the flow of information and resource integration (Le Dang et al., 2014). This broadens the pathways through which households can enhance their livelihood resilience, providing them with more capital and energy to sustain and strengthen their resilience. Based on these analyses, this paper proposes the following hypotheses:
H1: Network size is positively linked to households’ livelihood resilience.
H2: Network intensity is positively linked to households’ livelihood resilience.
Secondly, disseminating information resources within social networks relies on trust among households. Households in similar living environments and cultural contexts are more likely to trust and accept information from their surroundings. Mutual trust, which plays a crucial role in strengthening their willingness to share resources and information, enables members in high-trust social networks to be prone to form cooperative relationships to jointly address risks and challenges. Such cooperation not only enhances the resilience of individual households but also strengthens the overall resilience of the community. Additionally, network trust reduces friction and transaction costs in exchanging information and resources, making it more efficient for households to mobilize and utilize resources (Zheng et al., 2022), which is critical for improving livelihood resilience. Based on these analyses, this paper proposes the following hypothesis:
H3: Network trust is positively correlated with household livelihood resilience.
Furthermore, social networks, as a channel for disseminating households’ mutually supportive and reciprocal behaviors, can bring material or emotional support to farmers (Chang et al., 2016; Xiong and Payne, 2017). The material support of the network can effectively alleviate the pressure on households in times of economic hardship and help stabilize the basic livelihoods of the family, especially in times of disaster or market fluctuations that lead to income reduction, enabling households to maintain their daily lives and avoid falling into poverty. Emotional support in the social network contributes to the psychological resilience of farm households, enabling them to better cope with adversity and stress and enhancing their overall livelihood resilience. Additionally, inter-individual behavioral learning imitation is widespread in rural social network relationships. Social networks facilitate learning through observation and imitation of peers. Households can learn from the behaviors of others or engage in simple knowledge exchanges, gaining valuable information and decision-making insights related to agricultural production. This network-based learning reduces information asymmetry and lowers learning costs (Zheng et al., 2022), promoting the sharing of technical knowledge and experiences among households (Saint et al., 2016), and helping them discover and exploit opportunities to enhance livelihood resilience.
H4: Network support is positively associated with household livelihood resilience.
H5: Network learning is positively associated with household livelihood resilience.

3 Materials and methods

3.1 Study area and data

In this study, the Dabie Mountains in Hubei province were selected as the study area. It is located in the border area between Hubei and Anhui provinces and is an important part of China’s previous contiguous poverty-stricken areas (CPSA). Hong’an county, Luotian county, and Yingshan county are located in the Dabie Mountains. All of these are previous poverty-stricken counties in Hubei province with relatively low economic development levels and representative socio-economic characteristics. In addition, considering the similarities and differences of the development challenges in different townships, and to reflect the actual situation in the Dabie Mountains comprehensively, this study further selects four townships with different geographic and socio-economic characteristics as the specific empirical research areas, namely Qiliping township in Hong’an county, Jiuzihe township and Luotuoao township in Luotian county, and Shitouzui township in Yingshan county (Figure 2). These townships were selected to cover the main underdeveloped areas in the Dabie Mountains, and their geographical and socio-economic conditions are highly representative. Figure 2 and the supplementary material show detailed information on the four townships in the study area.
Data for this study were acquired through household surveys, which were conducted in the selected townships in March 2021 and July 2022. To ensure the comprehensiveness and accuracy of the surveys, a detailed questionnaire was designed, covering topics such as household basic information, household assets, land use, livelihood shocks and stressors, social networks, and government subsidies. The questionnaire was designed to focus closely on the key issues in the CPSA to ensure that all types of data related to CPSA could be comprehensively captured. To ensure the accuracy and reliability of the data, enumerators were trained and a rigorous survey process, which included professional training for enumerators and review of data, was enforced.
To guarantee sample representativeness, the study employed a random sampling method to conduct extensive surveys across different types of households in the selected four townships. The sample covered households with various economic statuses, social backgrounds, and geographical locations, thereby reflecting the diversity of the Dabie Mountains and its representativeness within CPSA. During data processing, samples with excessive missing values were excluded, resulting in 895 valid household samples. Through rigorous sample screening and data cleaning, the study ensured the validity and accuracy of the sample, allowing the results to accurately reflect the current conditions and issues in CPSA. The supplementary materials present detailed information on sample distribution and the specific content of the questionnaire for further reference.

3.2 The structural equation model

Due to the complex interactions between multiple factors that affect rural households’ livelihood resilience, this study adopted SEM and AMOS software to explore the causal pathways between social networks and rural households’ livelihood resilience. The SEM includes observable and latent variables. Observable variables can be directly observed and measured, while latent variables can not be observed directly and must be inferred from observable variables. Here, five dimensions of rural households’ livelihood resilience (assets, adaptive capacity, accessibility to basic services, safety nets, and sensitivity) and five components of social networks (network size, network intensity, network trust, network support, and network learning) were included as exogenous latent variables (Table 1 and Figure 1). Livelihood resilience and social networks were included as endogenous latent variables. Observable variables such as annual family income, durable goods value, and transportation equipment were selected as indicators to measure the latent variable of rural households’ livelihood assets. A measurement model comprises each latent variable and its observable variables. The pathways connecting social networks and livelihood resilience form the structural model. Then the Confirmatory Factor Analysis (CFA) was employed to test the relationship between hypothesized observed variables and latent variables (Everitt and Dunn, 2001), reflecting the construct validity of structural equation models by assessing convergent validity, discriminant validity, and structural validity. Recommended thresholds for the criteria and the values for each variable are presented in Table 2, indicating an acceptable model fit. Supplementary Materials provide a more detailed description of the specification and evaluation of the structural equation model.
Table 2 Results of parameter estimation using SEM and confirmatory factor analysis
Component Indicator β SMC AVE CR
Livelihood
resilience
Assets (A) A1 0.454*** 0.206 0.367 0.627
A2 0.613*** 0.376
A3 0.720*** 0.519
Adaptive
capacity (AC)
AC1 0.664*** 0.440 0.464 0.720
AC2 0.754*** 0.569
AC3 0.618*** 0.382
Accessibility to
basic services (ABS)
ABS1 0.698*** 0.488 0.486 0.739
ABS2 0.665*** 0.442
ABS3 0.727*** 0.528
Safety nets (SN) SN1 0.769*** 0.591 0.430 0.593
SN2 0.519*** 0.270
Sensitivity (S) S1 0.720*** 0.518 0.380 0.542
S2 0.492*** 0.242
Social
network
Network size (NS) NS1 0.878*** 0.772 0.451 0.584
NS2 0.363** 0.131
Network intensity
(NI)
NI1 0.687*** 0.472 0.496 0.745
NI2 0.785*** 0.616
NI3 0.631*** 0.398
Network
support (NS)
NS1 0.797*** 0.636 0.645 0.784
NS2 0.809*** 0.654
Network trust (NT) NT1 0.794*** 0.631 0.570 0.726
NY2 0.714*** 0.509
Network
learning (NL)
NL1 0.815*** 0.664 0.607 0.755
NL2 0.742*** 0.551

Significance level: ***p<0.001, **p<0.01, *p<0.05. SMC stands for squared multiple correlations; CR is the composite reliability (>0.500 is acceptable) (Raines-Eudy, 2000); AVE stands for the average of variance extracted (>0.350 is acceptable) (Fornell and Larcker, 1981).

Figure 1 Conceptual framework diagram
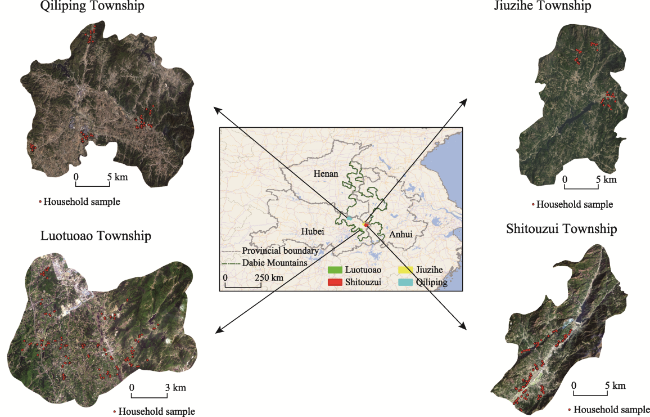
Figure 2 Location of the study area (Dabie Mountains, eastern China)

4 Results

4.1 Descriptive statistics

Table 1 presents descriptive statistics for the independent and dependent variables in the household sample. It is found that, when it comes to livelihood resilience, the majority of households have their total annual family income falling within the 10,000-100,000 yuan range (1$=6.4515 yuan). Notably, 49.5% of households have an annual family income below the middle level, indicating economic difficulties. The values of households’ durable goods and transportation equipment are more evenly distributed, with mean values of 0.955 and 0.427, respectively. The highest level of education attained by household members is primarily between 3 and 4, suggesting that most rural households have attained a junior middle school or high school education. A majority (56.5%) of households have a labor force of three or more members, and 62% have more than half of their total number of workers engaged in non-agricultural activities. Rural households’ satisfaction with entertainment services, health care services, employment services, regulation operation and information reliability (representing safety nets) are relatively evenly distributed and mainly fall within the 3-4 range. In terms of health, 76.5% of households have no members who are seriously ill or disabled, and 74.1% have not experienced any illness in the past three years, indicating a high overall level of health among rural households.
As for social networks, the numbers of relatives and visited relatives and friends during festivals are more evenly distributed. The mean value for the number of relatives is 13.263, and the mean value for the number of visited relatives and friends is 2.522, indicating that most people have between 11 and 20 people in their social network. The frequency of visits to neighbors’ houses and relationships with villagers are mainly concentrated in the 4-5 range, accounting for 57.8% and 71.45%, respectively. This suggests that rural households usually interact closely with each other. Only 2.3% of rural households fall into grade 1 for the frequency of guest visits. Furthermore, 88.9% of rural households are willing or very willing to help their neighbors during events such as weddings and funerals, and more than half believe that the number of people who want to help in case of difficulties is relatively large. Social relations among villagers and social morals in the village are concentrated in grade 4, indicating that social relations among villagers are harmonious and the social morals of the village are good. Regarding social learning, 40.8% of rural households believe that access to information is more available and 55.1% can easily understand information.

4.2 Results from measurement models

4.2.1 Measurement models of livelihood resilience

Regarding household assets, annual family income (β=0.454, p<0.001), durable goods value (β=0.613, p<0.001), and transportation equipment (β=0.720, p<0.001) are positively linked with household assets. Family income, which is composed of farm income and non-farm income, serves as the principal guarantee of farm households’ lives. What’s more, rural households will enjoy a higher living standard as their income gets higher. Furthermore, the higher the value of durable goods and transportation equipment, the more material assets rural households can realize. Thus, rural households with higher incomes, durable goods, and transportation equipment are linked with more livelihood assets.
Adaptive capacity is positively associated with the highest level of education among household members (β=0.664, p<0.001), the number of laborers (β=0.754, p<0.001), and the non-agricultural ratio (β=0.618, p<0.001). A higher level of education within a family increases the likelihood of engagement in skilled and intellectual labor, leading to higher income levels. Additionally, having more laborers in a family reduces the burden of supporting the elderly and children and allows for more time to engage in production and business activities to increase income and improve living standards. A higher non-agricultural ratio also reduces exposure to natural risks and disasters, increasing overall household adaptability.
In terms of accessibility to basic services, satisfaction with entertainment services (β=0.698, p<0.001), health care services (β=0.665, p<0.001), and employment (β=0.727, p<0.001) all have significant positive correlations with accessibility to basic services. This is consistent with expectations as households’ satisfaction with these services reflects their ability to secure their livelihoods. Greater satisfaction with these services indicates more extensive and convenient coverage of basic services for households. In terms of safety nets, the results show that regulation operation (β=0.769, p<0.001) and information reliability (β=0.519, p<0.001) are significantly and positively associated with safety nets. This is crucial for securing household interests and reflects the stability of the safety nets. Regarding sensitivity, there is a significant positive correlation between sensitivity and the number of household members with serious illnesses (β=0.720, p<0.001), as well as those who have suffered sudden illness in the past three years (β=0.492, p<0.001). What this result implies is that rural households with more family members having serious illnesses or having experienced illness in the past three years are more likely to face higher health risks and suffer adverse impacts, which in turn increases their sensitivity.

4.2.2 Measurement models of social network

In terms of network size, the number of relatives (β=0.878, p<0.001) and the number of friends and relatives who visit during festivals (β=0.363, p<0.001) have significant positive relationships with social network size, indicating that households with more relatives and friends have a wider scope for expanding their social network.
Regarding network intensity, rural households with similar attitudes towards each other tend to interact frequently in social relationships. As such, the frequency of visits to neighbors’ houses (β=0.687, p<0.001), relationships with villagers (β=0.785, p<0.001), and frequency of guest visits (β=0.631, p<0.001) all positively represent network interaction intensity.
In terms of network support, the willingness of neighbors to help with family events (β=0.797, p<0.001) and the number of people who provide help during difficulties (β=0.809, p<0.001) are positively correlated with network support, which means that the more help rural households receive in their lives or work, the higher the quality of their social networks.
Regarding network trust, rural households subconsciously understand that helping others can bring long-term benefits to themselves. This concept of mutual benefit and reciprocity gradually becomes normalized through deep interpersonal interactions. Thus, social relations among villagers (β=0.794, p<0.001) and social morals in the village (β=0.714, p<0.001) are positively correlated with network trust.
For network learning, information acquisition channels (β=0.815, p<0.001) and information comprehension ability (β=0.742, p<0.001) are positively associated with network learning. Evidently, the number of channels through which households can obtain information and their ease of understanding information dictate whether rural households can acquire timely and effective information on agricultural production technology, markets, and agricultural policies, which in turn promotes network learning.

4.3 Results from structural models

4.3.1 Relationship between rural livelihood resilience and its indicators

Figure 3 shows that there is a significant positive relationship between household assets and livelihood resilience for rural households (β=0.875, p<0.001). Livelihood assets provide a foundation for rural households to increase their resilience. When confronted with shocks and risks, households with more assets have a greater capacity to mitigate these challenges and enhance their resilience.
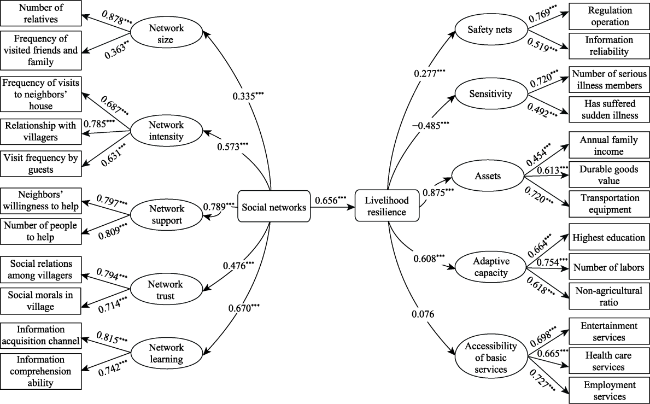
Figure 3 Mutual influence of social network and rural livelihood resilience (***p<0.001, **p<0.01, *p<0.05)
Adaptive capacity has a significant positive relationship with livelihood resilience for rural households (β=0.608, p<0.001). Households with stronger adaptive capacity have higher levels of livelihood skills and can more quickly adjust their livelihood strategies to cope with the adverse effects of change when faced with risks and shocks.
There is a positive but non-significant relationship between accessibility of basic services and livelihood resilience. It is possibly because the indicators used to measure the accessibility of basic services in this study were based on villagers’ satisfaction ratings of public services, which do not vary much among rural households.
Safety nets has a significant positive association on livelihood resilience for rural households (β=0.277, p<0.001). This suggests that enhancing rural safety nets can effectively enhance residents’ sense of security and stability. Safety nets play an important role in helping households cope with internal and external risks, mitigating the shocks of income fluctuations, and generating public benefits. This influences household livelihood decisions and improves their resilience.
Sensitivity has a significantly negative correlation with livelihood resilience for rural households (β=-0.485, p<0.001). Higher sensitivity implies rural households are more vulnerable to risks and shocks, and thus are less resilient.

4.3.2 The causal relationship between social network and livelihood resilience

There is a strong positive relationship between social networks and livelihood resilience for rural households (β=0.656, p<0.001). Combining the results of measurement models (Figure 3 and Table 3), different dimensions of social networks exert heterogeneous effects on livelihood resilience for rural households. All dimensions of social networks, including network size, network intensity, network trust, network support, and network learning, have significantly positive effects on household livelihood resilience, thus verifying our H1, H2, H3, H4, and H5, respectively. However, the extent of these effects varies. The path coefficients of network support, network learning, network intensity, network trust, and social network size on the livelihood resilience of farm households were 0.518, 0.440, 0.376, 0.312, and 0.220, respectively, all significant at the 1% level. Therefore, this indicates that the quality of social networks has the greatest degree of influence on the livelihood resilience of farm households.
Table 3 Different pathways of social network dimensions influencing the livelihood resilience of farm households
Pathway β Hypothesis Conclusion
Network size->Social network->Livelihood resilience 0.518 H1 Supported
Network intensity->Social network->Livelihood resilience 0.376 H2 Supported
Network trust->Social network->Livelihood resilience 0.312 H3 Supported
Network support ->Social network->Livelihood resilience 0.220 H4 Supported
Network learning->Social network->Livelihood resilience 0.440 H5 Supported

5 Discussion

5.1 Role of social networks in livelihood resilience building

Using the resilience evaluation framework proposed by FAO, this study analyzed the livelihood resilience of 895 rural households in four townships in the Dabie Mountains of Hubei province from five dimensions: assets, adaptive capacity, accessibility to basic services, safety nets, and sensitivity. Then we deeply analyze the impact of social networks on livelihood resilience by examining the impacts of social network size, network intensity, network trust, network support, and network learning. Our results reveal that assets, adaptive capacity, and safety nets are positively correlated with livelihood resilience, while sensitivity is negatively associated with livelihood resilience, which is in line with the findings of (Sen et al., 2020; Chiwaula et al., 2022). However, the positive relationship between basic service accessibility and the livelihood resilience of rural households is not significant. Second, this study provides empirical evidence that social networks have a significantly positive impact on households’ livelihood resilience. Rural households in areas with high information asymmetry often face resource constraints that limit their opportunities and well-being. Social networks serve as vital channels for resource mobilization that allow rural households to access external resources from other actors and institutions. These resources can be used for higher economic benefits, information diversity, cognitive enhancement, risk reduction, occupational opportunities, mobility and development, which enhance rural households’ livelihood resilience (Bauer et al., 2022).
Specifically, the size of their social networks positively contributes to households’ livelihood resilience, as it affects the diversity of occupational backgrounds, family characteristics, and occupational skills among rural households, exhibiting heterogeneity and extensiveness. These complex and diverse backgrounds facilitate information exchange and resource sharing among rural households, enabling them to have more available resources and greater stress resistance capacity in the face of risks.
Also, network intensity has a positive impact on livelihood resilience. The greater the intensity of social interactions, the more frequent contacts with other households are made. Villagers in rural China often have frequent social contacts, information is exchanged in a flexible and timely manner (Zhang et al., 2023), benefiting the attainment of diverse livelihood opportunities and the development of environmental skills and knowledge. Furthermore, it facilitates resource reallocation and increases the social capital of rural households, improving their livelihood resilience.
Network support plays a crucial role in rural households’ livelihood resilience. Higher quality social network support enables rural households to access greater opportunities, more timely information, and better assistance, which enhances households’ livelihood resilience (Liu et al., 2020). Research has shown that families who receive good assistance from their neighbors recover faster (Karunarathne and Lee, 2019). Farm households with better social networks can more comprehensively understand agricultural policies and predict technological risks, which increases their risk-coping abilities (Therrien et al., 2019).
In villages, network trust is vital to maintaining the interests of different households. The stronger the network trust, the more it reflects the shared culture of internal solidarity and mutual benefit. Risk-coping, the egoistic motive of maximizing self-interest, will be weakened, and strengthening emotional ties and stabilizing social relations will be more valuable. In addition, there is a significant relationship between social cohesion and the development of rural areas (Bathaiy et al., 2021). Network trust is a key factor that can enhance community cohesion, thereby promoting rural development and facilitating the collective advancement of farm households. As a result, rural households will receive more help when they face risks and shocks, contributing to their livelihood resilience (Serrat, 2017).
Finally, network learning reduces the cost of information acquisition while augmenting the sources of information, thus increasing more employment opportunities and enhancing households’ livelihood resilience. It is in agreement with Amadu et al. (2021a, 2021b), who found that fishers’ social networks facilitate the acquisition of knowledge and information that can boost their livelihood resilience. Cumming (2011) also found that with strong social networks and trust between members, the sharing of knowledge, experience, and best practices is enhanced to increase social capital and subsequently livelihood resilience. These findings demonstrate that through mutual learning and communication, members of social networks can transmit more comprehensive and sufficient information to make more informed decisions.

5.2 Policy implications

Based on the findings of this study that assets, adaptive capacity, and safety nets are significantly positively associated with rural household livelihood resilience, while sensitivity is significantly negatively associated, and social networks have a significantly positive impact on livelihood resilience, this paper proposes the following policy recommendations to enhance the livelihood resilience and development potential of rural communities in the Dabie Mountains.
First, enhance the asset base and adaptive capacity of farm households. The government should vigorously promote economic diversification in the Dabie Mountains and encourage households to participate in economic activities such as rural tourism, the development of local specialties, and the production of handicrafts to broaden their sources of income. This will not only improve households’ quality of life but also enhance their ability to cope with changes (David and Claire, 2020). In addition, actively showcasing local history and leveraging cultural assets can promote community development, creative industries and cultural tourism, thereby boosting the local economy (Rebecca, 2017). Integrating culture and tourism can help achieve urban-rural integration and rural revitalization (Tang et al., 2023). Meanwhile, building and improving the rural financial service system and providing low-interest rate loans and insurance products can help households accumulate and manage assets and reduce economic risks. Moreover, the government should promote sustainable rural development by organizing training in agricultural technology, promoting adaptive agricultural practices, improving the production skills and innovative capacity of households, giving priority to the modernization of agriculture and increasing investment in education and vocational training to ensure that villagers benefited from industrial development (Luo et al., 2024).
Second, strengthen social safety nets to mitigate environmental and social vulnerabilities. It is essential to invest in infrastructure development to improve transportation, education, and healthcare, particularly in the Dabie Mountains where infrastructure is currently inadequate. The government should establish and enhance social security systems to provide health insurance, pension schemes, and disaster relief for impoverished families, thereby increasing their ability to cope with life risks. Additionally, it is also crucial to support the development of community mutual aid organizations and social service networks to offer emergency relief, psychological support, and various social services. This will effectively strengthen the community’s social safety net and enhance residents’ livelihood security. Therefore, it is advisable that further policy measures should focus on facilitating the formation of local organizations which can boost productivity and social interaction, promoting cultural and recreational activities that enhance community engagement, and establishing service centersto facilitate residents’ access to a range of social services.
Finally, optimize social networks and address information poverty. In the Dabie Mountains, the lack of information technology and digital resources is a significant issue. Therefore, it is of paramount importance that the use of social networks should be maximized and information dissemination should be improved to enhance the competitiveness of rural households in the information age. The government should promote community building and interaction by funding and organizing community activities, thereby improving connections among villagers and increasing the density and effectiveness of social networks. Concurrently, establishing information platforms and service centers to facilitate the sharing of agricultural technology, market information, and resources can enhance the flow of information and the integration of resources within social networks. Additionally, the government should stimulate new business models in the rural economy by introducing innovative technologies and expanding training opportunities. Utilizing digital platforms such as e-commerce, live streaming, and online marketing can create new avenues for information dissemination and resource integration. These initiatives will help expand social networks and bolster the resilience of rural livelihoods. Moreover, households’ skills in modern information technology should be enhanced alongside their knowledge in management and marketing. Therefore, township governments should play a pivotal role in forming agricultural cooperatives and providing training to improve households’ production skills. Besides, strengthening education and training to enhance the self-governance and management capabilities of rural grassroots organizations will further support rural development and ensure agricultural sustainability (Arhin et al., 2024).

5.3 Strength and limitations

This study investigates the impact of social networks on the livelihood resilience of rural households, focusing specifically on their role within the complex socio-economic context of the Dabie Mountains. While existing literature extensively addresses social networks as a critical factor influencing rural livelihoods and behaviors, there is a notable lack of systematic studies examining the resilience of rural households’ livelihoods through the lens of social network embeddedness, particularly within the framework of CPSA. Most research to date has focused on the structural characteristics of social networks. In contrast, this study incorporates both relational and structural aspects of social networks, expanding the analysis across structural and functional dimensions. It dissects social networks into five distinct dimensions: network size, network intensity, network trust, network support, and network learning. This nuanced approach not only provides a more comprehensive understanding of rural social networks but also enables detailed exploration of the mechanisms through which these networks influence livelihood resilience. By empirically analyzing a sample of 895 households from four townships in the Dabie Mountains of Hubei province and employing structural equation modeling, this study investigates the pathways through which social network enhances livelihood resilience. The research provides new theoretical and empirical support for understanding the role of social networks in complex poverty contexts and offers novel perspectives and recommendations for leveraging these informal social institutions to safeguard rural livelihoods, thereby contributing to rural revitalization and the sustainable development of rural household economies. Nevertheless, the study has several limitations. Firstly, the sample is restricted to four townships within the Dabie Mountains, which may constrain the generalizability of the results to the entire region. Future research should aim to expand the geographical scope to examine how regional differences might affect the findings. Additionally, future policy formulation should consider the dynamic nature of rural household social networks and their long-term impacts on livelihood resilience. Such considerations will lead to a more nuanced understanding of the role of social networks over time and provide a more robust basis for policy development.

6 Conclusions

This study constructs a research framework on the causal relationships between social networks and livelihood resilience for rural households and empirically measures the hypothesized causal relationships using structural equation modeling with a sample of 895 rural households in the Dabie Mountains, China. Our main findings include:
(1) Assets, adaptive capacity, and safety net were positively and significantly associated with rural household livelihood resilience, with assets having the strongest effect (β=0.875, p<0.001), followed by adaptive capacity (β=0.608, p<0.001). Conversely, sensitivity was negatively and significantly correlated with rural household livelihood resilience (β=-0.485, p<0.001), indicating that higher sensitivity reduced the resilience of rural households. Basic service accessibility was not significantly correlated with rural household livelihood resilience, suggesting that it was not a critical factor in this context.
(2) Social networks exerted a positive and significant impact on households’ livelihood resilience (β=0.656, p<0.001). Moreover, all five dimensions of social networks, i.e., network size, network intensity, network trust, network support, and network learning, were positively and significantly correlated with social networks. Among these dimensions, social support had the highest impact on livelihood resilience, followed by network learning, network intensity, and network trust, while social network size had the lowest magnitude of impact.
[1]
Alam G M M, Alam K, Mushtaq S et al., 2018. How do climate change and associated hazards impact on the resilience of riparian rural communities in Bangladesh? Policy implications for livelihood development. Environmental Science & Policy, 84: 7-18.

[2]
Amadu I, Armah F A, Aheto D W, 2021a. Assessing livelihood resilience of artisanal fisherfolk to the decline in small-scale fisheries in Ghana. Sustainability, 13(18): 10404.

[3]
Amadu I, Armah F A, Aheto D W et al., 2021b. A study on livelihood resilience in the small-scale fisheries of Ghana using a structural equation modelling approach. Ocean & Coastal Management, 215: 105952.

[4]
Arhin I, Yeboah E, Liu X et al., 2024. Integrating farmers’ perception of sustainable agricultural technologies towards the development of sustainable tea production in China. International Journal of Agricultural Sustainability, 22(1): 2303886.

[5]
Atara A, Tolossa D, Denu B, 2020. Analysis of rural households’ resilience to food insecurity: Does livelihood systems/choice/matter? The case of Boricha woreda of sidama zone in southern Ethiopia. Environmental Development, 35: 100530.

[6]
Bathaiy S S, Chizari M, Sadighi H et al., 2021. Social media and farmer’s resilience to drought as an environmental disaster: A moderation effect. International Journal of Disaster Risk Reduction, 59: 102209.

[7]
Bauer T, de Jong W, Ingram V et al., 2022. Thriving in turbulent times: Livelihood resilience and vulnerability assessment of Bolivian indigenous forest households. Land Use Policy, 119: 106146.

[8]
Beaman L, Dillon A, 2018. Diffusion of agricultural information within social networks: Evidence on gender inequalities from Mali. Journal of Development Economics, 133: 147-161.

[9]
Brooks N, 2003. Vulnerability risk and adaptation: A conceptual framework. Tyndall Centre for Climate Change Research, 38.

[10]
Brown K, 2013. Global environmental change I: A social turn for resilience? Progress in Human Geography, 38(1): 107-117.

[11]
Chambers R, Conway G, 1992. Sustainable rural livelihoods: Practical concepts for the 21st century. IDS Discussion Paper No.296. Brighton, Institute of Development Studies, 296.

[12]
Chang E, Chou T, Huang C et al., 2016. The categories rules and demonstrations of Guanxi in Chinese society. Journal of Business-to-Business Marketing, 23: 311-325.

[13]
Chiwaula L S, Chijere Chirwa G, Simbeye J et al., 2022. Household resilience among fish value chain actors during the COVID-19 pandemic in Malawi. World Development Perspectives, 26: 100411.

[14]
Claasen N, Lemke S, 2019. Strong ties weak actors? Social networks and food security among farm workers in South Africa. Food Security, 11: 417-430.

DOI

[15]
Claire M O, Neill, 2007. Making democracy work: Putnam and his critics. South European Society and Politics, 1(2): 307-318

[16]
Constas M, Frankenberger T R, Hoddinott J et al., 2014. A common analytical model for resilience measurement: Causal framework and methodological options. Resilience Measurement Technical Working Group, FSiN Technical Series Paper No.2, World Food Program and Food and Agriculture Organization, 52.

[17]
Cumming G S, 2011. Conceptual background on social-ecological systems and resilience. In: Spatial Resilience in Social-Ecological Systems. Dordrecht. Netherlands: Springer, 7-33.

[18]
Daniel D, Sutherland M, Speranza C I, 2019. The role of tenure documents for livelihood resilience in Trinidad and Tobago. Land Use Policy, 87: 104008.

[19]
Dapilah F, Nielsen J Ø, Friis C, 2020. The role of social networks in building adaptive capacity and resilience to climate change: A case study from northern Ghana. Climate and Development, 12: 42-56.

[20]
Dasgupta S, Badola R, Ali S Z et al., 2022. Adaptive capacity and vulnerability of the socio-ecological system of Indian Himalayan villages under present and predicted future scenarios. Journal of Environmental Management, 302: 113946.

[21]
David B, Claire W, 2020. Gathering together: Social capital cultural capital and the value of cultural heritage in a digital age. Social & Cultural Geography, 21(5): 697-717.

[22]
DFID, 1999. DFID: Sustainable Livelihoods Guidance Sheets. London: Department for International Development, 445.

[23]
Diehl J A, Németh J, Thomas D S K et al., 2022. Power through social networks: A case study of urban farmers facing land development in Delhi India. Habitat International, 128: 102626.

[24]
Erdiaw-Kwasie M O, Abunyewah M, Yamoah O, 2019. ‘After the disaster comes destination thoughts’: A review and conceptualization of consolidative disaster adaptive capacity model. International Journal of Disaster Risk Reduction, 35: 101098.

[25]
Everitt B S, Dunn G, 2001. Applied multivariate data analysis. Technometrics, 44(4): 407-407.

[26]
FAO, 2016. The state of food and agriculture 2016: Resilience index measurement and analysis. Rome, Italy: Food and Agriculture Organization.

[27]
Fei X G, H G, Wang Z, 1992. From the Soil: The Foundations of Chinese Society. University of California Press.

[28]
Folke C, 2006. Resilience: The emergence of a perspective for social-ecological systems analyses. Global Environmental Change, 16(3): 253-267.

[29]
Fornell C, Larcker D F, 1981. Structural equation models with unobservable variables and measurement error: Algebra and statistics. Journal of Marketing Research, 18(1): 39-50.

[30]
Gallopín G C, 2006. Linkages between vulnerability resilience and adaptive capacity. Global Environmental Change, 16(3): 293-303.

[31]
Granovetter M, 2002. Economic action and social structure: The problem of embeddedness. Journal of Economic Sociology, 3(3): 44-58.

[32]
Guo Y, Liu Y, 2021. Poverty alleviation through land assetization and its implications for rural revitalization in China. Land Use Policy, 105: 105418.

[33]
Huck A, Monstadt J, Driessen P, 2020. Building urban and infrastructure resilience through connectivity: An institutional perspective on disaster risk management in Christchurch. New Zealand Cities, 98: 102573.

[34]
Ifejika Speranza C, Wiesmann U, Rist S, 2014. An indicator framework for assessing livelihood resilience in the context of social-ecological dynamics. Global Environmental Change, 28: 109-119.

[35]
Isaac M E, Matous P, 2017. Social network ties predict land use diversity and land use change: A case study in Ghana. Regional Environmental Change, 17(6): 1823-1833.

[36]
Jayashankar P, Raju S, 2020. The effect of social cohesion and social networks on perceptions of food availability among low-income consumers. Journal of Business Research, 108(C): 316-323.

[37]
Joakim E P, Wismer S K, 2015. Livelihood recovery after disaster. Development in Practice, 25(3): 401-418.

[38]
Karunarathne A Y, Lee G, 2019. Traditional social capital and socioeconomic networks in response to flood disaster: A case study of rural areas in Sri Lanka. International Journal of Disaster Risk Reduction, 41: 101279.

[39]
Khan F, 2014. Adaptation vs, development: Basic services for building resilience. Development in Practice, 24(4): 559-578.

[40]
Khan M A, Hasan K, Kabir K H, 2022. Determinants of households’ livelihood vulnerability due to climate induced disaster in southwest coastal region of Bangladesh. Progress in Disaster Science, 15: 100243.

[41]
Koczberski G, Curry G N, Bue V et al., 2018. Diffusing risk and building resilience through innovation: Reciprocal exchange relationships livelihood vulnerability and food security amongst smallholder farmers in Papua New Guinea. Human Ecology, 46(6): 801-814.

[42]
Le D H, Li E, Nuberg I et al., 2014. Farmers’ perceived risks of climate change and influencing factors: A study in the Mekong Delta Vietnam. Environmental Management, 54: 331-345.

[43]
Lee Y J, Kim S E, Youm Y et al., 2022. Association of social network properties with resilience and depression among community-based Korean population. Journal of Psychiatric Research, 154: 300-306.

DOI PMID

[44]
Li Q, Amjath-Babu T S, Zander P, 2016. Role of capitals and capabilities in ensuring economic resilience of land conservation efforts: A case study of the Grain for Green Project in China’s loess hills. Ecological Indicators, 71: 636-644.

[45]
Li Q, Zander P, 2019. Resilience building of rural livelihoods in PES programmes: A case study in China’s Loess Hills. Ambio, 1-24.

[46]
Li Y, Wu W, Wang Y, 2021. Global poverty dynamics and resilience building for sustainable poverty reduction. Journal of Geographical Sciences, 31(8): 1159-1170.

DOI

[47]
Lin N, 2001. Social Capital: A Theory of Social Structure and Action. Vol. 19. Cambridge: Cambridge University Press.

[48]
Liu W, Li J, Xu J, 2020. Effects of disaster-related resettlement on the livelihood resilience of rural households in China. International Journal of Disaster Risk Reduction, 49: 101649.

[49]
Liu Y, Shi K, Liu Z et al., 2022. The effect of technical training provided by agricultural cooperatives on farmers’ adoption of organic fertilizers in China: Based on the mediation role of ability and perception. International Journal of Environmental Research and Public Health, 19(21): 14277.

[50]
Luo X, Jin X, Liu X et al., 2024. Examining the pathway and mechanism of comprehensive land consolidation through the lens of rural neo-endogenous development. Journal of Geographical Sciences, 34(9): 1739-1760.

DOI

[51]
Marsden P V, Hurlbert J S, 1988. Social resources and mobility outcomes: A replication and extension. Social Forces, 66(4): 1038-1059.

[52]
Mekuyie M, Jordaan A, Melka Y, 2018. Understanding resilience of pastoralists to climate change and variability in the Southern Afar Region Ethiopia. Climate Risk Management, 20: 64-77.

[53]
Mitchell J C, 1969. The concept and use of social networks. In: Social Networks in Urban Situations: Analyses of Personal Relationships in Central African Town. Manchester: Manchester University Press.

[54]
Mittal S, Padmaja S S, Ajay A, 2018. Agricultural information and knowledge network in rural India: A case of Bihar. Journal of Agricultural Education and Extension, 24(5): 393-418.

[55]
Nicolas H, 2009. Structural holes in social networks: A remark. Journal of Economic Theory, 144(1): 422-431.

[56]
Nyamwanza A M, 2012. Livelihood resilience and adaptive capacity: A critical conceptual review. Jàmbá: Journal of Disaster Risk Studies, 4(1): e1-e6.

[57]
Pratiwi N, Karuniasa M, Suroso D, 2018. Self-organization and crop insurance to enhance livelihood resilience: A case of rice farmers in Cirebon Regency Indonesia. ASEAN Journal of Community Engagement, 2(1): 1-14.

[58]
Putnam R D, Leonardi R, Nanetti R Y, 1993. Making Democracy Work:Civic Traditions in Modern Italy. Princeton: Princeton University Press, 423-436.

[59]
Quandt A, 2018. Measuring livelihood resilience: The household livelihood resilience approach. World Development, 107: 253-263.

[60]
Raines-Eudy R, 2000. Using structural equation modeling to test for differential reliability and validity: An empirical demonstration. Structural Equation Modeling: A Multidisciplinary Journal, 7(1): 124-141.

[61]
Rebecca W, 2017. Local history as productive nostalgia? Change continuity and sense of place in rural England. Social & Cultural Geography, 18(4): 466-486.

[62]
Saint V A S, Hickey G M, Locher U et al., 2016. Exploring the role of social capital in influencing knowledge flows and innovation in smallholder farming communities in the Caribbean. Food Security, 8(3): 535-549.

[63]
Sarker M N I, Wu M, Alam G M M et al., 2020. RETRACTED: Life in riverine islands in Bangladesh: Local adaptation strategies of climate vulnerable riverine island dwellers for livelihood resilience. Land Use Policy, 94: 104574.

[64]
Schlüter M, Pahl-Wostl C, 2007. Mechanisms of resilience in common-pool resource management systems: An agent-based model of water use in a river basin. Ecology and Society, 12(2): 4.

[65]
Serrat O, 2017. The sustainable livelihoods approach. In: Knowledge Solutions:Tools, Methods, and Approaches to Drive Organizational Performance. Singapore: Springer Singapore, 21-26.

[66]
Sina D, Chang-Richards A Y, Wilkinson S et al., 2019. A conceptual framework for measuring livelihood resilience: Relocation experience from Aceh Indonesia. World Development, 117: 253-265.

[67]
Tang C, Liu Y, Wan Z et al., 2023. Evaluation system and influencing paths for the integration of culture and tourism in traditional villages. Journal of Geographical Sciences, 33(12): 2489-2510.

DOI

[68]
Tanner T, Lewis D, Wrathall D et al., 2015. Livelihood resilience in the face of climate change. Nature Climate Change, 5(1): 23-26.

[69]
Thulstrup A W, 2015. Livelihood resilience and adaptive capacity: Tracing changes in household access to capital in central Vietnam. World Development, 74: 352-362.

[70]
Uzzi B J A S R, 1996. The sources and consequences of embeddedness for the economic performance of organizations: The network effect. American Sociological Review, 61(4): 674-698.

[71]
Vincent K, 2007. Uncertainty in adaptive capacity and the importance of scale. Global Environmental Change, 17(1): 12-24.

[72]
Wang B, Luo Q, Chen G et al., 2022. Differences and dynamics of multidimensional poverty in rural China from multiple perspectives analysis. Journal of Geographical Sciences, 32(7): 1383-1404.

DOI

[73]
Wang Y, Zhang Q, Li Q et al., 2021. Role of social networks in building household livelihood resilience under payments for ecosystem services programs in a poor rural community in China. Journal of Rural Studies, 86: 208-225.

[74]
Wu H, Li J, Ge Y, 2022. Ambiguity preference social learning and adoption of soil testing and formula fertilization technology. Technological Forecasting and Social Change, 184: 122037.

[75]
Wu J, Wang T, Wang Z, 2021. Influence of farmers’ social networks and perceived value on their choice of cultivated land quality protection behavior. Journal of Northwest A&F University (Social Science Edition), 21(6): 138-147. (in Chinese)

[76]
Xiong H, Payne D, 2017. Characteristics of Chinese rural networks: Evidence from villages in central China. Chinese Journal of Sociology, 3(1): 74-97.

[77]
Zhang Y, Hu N, Yao L et al., 2023. The role of social network embeddedness and collective efficacy in encouraging farmers’ participation in water environmental management. Journal of Environmental Management, 340: 117959.

[78]
Zheng Y, Fan Q, Jia W, 2022. How much did internet use promote grain production? Evidence from a survey of 1242 farmers in 13 provinces in China. Foods, 11(10): 1389-1389.

[79]
Zhou Y, Li Y, Liu Y, 2020. The nexus between regional eco-environmental degradation and rural impoverishment in China. Habitat International, 96: 102086.

[80]
Zhou Y, Liu Y, 2022. The geography of poverty: Review and research prospects. Journal of Rural Studies, 93: 408-416.

Outlines

/