Research Articles

Spatio-temporal patterns of temperature extremes and their response to atmospheric circulation factors in China from 1961 to 2020

  • LUO Yuanbo , 1, 2 ,
  • ZHOU Yuke 3 ,
  • ZHOU Chenghu 1
Expand
  • 1. State Key Laboratory of Resources and Environmental Information System, Institute of Geographic Sciences and Natural Resources Research, CAS, Beijing 100101, China
  • 2. University of Chinese Academy of Sciences, Beijing 100049, China
  • 3. Key Laboratory of Ecosystem Network Observation and Modeling, Institute of Geographic Sciences and Natural Resources Research, CAS, Beijing 100101, China

Luo Yuanbo (1991−), PhD Candidate, specialized in spatio-temporal data mining. E-mail:

Received date: 2024-05-11

  Accepted date: 2024-08-02

  Online published: 2024-10-10

Supported by

National Key Research and Development Program of China(2021YFB3900900)

Abstract

Changes in surface temperature extremes have become a global concern. Based on the daily lowest temperature (TN) and daily highest temperature (TX) data from 2138 weather stations in China from 1961 to 2020, we calculated 14 extreme temperature indices to analyze the characteristics of extreme temperature events. The widespread changes observed in all extreme temperature indices suggest that China experienced significant warming during this period. Specifically, the cold extreme indices, such as cold nights, cold days, frost days, icing days, and the cold spell duration index, decreased significantly by −6.64, −2.67, −2.96, −0.97, and −1.01 days/decade, respectively. In contrast, we observed significant increases in warm extreme indices. The number of warm nights, warm days, summer days, tropical nights, and warm spell duration index increased by 8.44, 5.18, 2.81, 2.50, and 1.66 d/decade, respectively. In addition, the lowest TN, highest TN, lowest TX, and highest TX over the entire period rose by 0.47, 0.22, 0.26, and 0.16°C/decade, respectively. Furthermore, using Pearson’s correlation and wavelet coherence analyses, this study identified a strong association between extreme temperature indices and atmospheric circulation factors, with varying correlation strengths and resonance periods across different time-frequency domains.

Cite this article

LUO Yuanbo , ZHOU Yuke , ZHOU Chenghu . Spatio-temporal patterns of temperature extremes and their response to atmospheric circulation factors in China from 1961 to 2020[J]. Journal of Geographical Sciences, 2024 , 34(10) : 1883 -1903 . DOI: 10.1007/s11442-024-2275-2

1 Introduction

According to the Sixth Assessment Report of IPCC (AR6), the average surface temperatures worldwide in the first 20 years of the 21st century were 0.99°C [0.84 to 1.10°C] and 1.09°C [0.95 to 1.20°C], respectively, surpassing the average temperature of 1850-1900 (Masson-Delmotte et al., 2021). Rising temperatures have caused unprecedented shifts in extreme climatic phenomena, noted by higher occurrence and intensity of extreme climatic events (Fischer and Schär, 2010; Hao et al., 2013; AghaKouchak et al., 2020). This has led to a noticeable increase in the frequency of natural disasters and socio-economic losses. A recent report from the World Meteorological Organization states that extreme weather, climate and water-related events resulted in nearly 12,000 disasters between 1970 and 2021, with reported economic losses amounting to $4.3 trillion. Understanding the evolving characteristics (e.g., patterns, frequency and severity) of these events is critical, given their devastating impact on the natural environment and human society (Liu et al., 2020; Ebi et al., 2021; Chen et al., 2023; Newman and Noy, 2023).
Currently, research on extreme weather events has primarily focused on exploring the shifts in the occurrence and magnitude of extreme climatic events, discerning trends in various indices, and evaluating the environmental and societal ramifications. Studies on temperature extremes have indicated a notable increase in the frequency and strength of hot extremes worldwide, spanning all continents and the most populated areas. In contrast, the occurrence and intensity of cold extremes have decreased significantly (Alexander et al., 2006; Bartholy and Pongrácz, 2007; Mishra et al., 2015; Buckley and Huey, 2016). Nevertheless, the occurrence and intensity of these changes show significant spatial heterogeneity, influenced by factors such as geography, topographic variability, and the heterogeneous effect of regional atmospheric circulation patterns (Griffiths and Bradley, 2007; Blandford et al., 2008; De Lima et al., 2013; Ozturk et al., 2017).
China is highly susceptible to global warming due to its complex geography and rapid urbanization. Since 1951, China’s average annual temperature has risen significantly, by 0.26°C/decade, exceeding the global average (China Meteorological Administration Climate Change Centre, 2021). In parallel with warming, China has experienced pronounced alterations in the patterns, both in frequency and intensity, of extreme climatic events. Many studies have investigated the occurrence of temperature extremes in China on a national scale (Zhai et al., 1999; Zhai and Pan, 2003; You et al., 2011; Zhou and Ren, 2011; Jiang et al., 2012; Wang et al., 2014, 2021; Fu and Ding, 2021; Zhao and Chen, 2021). Zhai and Pan (2003) showed that from 1951 to 1999, the number of days with daily maximum temperatures exceeding 35°C decreased slightly across China, whereas the incidence of warm nights increased significantly in most areas. Additionally, numerous studies have focused on the variations in extreme weather occurrence in different regions of China, such as Southwest China, East China, South China, the Loess Plateau, the Tibetan Plateau, the Yunnan-Guizhou Plateau, and the Yangtze River Basin (Li et al., 2012; Guan et al., 2015; Sun et al., 2016; Gong et al., 2022; Zhang et al., 2022; Liang et al., 2023). These studies demonstrated that extreme temperatures exhibit diverse frequency, severity, and temporal distribution patterns. The observed trends of these features are inconsistent across regions or temperature thresholds. Considering the key influence of atmospheric circulation patterns on shaping and regulating regional climatic variability, changes in the occurrence and strength of extreme temperature events are likely to be strongly coupled with changes in atmospheric circulation indices. Therefore, various major atmospheric circulation indicators, such as the Arctic Oscillation (AO), El Niño Southern Oscillation (ENSO), North Atlantic Oscillation (NAO), Pacific Decadal Oscillation (PDO), and Southern Oscillation (SO), were used to investigate these potential linkages (You et al., 2011; Horton et al., 2015; Sun et al., 2016; Zhong et al., 2017; Wang et al., 2021; Liu et al., 2024). Liu et al. (2024) recently revealed significant positive connections between several warm extreme indicatorsand the Pacific Decadal Oscillation (PDO) over the northeastern Tibetan Plateau.
However, to our knowledge, previous studies have predominantly examined extreme temperature variations in specific regions of China, with limited analyses incorporating the most recent data from dense observational networks across the country. Furthermore, some of these studies have relied on only a few extreme climate indices to quantify trends and variability. Consequently, the objective of this study was to conduct detailed and comprehensive research on the variations in extreme temperature indices across China. This study employed temperature observations from 2138 national surface observatories in China from 1961 to 2020 to analyze the 14 extreme temperature indices defined by the Expert Team on Climate Change Detection and Indices (ETCCDI). This study thoroughly examined the spatiotemporal patterns of extreme temperature events in China using robust statistical techniques, including the non-parametric Mann-Kendall trend test, Theil-Sen estimator, Pearson correlation analysis, and wavelet coherence analysis. In addition, the association between these events and atmospheric circulation indicators was assessed. The results are intended to provide a valuable reference for predicting severe weather occurrences in China and future disaster prevention and reduction efforts.

2 Materials and methods

2.1 Study area

China has a vast territory, spanning seven climatic zones from south to north and varied altitudes reaching up to 4000 meters from east to west. This complex topography gives rise to a wide variety of natural conditions and, correspondingly, diverse degrees of economic and social development. To better account for the various regional features of these extreme temperature events, we divided China into seven distinct geographical regions (Figure 1) based on the natural and socio-economic characteristics at the province level, following the same definitions as in previous studies (Jiang et al., 2017; Zhu et al., 2018; Li et al., 2021; Wang et al., 2024).We obtained daily value observations of more than 2400 meteorological stations across China from the Data Center for Resources and Environmental Sciences, Chinese Academy of Sciences (http://www.resdc.cn/), with particular attention to temperature elements, such as the highest and lowest daily temperatures. Following quality assurance procedures, the elements of the dataset have been greatly enhanced in terms of quality and comprehensiveness, making it a popular choice for numerous studies on warming temperatures (Wu and Gao, 2013; Cao et al., 2016). We further screened meteorological stations with less than 10% missing data and obtained data records from 2138 stations for the period 1961-2020.
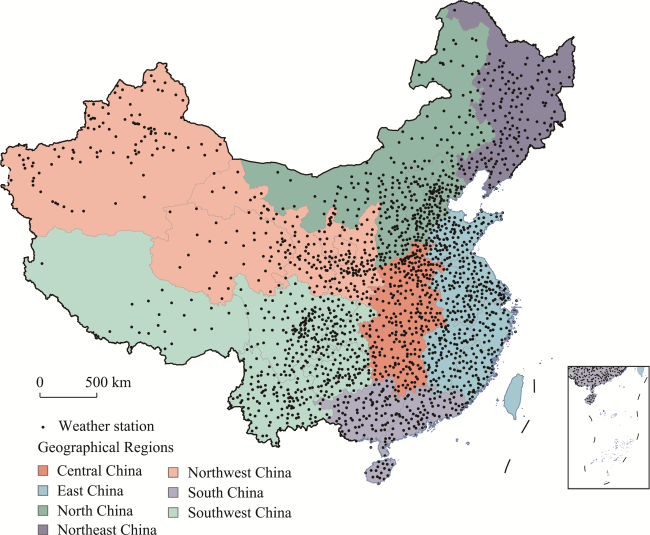
Figure 1 Geographical distribution of the 2138 weather observatories with observations ranging from 1961 to 2020 used in this study across China. The seven geographical divisions in China include North China (NC), East China (EC), Central China (CC), South China (SC), Northwest China (NWC), Southwest China (SWC), and Northeast China (NEC)
To ensure the reliability and accuracy of the extreme temperature indices, we carried out supplementary quality checks before conducting the calculations. The quality check process involved the following two steps: (1) replacement of all user-defined missing values by NA, which represents the internal missing values in R scripting language, and (2) replacement of invalid values with NA. Invalid observations consisted of (a) daily highest temperatures smaller than the corresponding daily lowest temperatures, (b) daily temperature values above 70°C or below -70°C, and (c) any values associated with an invalid date. Additionally, daily temperatures more than three standard deviations away from the daily average temperature on a particular calendar day were considered outliers and replaced with NA.

2.2 Definition of extreme temperature indices

We assessed 14 indices that quantified extreme temperature events, as listed in Table 1. These indices are obtained from ETCCDI’s official web portal (http://etccdi.pacificclimate.org/). To compute these indices across various meteorological stations, the study employed the RClimDex software version 1.9. For this analysis, 1971-2000 was used as the baseline period.
Table 1 Definitions of 14 extreme temperature indicators. TX represents the highest temperature recorded each day, while TN represents the lowest temperature recorded each day.
Index Descriptive name Definition Units
Absolute indices
TXx Highest TX Monthly highest value of TX records °C
TXn Lowest TX Monthly lowest value of TX records °C
TNx Highest TN Monthly highest value of TN records °C
TNn Lowest TN Monthly lowest value of TN records °C
Percentile-based indices
TN10p Cold nights frequency The proportion of days during the baseline period when TN is lower than the 10th percentile %
TX10p Cold days frequency The proportion of days during the baseline period when TX is lower than the 10th percentile %
TN90p Warm nights frequency The proportion of days during the baseline period when TN is higher than the 90th percentile %
TX90p Warm days frequency The proportion of days during the baseline period when TX is higher than the 90th percentile %
Other indices
SU Number of summer days Days annually when TX is higher than 25°C days
TR Number of tropical nights Days annually when TN is higher than 20°C days
FD Number of frost days Days annually when TN is lower than 0°C days
ID Number of icing days Days annually when TX is lower than 0°C days
WSDI Warm spell duration index Days annually with a minimum of six successive days when TX is higher than the 90th percentile days
CSDI Cold spell duration index Days annually with a minimum of six successive days when TN is lower than the 90th percentile days

2.3 Atmospheric circulation factors

Considering global climate change and regional atmospheric circulation, this study employed six atmospheric circulation indices to study the factors influencing extreme temperature changes in China. These indices, using monthly data records, include the Atlantic Multidecadal Oscillation (AMO), Arctic Oscillation (AO), North Atlantic Oscillation (NAO), North Pacific Index (NPI), Pacific Decadal Oscillation (PDO), and Southern Oscillation Index (SOI). These metrics were accessed online through the NOAA repository (https://psl.noaa.gov/data/climateindices/list/). Owing to the substantial role of the Western Pacific Subtropical High (WPSH) in shaping climatic patterns across East Asia, a subset of four WPSH-related indices was employed. These indices, including the Subtropical High Area Index (WPSHA), Subtropical High Intensity Index (WPSHI), Subtropical High Western Ridge Point Index (WPSHWRP), and Subtropical High Ridge Line Index (WPSHRL), followed the definitions in the meteorological industry standard (QX/T 304-2015). The four indices represented the size, strength, longitude position of the westernmost point, and the north-south position of the WPSH. The relevant datasets for the selected WPSH indices were acquired from the CMA’s official monitoring platform (http://cmdp.ncc-cma.net/Monitoring/).

2.4 Methodology

2.4.1 Trend analysis

This study analyzed temperature index trends from 1961 to 2020 using the ordinary least squares (OLS) approach to calculate the slope of the trend lines. The non-parametric Mann-Kendall (MK) test, described by Mann (1945) and Kendall (1970), was used to assess if there was a consistent trend in the indices at each observation station. Theil-Sen estimator (Sen, 1968), known for its non-parametric effectiveness, was employed to determine the median trend change rate. A trend was deemed statistically significant when it met the threshold of a p-value below 0.05, denoting a significance level of 5%.

2.4.2 Wavelet analysis

Ordinary wavelet analysis effectively analyzes the time-frequency characteristics of a given time series. The details of the computations are as follows:
$W_{X}(a, \tau)=|a|^{-1 / 2} \int_{-\infty}^{+\infty} x(t) \psi^{*}\left(\frac{t-\tau}{a}\right) d t$
where the wavelet decomposition coefficient $W_{X}(a, \tau)$ can be estimated by considering the scale factor (a) and time factor (τ).
Cross-wavelet analysis extends the scope of wavelet analysis by probing the covarying time-frequency dimensions of two distinct time series. This approach uncovers the regions of power within the time-frequency space that exhibit a shared presence in both series (Grinsted et al., 2004). The following discussion details the cross wavelet transform applied to a pair of time series labeled xn and yn:
$W_{n}^{X Y}(s)=W_{n}^{X}(s) W_{n}^{Y^{*}}(s)$
where * denotes the complex conjugation and s is the scale parameter. The cross-wavelet power was defined as $\left|W_{n}^{X Y}(s)\right|$.
Wavelet coherence analysis illuminates the synchrony of oscillatory patterns observed between two temporal sequences, offering a measure of their consistent periodic correspondence (Torrence and Webster, 1998). The details of the calculations are as follow:
$R_{n}^{2}=\frac{\left|S\left(s^{-1} W_{n}^{X Y}(s)\right)\right|^{2}}{S\left(s^{-1}\left|W_{n}^{X}(s)\right|^{2}\right) \cdot S\left(s^{-1}\left|W_{n}^{Y}(s)\right|^{2}\right)}$
where the time series and smoothing operator are represented by X, Y, and S, respectively. The correlation between X and Y is denoted by $R_{n}^{2}$, ranging from 0 to 1. The phase component of the wavelet cross-spectrum can be used to identify the relative temporal offset between two time series and can be computed using the real part (R) and imaginary part (I) of $W_{n}^{X Y}$ as follows:
$\phi_{n}^{X Y}(s)=\tan ^{-1}\left[\frac{I\left(S\left(s^{-1} W_{n}^{X Y}(s)\right)\right)}{R\left(S\left(s^{-1} W_{n}^{X Y}(s)\right)\right)}\right]$

3 Results

3.1 Temporal variation in extreme temperature indices

In this study, we computed the anomalies in each index’s time series by averaging the data obtained from the 2138 stations across China and subtracting the baseline mean values from the period 1971-2000. As shown in Figure 2, all extreme temperature indices exhibited an apparent trend of significantly increasing warmth (p < 0.01). The warm extreme indices, such as highest TX (TXx), lowest TX (TXn), highest TN (TNx), lowest TN (TNn), warm days (TX90p), warm nights (TN90p), summer days (SU), tropical nights (TR), and the warm spell duration (WSDI), exhibited increasing trends from 1961 to 2020 in China. In contrast, a set of cold extreme indices, such as cold days (TX10p), cold nights (TN10P), frost days (FD), icing days (ID), and cold spell duration (CSDI), displayed downward trends during the sample period.
Figure 2 Annual anomaly series of temperature index over China from 1961 to 2020 relative to the 1971-2000 mean. The black dotted line depicts the outcomes of the linear regression analysis, whereas the red solid line illustrates the 5-year moving average.
The four absolute indices TNn, TXn, TNx, and TXn exhibited significant increases with growth rates of 0.47, 0.26, 0.22, and 0.16°C/10a, respectively, all statistically significant (p < 0.01). Among the warm extreme indices, TN90p, TX90p, SU, TR, and WSDI exhibited significant increasing trends of 8.44, 5.18, 2.81, 2.50, and 1.66 d/10a, respectively. TN90p exhibited the most notable upward trend, achieving a Mann-Kendall test statistic of Z = 6.98. Most stations showed significant increases in the warm-related extreme indices (Table 2). Specifically, TXx significantly increased at 40.2% of the stations, whereas TXn, TNx, and TNn significantly increased at 30.9%, 76.4%, and 73.6%, respectively. The percentage of stations experiencing high temperatures for TX90p (84.5%), TN90p (95.3%), SU (81.5%), and TR (74.3%) increased noticeably during the entire study period.
Table 2 Proportion of stations with upward (+ve) and downward (-ve) trends in the extreme temperature indicator at the 5% significance level in China from 1961 to 2020, calculated using the Mann-Kendall test.
Indicator +ve Significant trend -ve Significant trend Indicator +ve Significant trend -ve Significant trend
TXx 861 (40.2%) 25 (1.2%) TX90p 1808 (84.5%) 4 (0.2%)
TXn 661 (30.9%) 4 (0.2%) SU 1744 (81.5%) 9 (0.4%)
TNx 1636 (76.4%) 17 (0.8%) TR 1589 (74.3%) 9 (0.4%)
TNn 1574 (73.6%) 7 (0.3%) FD 5 (0.2%) 1765 (82.5%)
TN10p 11 (0.5%) 2022 (94.5%) ID 0 (0.0%) 728 (34.0%)
TX10p 9 (0.4%) 1566 (73.2%) WSDI 664 (31.0%) 0 (0.0%)
TN90p 2039 (95.3%) 5 (0.2%) CSDI 2 (0.1%) 44 (2.1%)
Conversely, the cold extreme indices TN10p, TX10p, FD, ID, and CSDI showed decreasing trends, with rates of -6.64, -2.67, -2.96, -0.97, and -1.01 d/10a, respectively. The TN10p trend exhibited the most substantial decline, as indicated by a Mann-Kendall test statistic of Z = -7.94, followed by the number of days with frost (FD), with a test value of Z = -7.06 (p < 0.001). The proportions of the observatories exhibiting significant decreasing patterns were 94.5%, 73.2%, 82.5%, 34.0%, and 2.1%, respectively (Table 2).
Figure 3 presents a detailed analysis of the trends of the 14 extreme temperature indices across seven distinct geographical areas of China from 1961 to 2020. Nine warm extreme indicators exhibited increasing trends in nearly all seven regions, whereas all cold extreme indicators showed decreasing trends. The rise in warm and decline in cold occurrences suggests a warming pattern in China, which is consistent with prior research on temperature extremes in the country (Zhang et al., 2017; Wang et al., 2021). The decline in TN10p was more pronounced than that in TX10p in all the regions examined (e.g., Northeast China: -7.33 vs. -3.60; North China: -7.44 vs. -3.88), while the rise in TN90p exceeded that in TX90p (e.g., Northeast China: 7.36 vs. 3.50; North China: 8.21 vs. 4.76), suggesting that nighttime warming surpassed daytime warming.
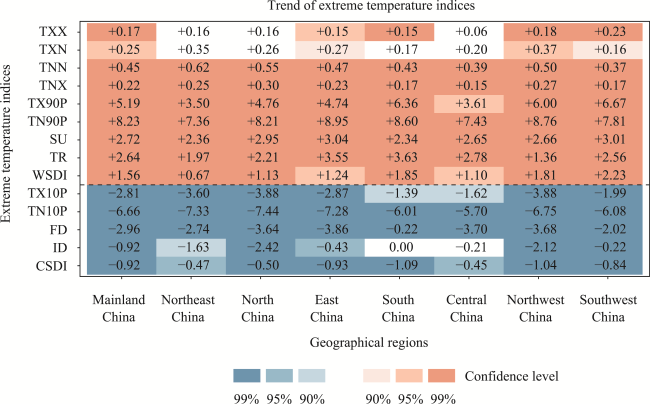
Figure 3 Trends in d/decade or °C/decade of the selected indices estimated using Sen’s slope for seven geographical regions dividing China from 1961 to 2020. The gradient changing from dark to light brown (blue) represents the increasing (decreasing) patterns within the confidence intervals of 99%, 95%, and 90%. The dotted line marks the boundary between the warm and cold indices.

3.2 Spatial variation in extreme temperature indices

Figures 4 and 5 display the Mann-Kendall test outcomes and Sen’s slope estimation across different meteorological stations. Next, we examined spatial differences in extreme temperatures across China. The warm extreme indices exhibited a notable positive trend in TXx (0.12-1.45°C/10a) and TXn (0.17-1.99°C/10a). Most stations that exhibited notable temperature increases were located in the eastern coastal and central regions of China. The trend of TNn lay between 0.16 and 2.00°C/10a, and that of TNx fluctuated between 0.07 and 1.08°C/10a. More than 70% of the stations exhibited a notable increase in TNx and TNn. This increasing trend intensified gradually from south to north across the study area, indicating a northward warming gradient. The variability in TX90p, TN90p, SU, and TR indices spanned from 1.66 to 34.53, 1.53 to 35.14, 0.19 to 18.49, and 0.08 to 15.78 d/10a, respectively.
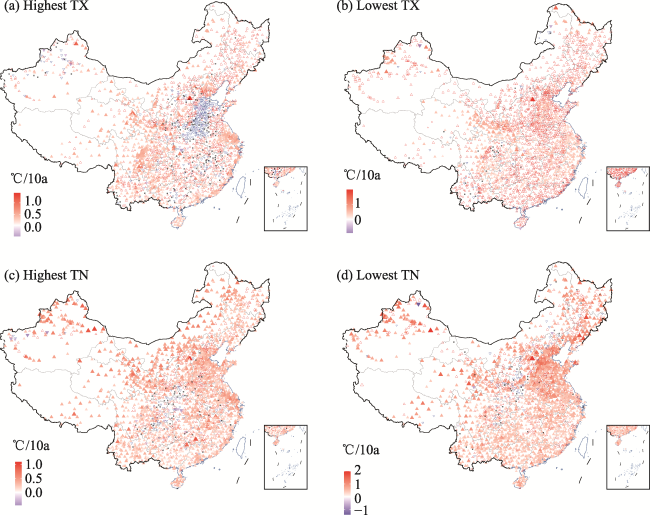
Figure 4 Mapping showing the Mann-Kendall test for TXx, TXn, TNx, and TNn during 1961-2020 in China. Red triangles pointing up and blue triangles pointing down represent statistically significant (α = 0.05) increasing and decreasing trends, respectively. The trend’s magnitude (°C/decade) is indicated by their color and size. Open markers indicate no statistically noteworthy trend at a level of significance of 0.05. Markers with circled crosses indicate stationary trends with Sen’s slope equal to zero.
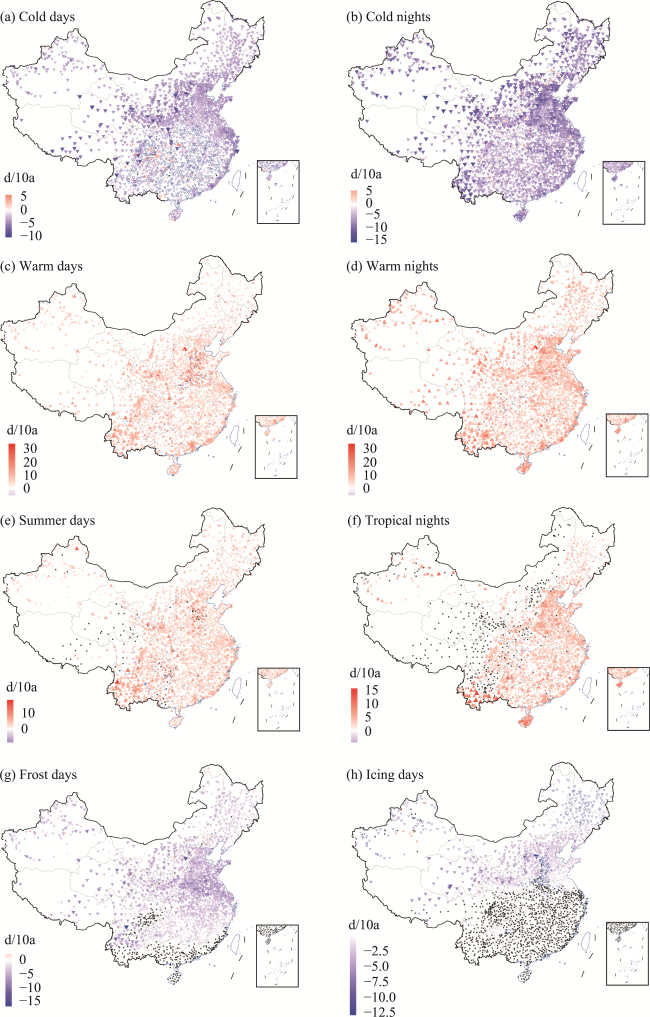
Figure 5 As Figure 4 above, but for 1) percentile-based temperature indices, including TX10p, TN10p, TX90p, TN90p; 2) other temperature indices, including SU, TR, FD, and ID
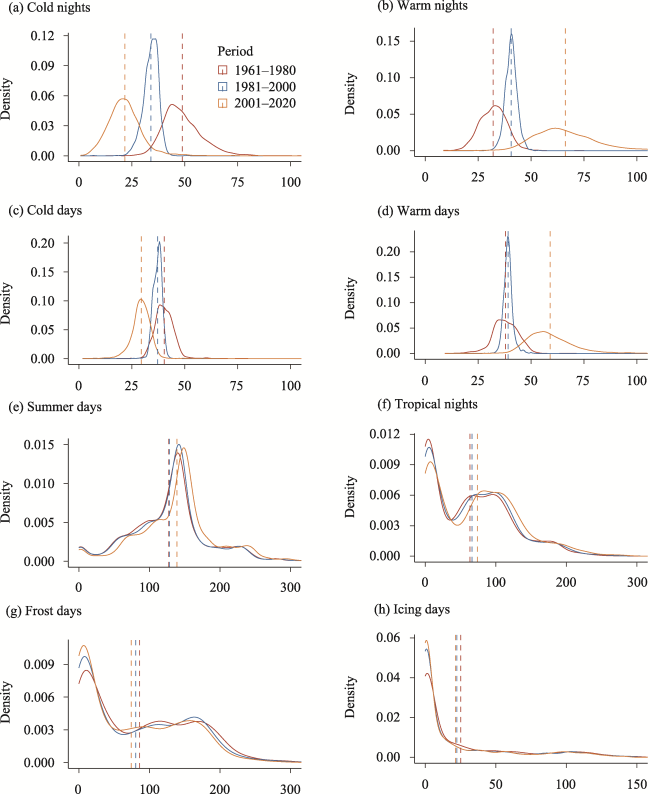
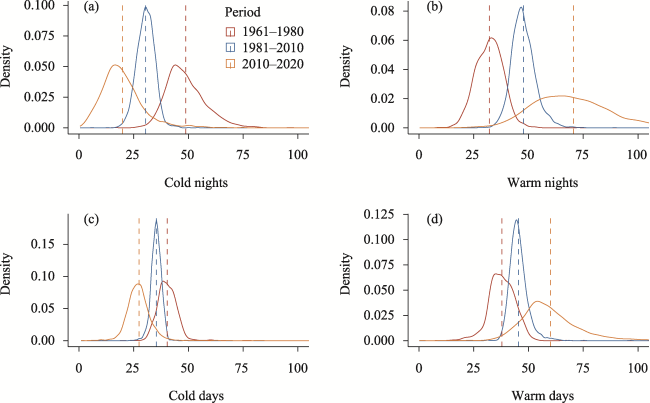
Figure 6 Three periods represented by the following annual probability distribution functions: 1961-1980 (red), 1981-2000 (blue), and 2001-2020 (yellow). The indices include a) cold nights, b) warm nights, c) cold days, d) warm days, e) summer days, f) tropical days, g) frost days, and h) icing days. The dashed line indicates the mean value of each division period.
Regarding the cold extreme indices, TX10p fluctuated between -10.52 and -1.22 d/decade. Notably, the decreasing trend in Central and Southern China was statistically significant (p < 0.05), whereas the other five geographical regions exhibited a highly significant decline (p < 0.001). The TN10p value exhibited a substantial decline, ranging from approximately -16.91 to -1.53 d/10a. Moreover, this decrease was observed across all seven geographical regions, indicating a significant trend (p < 0.001). The most significant transformation occurred in the southwestern region of China and the southern portion of North China. The FD exhibited a decline across the entire region, except in South China. The rate of decrease varied between -17.37 and -0.08 d/decade. The ID trend fluctuated between -12.86 and -0.18 d/10a. Stations with significant declines in ID were primarily distributed around 35°-40°N in the study area.

3.3 Probability distribution functions (PDFs) of extreme temperature indices

To gain a comprehensive understanding of the findings, we conducted a comparative analysis of the probability distributions for each indicator across different periods and examined the patterns within these specific periods. Specifically, the data was categorized into three distinct periods, namely, 1961-1980, 1981-2000, and 2001-2020. Figures 6a-6d display the empirical Probability Distribution Functions (PDFs) that assess the yearly values of the temperature indices based on the percentiles for each period. The PDFs of the percentile-based extreme temperature indices exhibited significant changes over time. The distribution functions for cold nights and cold days shifted to the left, while those for warm nights and warm days shifted to the right. This reveals a marked reduction in the frequency of cold extreme events and a noticeable increase in the frequency of warm extreme events. In addition, we also plotted PDFs for different division periods, and all indicated a consistent direction of mean shift of the PDF curves (Figures S1 and S2). Nevertheless, examining the PDFs for threshold indices, such as summer days, tropical days, frost days, and icing days (Figures 6e-6h), did not reveal distinct changes over the various time intervals. This could be due to the non-Gaussian distribution of these indices, which complicates the accurate quantification of their trends and significance.
Surprisingly, the percentile-based temperature indicators for the period 1981-2000 were more concentrated around the mean value than those for the periods 1961-1980 and 2001-2020, resulting in a significant decrease in variability. The empirical probability distribution curves for the 1981-2000 periods had sharper peaks at the center and shorter tails on either side of the distribution. This notable feature could be linked to abrupt temperature changes and warming hiatus in the Chinese region during this time.

3.4 Response to atmospheric circulation indices

3.4.1 Correlation analysis

Exploring the links between extreme temperature indices and primary atmospheric circulation patterns can provide valuable information regarding the factors affecting temperature fluctuations and extremes in China. These patterns and the extreme temperature index exhibited different degrees of correlation (Figure 7).
Figure 7 Correlation matrix between extreme temperature indicators and atmospheric circulation factors. Significant correlations are marked by * (*p, **p, and ***p<0.001).
The Atlantic Multidecadal Oscillation (AMO), a multidecadal oscillation of North Atlantic sea surface temperatures, exhibited statistically significant relationships (p < 0.05) with all 14 extreme temperature indices. The Arctic Oscillation (AO) is the primary pattern of variations in the climate in the Northern Hemisphere and significantly influences surface temperatures. The findings show a significant inverse relationship (p < 0.05) between AO and the cold extreme indices (TN10p, TX10p, FD, ID, and CSDI) in China. Conversely, a weak positive correlation was observed between the warm extreme indices (TN90p and TR) and AO, although this association was not statistically significant. Furthermore, a significant positive correlation (p < 0.05) was observed among TXn, TNn, and AO. These findings indicated that as AO increased, the number of cold days, cold nights, icing days, and frost days decreased. However, the lowest TN and TX values exhibited opposite patterns. Furthermore, a minimal association was observed between extreme temperature indices and the North Atlantic Oscillation (NAO), North Pacific Index (NPI), Southern Oscillation Index (SOI), and Pacific Decadal Oscillation (PDO). The PDO index exhibited a notable inverse association with the CSDI and a marked direct link with TNn.
The Western Pacific Subtropical High (WPSH) is an important factor in the East Asian summer monsoon system, and its strength and position greatly influence climate fluctuations in China (He and Gong, 2002). Multiple warm extreme indices, including TX90p, TN90p, SU, TR, and WSDI, were positively correlated with the Subtropical High Intensity (WPSHI) and Subtropical High Area (WPSHA). Conversely, some cold indices, such as TX10p, TN10p, FD, ID, and CSDI, displayed significant negative correlations. The absolute indices, including TXx, TNx, and TNn, exhibited a robust positive connection with the WPSHA and WPSHI variables. Consequently, the expansion and strengthening of the WPSH should result in a substantial increase in the occurrence of extreme warm events and a notable decline in the occurrence of extreme cold events in China. The relationship between the Subtropical High Western Ridge Point (WPSHWRP) and temperature extremes indicated that when the WPSH moved westward, cold extremes decreased and warm extremes increased. Conversely, the Subtropical High Ridge Line (WPSHRL) was not significantly correlated with extreme temperature indices.
Atmospheric circulation indices may influence the climate of distant regions by altering the circulation changes in key regions. We conducted a more detailed examination of the correlation between the extreme temperature index and atmospheric circulation factors by analyzing their spatial distribution. The results of this analysis are presented in Figure S3-S6 and Table S1. The relationship between changes in cold extremes and the Arctic Oscillation (AO) was strongly negative, especially in Northeast China, the southern portion of North China, and East China, accounting for 46.9%, 33.5%, 57.7%, and 32.9% of the total number of stations for FD, ID, TN10p, and TX10p, respectively. The areas in Northeast China showed a favorable correlation between variations in TN90p and TX90p and the Arctic Oscillation (AO), accounting for 19.1% and 7.3% of all stations, respectively. Nevertheless, alterations in SU did not exhibit a substantial correlation with AO in any region of the nation. During the 1961-2020 period, a general phenomenon was observed in China where the warm extremes were significantly positively correlated with WPSHI, and the cold extremes were significantly negatively correlated with WPSHI. The areas of positive correlation were usually larger than those of negative correlation.

3.4.2 Wavelet coherence analysis

This study used summer days (SU) and frost days (FD) as representative indices to investigate their time-frequency relationships with atmospheric circulation factors. These two indices were selected because SU directly reflects the frequency of scorching weather in the summer, which is an essential indicator for studying changes in high-temperature extremes. Conversely, FD is a key factor in assessing severe cold events during the winter season and plays a vital role in evaluating extreme winter weather conditions. Studying the relationship between these indicators and atmospheric circulation factors can enhance our understanding of the variations in extreme temperature occurrences over ten years.
The Cross Wavelet Transform (XWT) and Wavelet Coherence (WTC) analyses were employed to investigate the relationships and coherence between various atmospheric circulation factors and the two representative indices (Figures 8 and 9). The results revealed resonance periods of 2 to 5 years and 1 to 2 years between AMO and FD during 1990-1998 and 2005-2008, respectively, indicating consistent relationships between these variables during these periods. Furthermore, the phase angle changes demonstrated that in the latter period, FD lagged behind AMO, and the two series exhibited anti-phase coherence in the first frequency band, suggesting a negative correlation between AMO and FD. Similarly, AMO and SU exhibited resonance periods of 3-4 years during 1975-1993 and 1-4 years during 1994-2000, with SU leading in both periods. Additionally, Figure 9 shows significant resonance periods of 1-3 years between SOI and FD during 1971-1973 and 2007-2011, and a resonance period of 2.5-5 years during 1984-2001. Finally, SOI and SU exhibited resonance periods of 1-3 years during 1967-1973 and 2-5 years during 1975-2001. In summary, the XWT and WTC analyses illustrated in Figures 8 and 9 indicate significant resonance periods and coherence between atmospheric circulation patterns and extreme temperature indicators, suggesting potential relationships and influences between these variables.
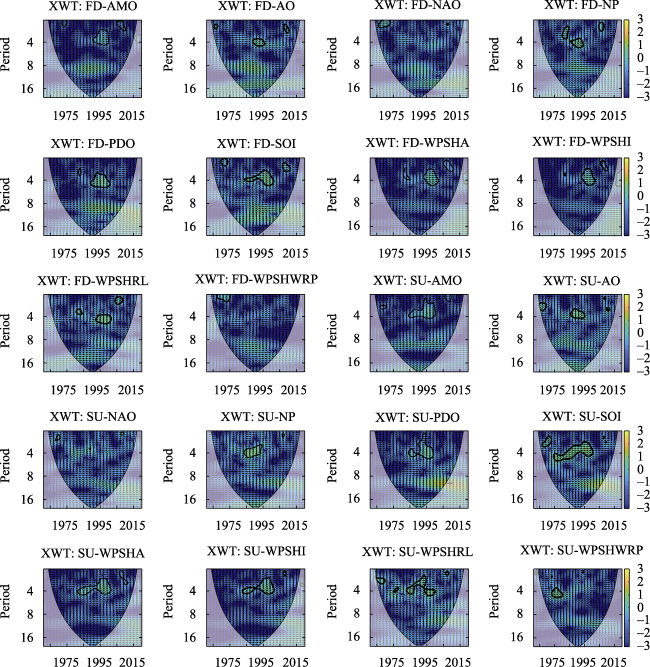
Figure 8 XWT spectra of extreme temperature indices (SU, FD) and atmospheric circulation factors. The cone of influence of wavelet boundary effects is represented by a thin solid U-shaped black line, outside of which power is not considered because of boundary effects. The thick solid black line shows a significant correlation between the two as determined by a red noise test with a 95% confidence level. The left arrow (←) indicates an inverse relationship between the extreme temperature indicator and atmospheric circulation factors, i.e., a negative correlation; the right arrow (→) indicates a direct relationship between the two, i.e., a positive correlation. The up arrow (↑) indicates a lag of 1/4 period of extreme temperature index behind atmospheric circulation factors, and the down arrow (↓) indicates a lead of 1/4 period of extreme temperature index ahead of atmospheric circulation factors.
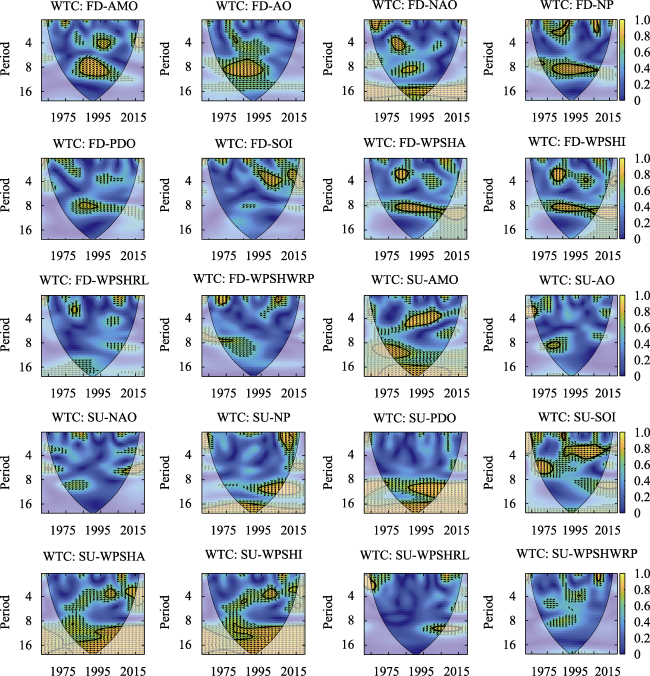
Figure 9 WTC spectra of SU, FD and atmospheric circulation factors

4 Discussion

In our analysis of the trends and variability in daily temperature extremes, we observed significant warming trends in most regions across China from 1961 to 2020. Notably, the lowest temperature indices exhibited greater warming trends than the highest temperature indices (Figures 3-5). These findings are consistent with those of a multitude of prior studies conducted at the regional or national levels across various global contexts. Numerous researchers have studied extreme temperature events in various areas across China, and their findings align with the general warming trends observed across different regions (Table 3). Various studies in different regions, such as the Loess Plateau, Yunnan-Guizhou Plateau, Tibetan Plateau, and Yangtze River Basin, and at the national level have shown similar trends in temperature extremes and regional warming from the 1960s to the early 2000s. Compared with previous studies focusing on specific regions, this study demonstrated some variations in the magnitude of the trends. These discrepancies can be attributed to the differences in the spatial scope, temporal scale, and data sources utilized in the analyses.
Table 3 Comparison of extreme temperature trends derived from this study and other studies in China. At the 0.05 significance level, values displayed in bold signify that the trend is considered statistically significant.
Index This
study
China North China
(Loess Plateau)
Western China
(Tibetan
Plateau)
Central and South China (Yangtze River) Southwest China
(Yunnan-Guizhou
Plateau)
TN90p 8.27 1.0 3.41 4.00 2.95 2.06
TX90p 5.20 0.6 2.60 3.43 1.71 2.06
TN10p -6.67 -1.1 -4.31 -4.92 -3.45 -1.35
TX10p -2.82 -0.5 -2.71 -2.84 -1.03 -0.38
TR 2.67 1.9 1.24 - 1.05 2.73
SU 2.77 2.2 2.76 0.42 2.16 2.86
ID -0.92 -1.0 -2.21 -7.74 -0.42 -
FD -2.96 -2.6 -3.22 -5.68 -3.04 -1.53
WSDI 1.62 0.4 0.68 3.31 0.73 -
CSDI -0.92 -1.0 -0.69 -2.55 -1.60 -

Note: Temporal scale and data sources: China during 1960-2016 with 794 sites (Wang et al., 2021); North China during 1960-2013 with 72 sites (Sun et al., 2016); Western China during 1971-2011 with 4 sites (Wang et al., 2013); Central and South China during 1960-2012 with 143 sites (Guan et al., 2015); Southwest China during 1960-2019 with 68 sites.

On the other hand, we found that the rise in nighttime temperature surpassed the increase in daytime temperature, which aligns with earlier research findings (Zhang et al., 2017; Wang et al., 2021). This “asymmetry warming” phenomenon can be attributed to shifts in cloud cover, as highlighted by Cox et al. (2020). Increasing cloud cover has led to elevated nighttime temperatures. This is because clouds act as barriers, trapping heat close to the ground during the night. Conversely, clouds block the sun during the day, which results in a cooling effect. In addition, the considerable population growth and accelerated economic and social development in China have resulted in substantial structural transformations, including urbanization, alterations in the underlying surface, and shifts in energy consumption patterns. These factors collectively magnify nighttime heat extremes in China (Sun et al., 2019; Lin et al., 2020; Shi et al., 2021).
The Western Pacific Subtropical High (WPSH) plays a pivotal role in modulating summer wind systems over East Asia. Its position and intensity are closely linked to the climate anomalies observed in China. Under the influence of a warming climate, WPSH has experienced significant enlargement and intensification throughout the year, exhibiting pronounced northwestward extension (Zhou et al., 2009; Guan et al., 2019). The findings depicted in Figure 7 demonstrate an evident positive connection between warm extreme temperature indices and WPSH from 1961 to 2020, whereas the cold extreme indices exhibit an inverse relationship with the subtropical high area (WPSHA) and intensity (WPSHI). This phenomenon is commonly observed at most weather stations. Corroborating these findings, Sun et al. (2016) reported a positive association between WPSHI and warm extremes, such as summer days (SU) and warm days (TX90p), and a significant negative association with cold extremes, including cold nights (TN10p), cold days (TX10p), and frost days (FD). As WPSH extends westward, it may lead to abnormally high pressures, decreased air movement, and wind divergence, which may trigger extremely high temperatures (Deng et al., 2020). Projections of increased variability in the WPSH in the future are likely to culminate in more frequent occurrences of extreme weather events in the highly populated nations of East Asia (Yang et al., 2022).
Correlations were discovered in this study between the temperature fluctuations in China and the AO, AMO, and PDO. These results are consistent with those of previous studies (Zhong et al., 2017; Tong et al., 2019; Yuan and Li, 2019). AO creates a fluctuating pattern, alternating atmospheric pressure between positive and negative phases in the northern polar and mid-latitudes, as described by Gong et al. (2001). Similar to the zonal cycle, this pattern intensifies in the winter months and diminishes in the summer months. Consequently, AO was strongly and negatively associated with indicators that were primarily observed during the winter months (TN10p, TX10p, FD, and ID). Conversely, its association with the indicators that mainly appeared during the warmer months (TN90p, TX90p, SU, and TXx) is not as strong. AMO had a notable influence on the climate at the global and regional levels during the 20th century. Wang et al. (2013a) explored the link between AMO and China’s temperature variability. A consistent distribution of cold and warm anomalies was discovered throughout China, including both the eastern and western regions. Our results showed that from 1961 to 2020, there was a steady negative relationship between cold weather extremes in China and AMO, with frequent significant connections between temperature extremes and AMO in China.

5 Conclusions

This study offers valuable information on the trends in extreme temperature indicators in China over the past six decades, including their responses to atmospheric circulation patterns. Based on the daily data of the lowest and highest temperatures, we examined 14 extreme temperature indicators suggested by the ETCCDI. The trends showed that warm nights (Z = 6.98) and cold nights (Z = −7.94) experienced the most notable shifts. These results are consistent with those of similar studies conducted in other geographical areas worldwide.
Furthermore, the examination of Pearson’s correlation and wavelet coherence indicated a notable connection between extreme temperature indices and atmospheric circulation patterns. AMO and AO indices exhibited an inverse relationship with the cold index and a direct relationship with the warm index. A strong connection was found between the intensity and area measurements of the WPSH and extreme warm weather events, whereas an opposite relationship was found between extreme cold events. These correlations and the observed resonance between these factors vary in different time-frequency domains, indicating a multi-factorial and complex mechanism behind the observed trends in extreme temperature events. Understanding these causal mechanisms is paramount for accurately modeling and projecting future changes in extreme temperature events and devising effective strategies to address their impacts. Further research and monitoring are critical for a deeper understanding of these intricate interactions and their significance in regional and global climate dynamics.

Supplementary materials

Figure S1 Empirical PDFs of percentile-based temperature indices for the three periods (red, 1961-1980; blue, 1981-2010; and yellow, 2011-2020)
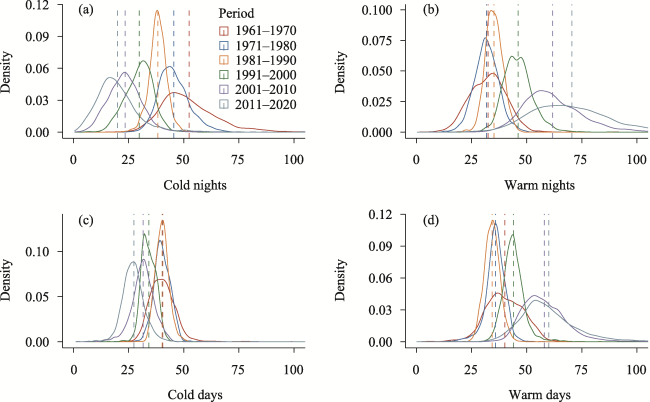
Figure S2 Empirical PDFs of percentile-based temperature indices for the six consecutive 10-year periods
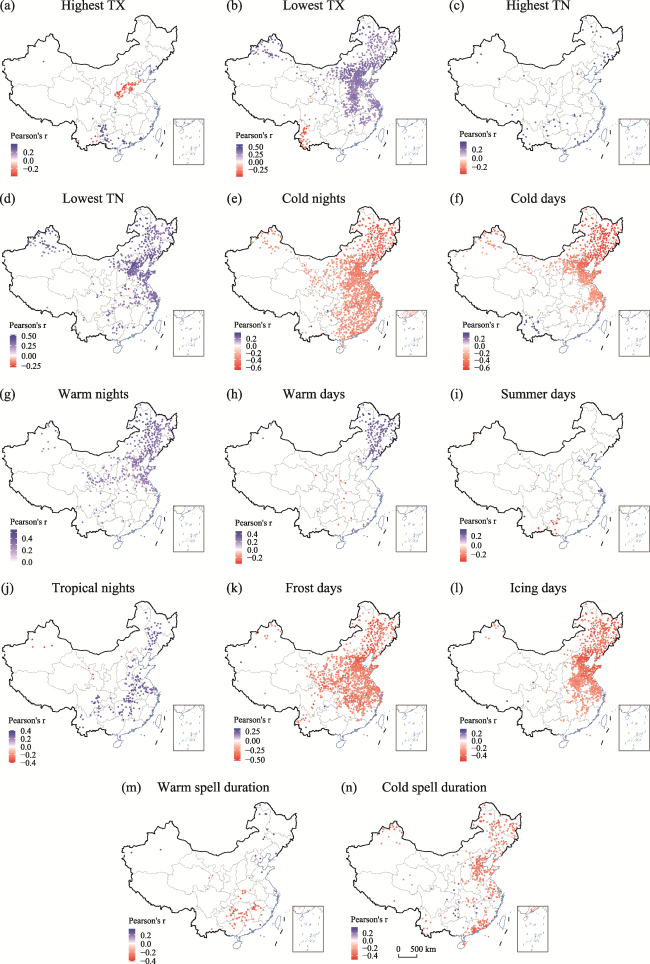
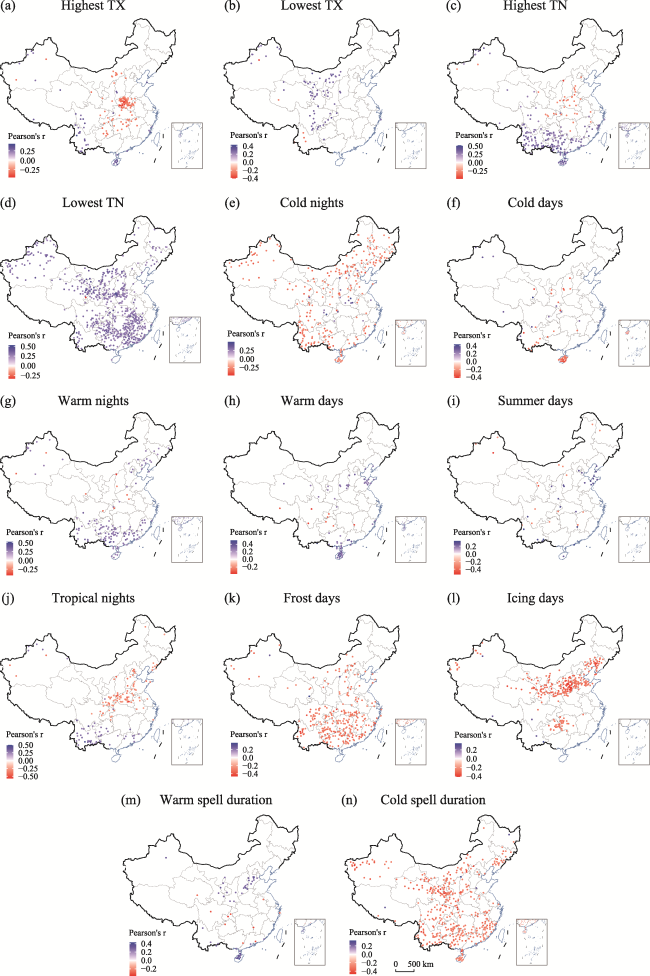
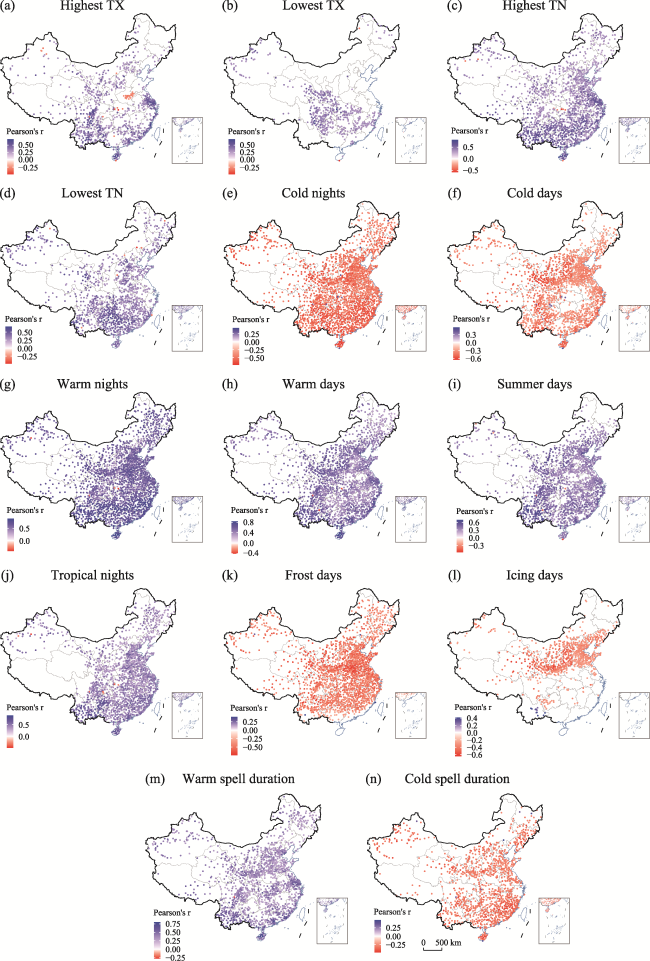
Figure S3 Correlation coefficients between extreme temperature indices and the Arctic Oscillation (AO) in China during 1961-2020. Only meteorological stations with significant correlation (p < 0.05) are shown.
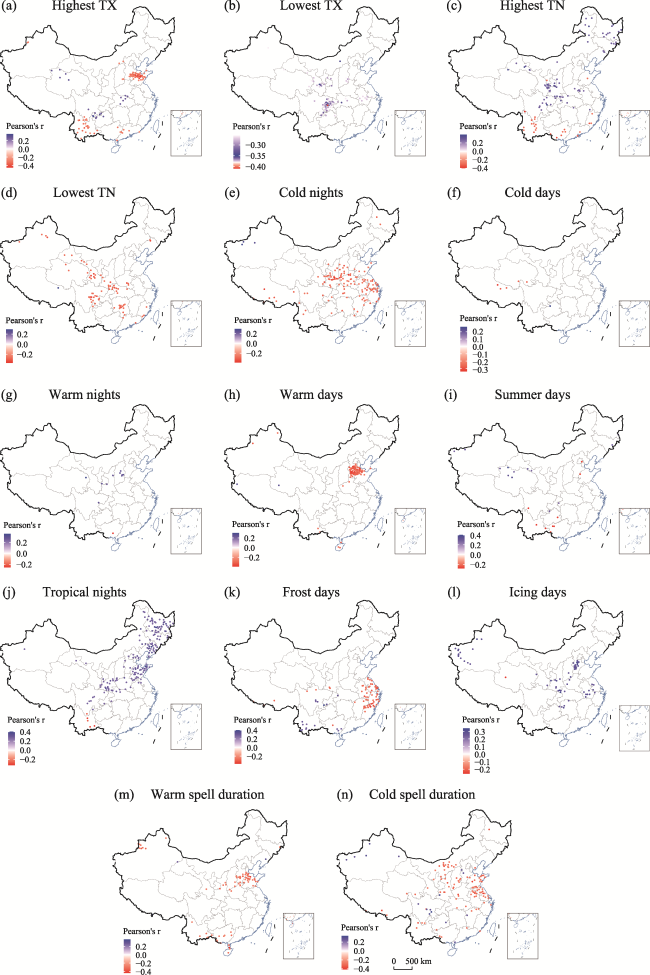
Figure S4 Correlation coefficients between extreme temperature indices and the Pacific Decadal Oscillation (PDO) in China during 1961-2020. Only meteorological stations with significant correlation (p< 0.05) are shown.
Figure S5 Correlation coefficients between extreme temperature indices and the Subtropical High Intensity index (WPSHI) in China during 1961-2020. Only meteorological stations with significant correlation (p < 0.05) are shown.
Figure S6 Correlation coefficients between extreme temperature indices and the Subtropical High Western Ridge Point index (WPSHWRP) in China during 1961-2020. Only meteorological stations with significant correlation (p < 0.05) are shown.
Figure S7 Correlation coefficients between extreme temperature indices and the Subtropical High Ridge Line index (WPSHRL) in China during 1961-2020. Only meteorological stations with significant correlation (p < 0.05) are shown.
Table S1 Correlation cofficients between extreme temperature index and atmospheric circulation factors in seven regions of China during 1961-2020

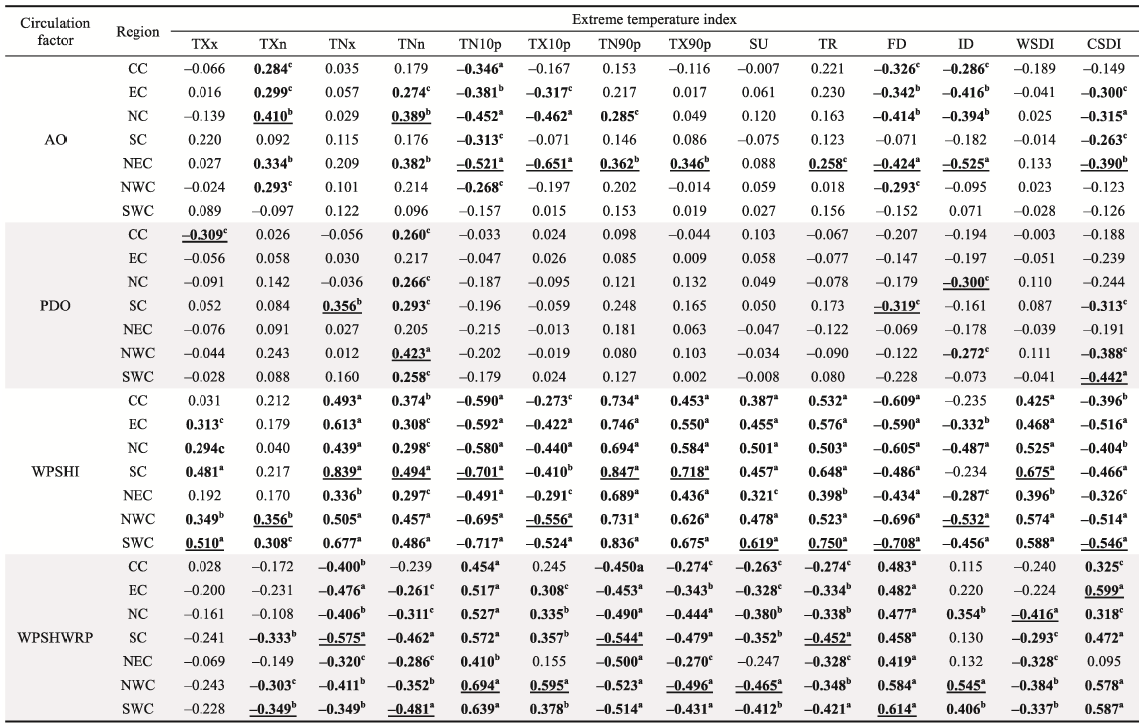
Note: a Corelation is snifcant at the 0.001 level; b Correlation is significant at the 0.01 level; c correlation is significant at the 0.05 level.

[1]
AghaKouchak A, Chiang F, Huning L S et al., 2020. Climate extremes and compound hazards in a warming world. Annual Review of Earth and Planetary Sciences, 48(1): 519-548.

[2]
Alexander L V, Zhang X, Peterson T C et al., 2006. Global observed changes in daily climate extremes of temperature and precipitation. Journal of Geophysical Research: Atmospheres, 111(D5).

[3]
Bartholy J, Pongrácz R, 2007. Regional analysis of extreme temperature and precipitation indices for the Carpathian Basin from 1946 to 2001. Global and Planetary Change, 57(1): 83-95.

[4]
Blandford T R, Humes K S, Harshburger B J et al., 2008. Seasonal and synoptic variations in near-surface air temperature lapse rates in a mountainous basin. Journal of Applied Meteorology and Climatology, 47(1): 249-261.

[5]
Buckley L B, Huey R B, 2016. Temperature extremes: Geographic patterns, recent changes, and implications for organismal vulnerabilities. Global Change Biology, 22(12): 3829-3842.

[6]
Cao L, Zhu Y, Tang G et al., 2016. Climatic warming in China according to a homogenized data set from 2419 stations. International Journal of Climatology, 36(13): 4384-4392.

[7]
Chen X, Li N, Jiang D, 2023. Global and regional changes in working-age population exposure to heat extremes under climate change. Journal of Geographical Sciences, 33(9): 1877-1896.

[8]
China Meteorological Administration Climate Change Centre,2021. Blue Book on Climate Change in China 2021. Beijing: Science Press. (in Chinese)

[9]
Cox D T C, Maclean I M D, Gardner A S et al., 2020. Global variation in diurnal asymmetry in temperature, cloud cover, specific humidity and precipitation and its association with leaf area index. Global Change Biology, 26(12): 7099-7111.

[10]
De Lima M I P, Santo F E, Ramos A M et al., 2013. Recent changes in daily precipitation and surface air temperature extremes in mainland Portugal, in the period 1941-2007. Atmospheric Research, 127: 195-209.

[11]
Deng K, Yang S, Gu D et al., 2020. Record-breaking heat wave in southern China and delayed onset of South China Sea summer monsoon driven by the Pacific Subtropical High. Climate Dynamics, 54: 3751-3764.

[12]
Ebi K L, Vanos J, Baldwin J W et al., 2021. Extreme weather and climate change: Population health and health system implications. Annual Review of Public Health, 42(1): 293-315.

[13]
Fischer E M, Schär C, 2010. Consistent geographical patterns of changes in high-impact European heatwaves. Nature Geoscience, 3(6): 398-403.

[14]
Fu D, Ding Y, 2021. The study of changing characteristics of the winter temperature and extreme cold events in China over the past six decades. International Journal of Climatology, 41(4): 2480-2494.

[15]
Gong D, Wang S, Zhu J, 2001. East Asian Winter Monsoon and Arctic Oscillation. Geophysical Research Letters, 28(10): 2073-2076.

[16]
Gong X, Wang X, Li Y et al., 2022. Observed changes in extreme temperature and precipitation indices on the Qinghai-Tibet Plateau, 1960-2016. Frontiers in Environmental Science, 10: 888397.

[17]
Griffiths M L, Bradley R S, 2007. Variations of twentieth-century temperature and precipitation extreme indicators in the northeast United States. Journal of Climate, 20(21): 5401-5417.

[18]
Grinsted A, Moore J C, Jevrejeva S, 2004. Application of the cross wavelet transform and wavelet coherence to geophysical time series. Nonlinear Processes in Geophysics, 11(5/6): 561-566.

[19]
Guan W, Hu H, Ren X et al., 2019. Subseasonal zonal variability of the Western Pacific Subtropical High in summer: climate impacts and underlying mechanisms. Climate Dynamics, 53(5): 3325-3344.

[20]
Guan Y, Zhang X, Zheng F et al., 2015. Trends and variability of daily temperature extremes during 1960-2012 in the Yangtze River Basin, China. Global and Planetary Change, 124: 79-94.

[21]
Hao Z, AghaKouchak A, Phillips T J, 2013. Changes in concurrent monthly precipitation and temperature extremes. Environmental Research Letters, 8(3): 034014.

[22]
He X, Gong D, 2002. Interdecadal change in Western Pacific Subtropical High and climatic effects. Journal of Geographical Sciences, 12(2): 202-209.

[23]
Horton D E, Johnson N C, Singh D et al., 2015. Contribution of changes in atmospheric circulation patterns to extreme temperature trends. Nature, 522(7557): 465-469.

[24]
Jiang W, He G, Long T et al., 2017. Assessing light pollution in China based on nighttime light imagery. Remote Sensing, 9(2): 135.

[25]
Jiang Z, Song J, Li L et al., 2012. Extreme climate events in China: IPCC-AR4 model evaluation and projection. Climatic Change, 110(1): 385-401.

[26]
Kendall M G, 1970. Rank Correlation Methods. Griffin.

[27]
Li Y, Shi G, Chen Z, 2021. Spatial and temporal distribution characteristics of ground-level nitrogen dioxide and ozone across China during 2015-2020. Environmental Research Letters, 16(12): 124031.

[28]
Li Z, He Y, Wang P et al., 2012. Changes of daily climate extremes in southwestern China during 1961-2008. Global and Planetary Change, 80/81: 255-272.

[29]
Liang X, Niu Z, Li X, 2023. Temporal and spatial variations of extreme climate events in northwestern China from 1960 to 2020. Sustainability, 15(20): 14882.

[30]
Lin L, Gao T, Luo M et al., 2020. Contribution of urbanization to the changes in extreme climate events in urban agglomerations across China. Science of the Total Environment, 744: 140264.

[31]
Liu L, Gou X, Wang X et al., 2024. The increases in extreme climatic events over the northeastern Tibetan Plateau and their association with atmospheric circulation changes. Atmospheric Research, 304: 107410.

[32]
Liu Q, Tan Z-M, Sun J et al., 2020. Changing rapid weather variability increases influenza epidemic risk in a warming climate. Environmental Research Letters, 15(4): 044004.

[33]
Mann H B, 1945. Nonparametric tests against trend. Econometrica: Journal of the Econometric Society, 13: 245-259.

[34]
Masson-Delmotte V, Zhai P, Pirani A et al., 2021. Climate change 2021: The physical science basis. Contribution of Working Group I to the Sixth Assessment Report of the Intergovernmental Panel on Climate Change. Cambridge University Press.

[35]
Mishra V, Ganguly A R, Nijssen B et al., 2015. Changes in observed climate extremes in global urban areas. Environmental Research Letters, 10(2): 024005.

[36]
Newman R, Noy I, 2023. The global costs of extreme weather that are attributable to climate change. Nature Communications, 14(1): 6103.

[37]
Ozturk T, Turp M T, Türkeş M et al., 2017. Projected changes in temperature and precipitation climatology of Central Asia CORDEX Region 8 by using RegCM4. 3.5. Atmospheric Research, 183: 296-307.

[38]
Sen P K, 1968. Estimates of the regression coefficient based on Kendall’s tau. Journal of the American Statistical Association, 63(324): 1379-1389.

[39]
Shi Z, Xu X, Jia G, 2021. Urbanization magnified nighttime heat waves in China. Geophysical Research Letters, 48(15): e2021GL093603.

[40]
Sun W, Mu X, Song X et al., 2016. Changes in extreme temperature and precipitation events in the Loess Plateau (China) during 1960-2013 under global warming. Atmospheric Research, 168: 33-48.

[41]
Sun Y, Liu S, Dong Y et al., 2019. Spatio-temporal evolution scenarios and the coupling analysis of ecosystem services with land use change in China. Science of The Total Environment, 681: 211-225.

[42]
Tong S, Li X, Zhang J et al., 2019. Spatial and temporal variability in extreme temperature and precipitation events in Inner Mongolia (China) during 1960-2017. Science of The Total Environment, 649: 75-89.

[43]
Torrence C, Webster P J, 1998. The annual cycle of persistence in the El Nño/Southern Oscillation. Quarterly Journal of the Royal Meteorological Society, 124(550): 1985-2004.

[44]
Wang H, Jing H, Sun Y et al., 2024. Exploring the spatial-temporal evolution characteristics of extreme heat events and driving factors in seven geographic regions of China (1980-2021). Urban Climate, 56: 102002.

[45]
Wang J, Yang B, Ljungqvist F C et al., 2013a. The relationship between the Atlantic Multidecadal Oscillation and temperature variability in China during the last millennium. Journal of Quaternary Science, 28(7): 653-658.

[46]
Wang S, Zhang M, Wang B et al., 2013b. Recent changes in daily extremes of temperature and precipitation over the western Tibetan Plateau, 1973-2011. Quaternary International, 313-314: 110-117.

[47]
Wang X, Li Y, Wang M et al., 2021. Changes in daily extreme temperature and precipitation events in mainland of China from 1960 to 2016 under global warming. International Journal of Climatology, 41(2): 1465-1483.

[48]
Wang Y, Ren F, Zhang X, 2014. Spatial and temporal variations of regional high temperature events in China. International Journal of Climatology, 34(10): 3001.

[49]
Wu J, Gao X, 2013. A gridded daily observation dataset over China region and comparison with the other datasets. Chinese Journal of Geophysics, 56(4): 1102-1111. (in Chinese)

[50]
Yang K, Cai W, Huang G et al., 2022. Increased variability of the Western Pacific Subtropical High under greenhouse warming. Proceedings of the National Academy of Sciences, 119(23): e2120335119.

[51]
You Q, Kang S, Aguilar E et al., 2011. Changes in daily climate extremes in China and their connection to the large scale atmospheric circulation during 1961-2003. Climate Dynamics, 36(11): 2399-2417.

[52]
Yuan C, Li W, 2019. Variations in the frequency of winter extreme cold days in northern China and possible causalities. Journal of Climate, 32(23): 8127-8141.

[53]
Zhai P, Sun A, Ren F et al., 1999. Changes of climate extremes in China. In: Weather and Climate Extremes:Changes, Variations and a Perspective from the Insurance Industry, 203-218.

[54]
Zhai P M, Pan X H, 2003. Trends in temperature extremes during 1951-1999 in China. Geophysical Research Letters, 30(17): 1913.

[55]
Zhang K, Luo J, Peng J et al., 2022. Analysis of extreme temperature variations on the Yunnan-Guizhou Plateau in southwestern China over the past 60 years. Sustainability, 14(14): 8291.

[56]
Zhang Y, Gao Z, Pan Z et al., 2017. Spatiotemporal variability of extreme temperature frequency and amplitude in China. Atmospheric Research, 185: 131-141.

[57]
Zhao N, Chen M, 2021. A comprehensive study of spatiotemporal variations in temperature extremes across China during 1960-2018. Sustainability, 13(7): 3807.

[58]
Zhong K, Zheng F, Wu H et al., 2017. Dynamic changes in temperature extremes and their association with atmospheric circulation patterns in the Songhua River Basin, China. Atmospheric Research, 190: 77-88.

[59]
Zhou T, Yu R, Zhang J et al., 2009. Why the western Pacific Subtropical High has extended westward since the late 1970s. Journal of Climate, 22(8): 2199-2215.

[60]
Zhou Y, Ren G, 2011. Change in extreme temperature event frequency over mainland of China, 1961-2008. Climate Research, 50(2/3): 125-139.

[61]
Zhu Y, Huang L, Li J et al., 2018. Sources of particulate matter in China: Insights from source apportionment studies published in 1987-2017. Environment International, 115: 343-357.

Outlines

/