Research Articles

Land use change and its influencing factors along railways in Africa: A case study of the Ethiopian section of the Addis Ababa-Djibouti Railway

  • ZHAO Shengbo , 1 ,
  • QI Junheng 1 ,
  • LI Dongxue 2 ,
  • WANG Xingping , 1, 3, *
Expand
  • 1. School of Architecture, Southeast University, Nanjing 210096, China
  • 2. School of Architecture and Planning, Yunnan University, Kunming 650504, China
  • 3. Center for International Collaboration and Research on Development and Planning of Sustainable Industrial Parks, Southeast University, Nanjing 210096, China
*Wang Xingping (1970-), Professor, specialized in economic geography, urbanization and urban planning. E-mail:

Zhao Shengbo (1991-), Postdoctoral Researcher, specialized in urbanization and urban planning in Africa. E-mail:

Received date: 2023-06-03

  Accepted date: 2024-02-07

  Online published: 2024-09-11

Supported by

National Natural Science Foundation of China(52078115)

Abstract

Railways are a crucial part of the African transport network and have a significant impact on the socio-economy and urban development. Previous studies have mainly considered the impacts of railways in Africa from the perspective of economy, politics, security, and natural environment with few attempts to consider land use. Based on Landsat remote sensing data for the 10 km buffer zone along the Ethiopian section of the Addis Ababa-Djibouti Railway (ADR) in 2013, 2017, and 2021, we studied the land use change (LUC) in the area and explored its influencing factors using the ordinary least square model (OLS) and geographical weighted regression model (GWR). There were six key results. (1) Farmland, forest, grassland, and others (including sandy land and bare land) were the primary types of land use, but from 2013 to 2021, the area of built-up land and farmland increased, whereas the area of forest, grassland, and other land decreased. (2) There was a noticeable pattern in the degree of change in the area of built-up land, farmland, and forest as the buffer distance increased along the railway. This pattern indicated a gradual shift in land use and LUC gradients. (3) The land use structure and its changes in the areas surrounding different stations displayed obvious differences. (4) The construction and operation of the ADR is one of the direct factors affecting landscape change along the railway. (5) The distance from the train station, whether the station provides a passenger service, the population size, and the distance from the central city had a positive effect on the expansion of built-up land surrounding the station. The factor of whether the station provides a freight service had a negative correlation with the expansion of built-up land. Socio-economic factors have gradually replaced railway factors as the main driving force of the expansion of built-up land around the stations. (6) The effect strength of different factors on the expansion of built-up land varied in the areas surrounding different stations.

Cite this article

ZHAO Shengbo , QI Junheng , LI Dongxue , WANG Xingping . Land use change and its influencing factors along railways in Africa: A case study of the Ethiopian section of the Addis Ababa-Djibouti Railway[J]. Journal of Geographical Sciences, 2024 , 34(6) : 1128 -1156 . DOI: 10.1007/s11442-024-2242-y

1 Introduction

As a large-scale and regional infrastructure, a railway can influence the development of the surrounding area along the line and even the broader region from many perspectives. Railways contribute to the reduction of journey time, effectively shrinking the perceived distances between locations (Docherty, 2000). The building of railway lines, connecting cities with their neighboring areas, the rest of the country and even the rest of the world through high-speed travel, can have significant implications on the direction of urban evolution (Wang et al., 2022; Loo et al., 2023). The most direct impact of a railway on the area along the line and the larger region is to cause a change of accessibility, which will indirectly affect the location preferences of individual consumers and producers, resulting in spatial flows of production factors, such as labor, capital, information, and technology. In turn, the changes in regional factors and spatial structure, such as population, employment, industrial development, land use, and the overall urban system, will be influenced by the presence and impact of railways (Li et al., 2013). Railways can promote economic and social links between cities and contribute to the development of regional economic integration (Wang et al., 2011). From a geographical perspective, the impact of railways on social and economic development is manifested as visible changes in the landscape of the affected regions. This includes the expansion of the urban built-up area, transformation of forest and farmland, demolition and reconstruction of buildings (Li et al., 2013), reduction of vegetation diversity, and the conversion of farmland to built-up land (Liu et al., 2020). Therefore, land use change (LUC) is often used as an important tool to study the impact of railways on regional socio-economic and urban development.
The many studies of the impact of railways on land use have largely considered the following four aspects. The first is the spatiotemporal changes of land use along the railway and their influencing factors. Most studies have been based on satellite remote sensing images to analyze the spatiotemporal changes of land use in railway-impacted areas from multiple dimensions, including the changes of land use structure and the amplitude, speed, and direction of LUC (Han et al., 2019; Wang et al., 2019), and investigations of the factors influencing LUC by qualitative or quantitative methods. The second is the impact of railways on the regional ecology and landscape. Studies of the deterioration of land quality and its recovery (Jin et al., 2010; Tang et al., 2010), vegetation cover changes (Yang et al., 2021), soil and water conservation (Liu et al., 2017), and landscape degradation and restoration (Dong et al., 2018; Santos et al., 2020) have been conducted in response to concerns about the environmental impact of railway construction and operation. The third is the impact of railway stations on land development, such as their influence on land use intensity (Niu et al., 2021), mode of development (Rong et al., 2022), and land value (Debrezion et al., 2007) in surrounding areas. The fourth is the future-oriented regional land development model and strategy along the railway. Previous studies focused on areas including railway stations and the surrounding area, as well as the areas along the railway line and the hinterland areas outside the station area (Li, 2011). The core objective of these studies was to enhance the comprehensive benefits of land development by harnessing the advantages offered by railways (Eizaguirre-Iribar et al., 2020).
The construction and development of railways can cause spatiotemporal changes of land use in nearby areas, such as the land along the railway line. From the perspective of the railway infrastructure, the construction and operation of railways require a certain amount of temporary land use for activities such as construction staging areas, material storage, and access routes. Additionally, land is needed permanently for the main line and station yard (Jin et al., 2010). From a broader perspective, the impact of railways on land use can be considered a linear cutting process (Guo et al., 2015). The spatiotemporal changes in land use are manifested through changes in the scale of land use (e.g., the reduction of farmland and the increase of built-up land) and the structural changes of land use. For example, the location of the built-up land around the railway moves toward the railway line, the degree of change in the different types of land shows regular characteristics with the change in distance from the railway, and the landscape and ecological diversity also change (Liu et al., 2020; He et al., 2021; Toffolo et al., 2021). In addition to the railway, there are other factors influencing the LUC in the areas surrounding railways. Empirical studies of railways in the Xinjiang region of China have shown that location conditions, population agglomerations, the level of economic development and continuous improvements in urban construction are the main factors responsible for changes in the structure of urban land use along railway lines (Zeng et al., 2012; Zibibula et al., 2012). The spatial location of railway stations also plays a significant role in determining the relationship between land use and population distribution (Li et al., 2022)
The development of railways in Africa dates back to the 1850s. The earliest railway in Africa was constructed in Alexandria, Egypt, in 1852 and the network mileage increased significantly during the colonial period. In the more than half a century since most African countries achieved independence, railways have been further developed across the continent, with Jiang (2014) recording a total mileage of 83,209 km. Railways have subsequently played an important role in Africa’s social and economic development. An assessment of railway data in 43 sub-Saharan African countries over the period of 1960-2015 revealed a strong correlation between transport investment, represented by railways, and economic development (Jedwab et al., 2019). A study of the Standard Gauge Railway (SGR) in Kenya also produced similar results. The SGR project has led to the creation of more than 46,000 local jobs and driven significant growth in the building and construction sector as well as a steady increase in trade in Kenya (Githaiga and Bing, 2019). However, the limited extent of the railway network in Africa and the uneven regional distribution (Jedwab et al., 2019), coupled with the problems associated with the use of different gauges, disrepair of some railways, and poor operation and management (Jiang, 2014; Mukwena, 2018; Chen, 2021), have led to the insufficient volume and relatively poor connectivity of the railway network in Africa, which has limited the role of railways in driving Africa’s social and economic development. In the context of the relative lack of early investment, professional personnel, operation and management capacity, and other railway development necessities, railway development is still a challenging task for some late-developing regions in Africa, and there are large differences in the levels of regional development achieved along railway lines (Zhao et al., 2023).
Previous studies mainly investigated the effect of railways on the development of Africa in terms of the economy, politics, security, and the natural environment, but few attempts have been made from the perspective of land use, and it has therefore not been possible to objectively and comprehensively understand the real effect of railways on the social economy and urban development in Africa, especially in areas close to railways. The few studies of land use in railway-impacted areas in Africa have mainly focused on the ecological effects of railways, such as vegetation cover changes (Cilliers et al., 1998; Song et al., 2018), biodiversity (Mararakanye et al., 2017; Heneidy et al., 2021), and wildlife protection (Jiang, 2020), while a comprehensive analysis of various types of LUC and urban development along railway lines has not been conducted. It is therefore necessary to explore the development of African railways from the perspective of land use to objectively assess the regional effects of railway development, which have important implications for economic development, urban construction, ecological protection, and policy formulation in railway-impacted areas.
The Addis Ababa-Djibouti Railway (ADR) is the first standard electrified railway in East Africa, connecting Ethiopia and Djibouti. The 752.7 km railway has 21 stops, starting at Sebeta station in Ethiopia in the west and ending at Doraleh Port in Djibouti in the east. The Ethiopian section of the ADR is 690.7 km long with 17 stations, and the Djibouti section is 62 km long with 4 stations (Baike, 2022). The ADR was built by Chinese companies, with work commencing in 2012. The Ethiopian section of the ADR opened to traffic in October 2016, the Djibouti section opened in January 2017, and the whole railway officially opened for commercial operation in January 2018. The single travel time for passenger and freight between Ethiopia and Djibouti has been shortened from 7 days to 12 hours by the railway, which not only facilitates the transport of passengers and goods between the two countries, but also promotes regional economic and social development and the establishment of a railway economic corridor. However, some concern and criticism has also arisen, mainly due to the destruction of the natural environment along the railway, farmland occupation, and conflicts of interest with residents. The impact of the ADR on the region along the line needs to be evaluated comprehensively and objectively.
In this study, we considered the entire Ethiopian section of the ADR (690.7 km) as an empirical case, analyzed the overall characteristics and regional spatial differences of LUC along the railway line using land use data for different years before and after the construction of the ADR, and explored the factors influencing LUC. This study was conducted with the aim of providing an objective understanding of the spatiotemporal changes in the region along the Ethiopian section of the ADR. Its findings will enable an accurate assessment of the impact of the railway on the development of the surrounding region, providing a reference for future planning, development, and environmental protection of the region along the railway line, and supporting policy formulation in relevant government departments in Ethiopia. Additionally, it holds particular relevance for examining land use along African railways, providing valuable insights and complementary perspectives.
The rest of the paper is structured as follows. The second part is the materials and methods. The third part introduces the spatial analysis of LUC along the Ethiopian section of the ADR. The fourth part analyzes the influencing factors. The fifth part presents the conclusions and a discussion of the results.

2 Materials and methods

2.1 Study area

The Ethiopian section of the ADR is 690.7 km long with 17 stations, traversing the capital city of Addis Ababa, the Oromia Region, Afar Region, Somali Region, and the Dire Dawa City, passing through regions with vast differences in social and economic development. This railway links the major cities of Ethiopia (Addis Ababa, Adama, and Dire Dawa) and runs through the Awash Valley, which is the most important agricultural area of Ethiopia. The area along the railway is characterized by complex and diverse landforms, including plateaus, valleys, plains, deserts, and semi-deserts. It has narrowed the spatial and temporal distances between cities in Ethiopia along the line, accelerated the flow of various development elements (i.e., economic activities, infrastructure, social services, human resources, investments, and other factors that contribute to the overall development and advancement of a region), and promoted the integrated development of the region along the line.
Schutz (1998) described the development areas that might benefit from railways, especially high-speed railways. He divided the area around a railway station into primary, secondary, and tertiary development zones based on their accessibility to and from the station. The primary development zone was within 5-10 minutes travel time on foot or by seamless transport where the population and enterprises can make full use of the spatiotemporal advantages of the railway. The secondary development zone was within 15 minutes travel time by complementary transport where the population and enterprises still experience the significant advantages of the railway. The tertiary development zone was beyond 15 minutes travel time and further complementary transport was necessary to access the railway (Bharule et al., 2019). In this study, we argue that the railway is potentially important driver of LUC in the areas along the railway line. According to the actual development situation in the regions along the ADR, we selected a study area within the tertiary development zone along the Ethiopian section of the ADR (i.e., a 15 minutes drive was required to access a station). This corresponded to the 10 km buffer zone shown in Figure 1, which was considered likely to still be within the influence of the ADR.
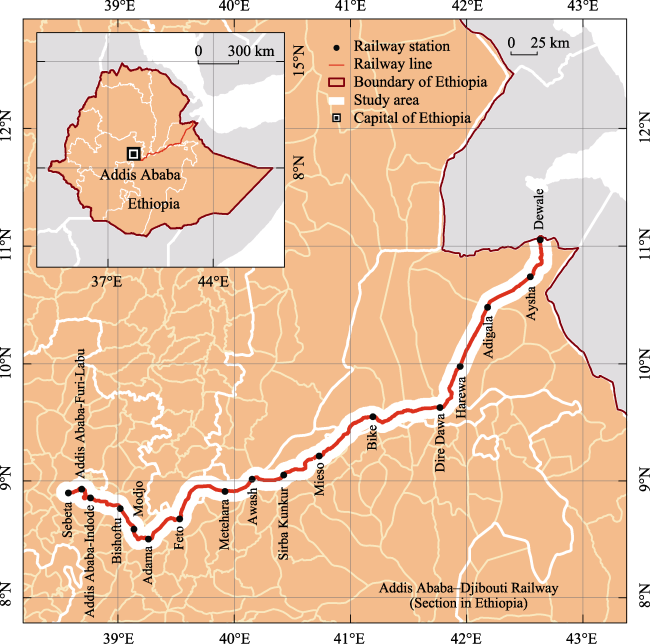
Figure 1 Location of the study area (Ethiopian section of the Addis Ababa-Djibouti Railway)

2.2 Data sources

The data used in this study was mainly raster and vector data. The raster data was land use data based on a manual visual interpretation. The vector data included the administrative zoning data from the region, zone to woreda as well as the coordinates of the ADR and its stations.
The original images used for the land use data classification were taken from the Landsat Operational Land Imager/Thermal Infrared Sensor (OLI/TIRS) data section of the U.S. Geological Survey (USGS) with a resolution of 30 m. Landsat series data has the advantages of multiple bands, a relatively high resolution, and is a small data set, which can classify images well. The classification of LUC in this study was completed by visual interpretation, which is a land use classification method based on remote sensing images, combined with a map annotation and manual identification by professionals. The precision of the results obtained by this method was higher than that of open-source land categorization products.
Considering the data accessibility and the development stage of the ADR, we selected 2013, 2017, and 2021 for investigation. This interval of four years allowed us to examine the different stages of railway development, including construction, completion, and operation. Images from May to June for each year were taken to accurately distinguish between farmland and forest. The data sources used for this investigation are shown in Figure 2 and the details are provided in Table 1.
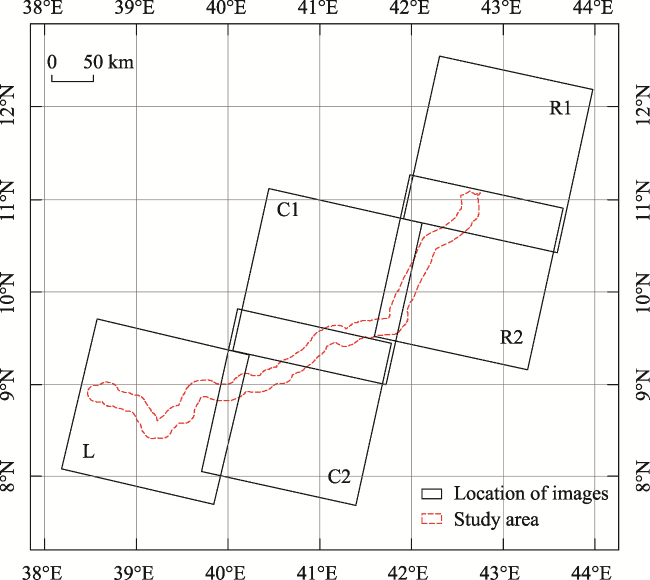
Figure 2 The distribution and index of the Landsat remote sensing images
Table 1 The date and filename of Landsat remote sensing images
2013 2017 2021
Date L 2013.06.08 2017.06.03 2021.05.29
C1 2013.05.16 2017.06.12 2021.06.07
C2 2013.05.16 2017.06.12 2021.06.07
R1 2013.06.10 2017.06.05 2021.05.31
R2 2013.06.10 2017.06.05 2021.05.31
Filename L LC08_L2SP_168054_2013
0608_20200912_02_T1
LC08_L2SP_168054_2017
0603_20200903_02_T1
LC08_L2SP_168054_2021
0529_20210608_02_T1
C1 LC08_L2SP_167053_2013
0516_20200913_02_T1
LC08_L2SP_167053_2017
0612_20200903_02_T1
LC08_L2SP_167053_2021
0607_20210615_02_T1
C2 LC08_L2SP_167054_2013
0516_20200912_02_T1
LC08_L2SP_167054_2017
0612_20200903_02_T1
LC08_L2SP_167054_2021
0607_20210615_02_T1
R1 LC08_L2SP_166052_2013
0610_20200912_02_T1
LC08_L2SP_166052_2017
0605_20200903_02_T1
LC08_L2SP_166052_2021
0531_20210608_02_T1
R2 LC08_L2SP_166053_2013
0610_20200912_02_T1
LC08_L2SP_166053_2017
0605_20200903_02_T1
LC08_L2SP_166053_2021
0531_20210608_02_T1
The land use classification for the three years was obtained, as shown in Figure 3. In accordance with standard land use classification criteria and considering the specific conditions of the study area, the land use was divided into six types: built-up land, farmland, grassland, forest, water body, and other land. Built-up land mainly included urban and rural built-up spaces, such as buildings, infrastructure, and industrial land. Farmland was mainly land where crops were grown, with scattered trees. Grassland was mainly land dominated by herbs and shrubs that was suitable for animal husbandry. Forest was mainly land where bamboo and trees were growing, and included natural, secondary, and artificial forests. Water body mainly included rivers, lakes, reservoirs, pits, and land for water conservation facilities. Other land category mainly included sandy land and bare land.
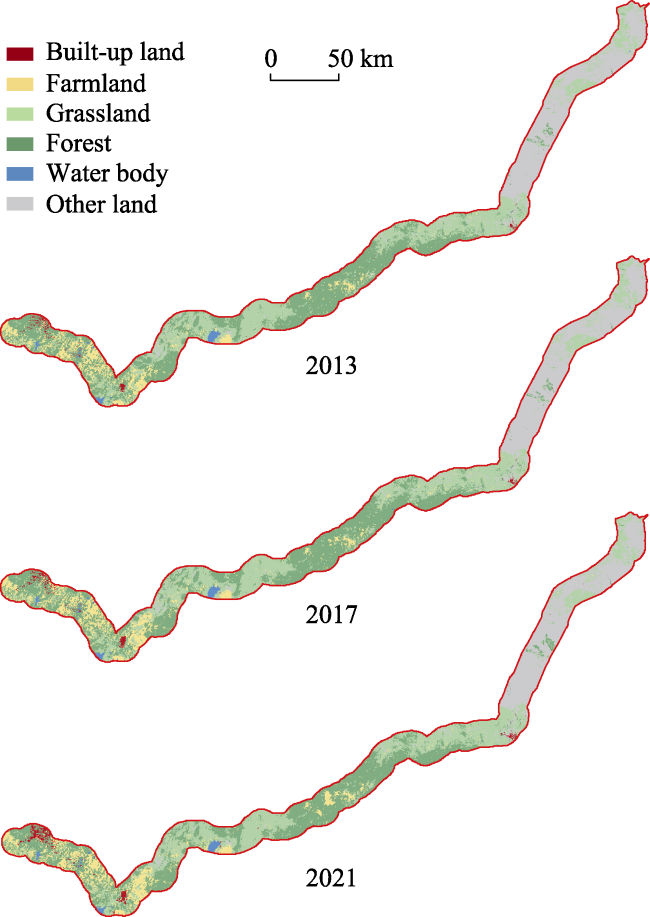
Figure 3 Distribution of land use classification in the study area in different time periods
The administrative divisions of Ethiopia and the position of the ADR were obtained from the Open Street Map (OSM). The coordinates of stations were obtained from Wikipedia because the data provided by OSM was not complete. ArcGIS 10.8 vectorized the final version of the station data. The vector data for the study area consisted of a 10 km buffer zone created along the entire ADR that was specifically tailored to align with Ethiopia’s administrative boundary (Figure 3). To accurately analyze the spatial differentiation of dynamic LUC in the 10 km buffer zone, a multi-ring buffer zone was established with intervals of 2 km for the entire railway line with reference to the common methods used in LUC research along the trans-regional linear infrastructure, i.e., railways and expressways. To overcome the challenge of expressing the five 2 km buffer zones along the railway line clearly at the scale of the ADR, a local amplification approach was adopted with Addis Ababa, as the city with the departure station, at the center. This approach provided a clear visualization of the spatial distribution of the 2, 4, 6, 8, and 10 km buffer zones around Addis Ababa, as well as the land use patterns in different time periods (Figure 4).
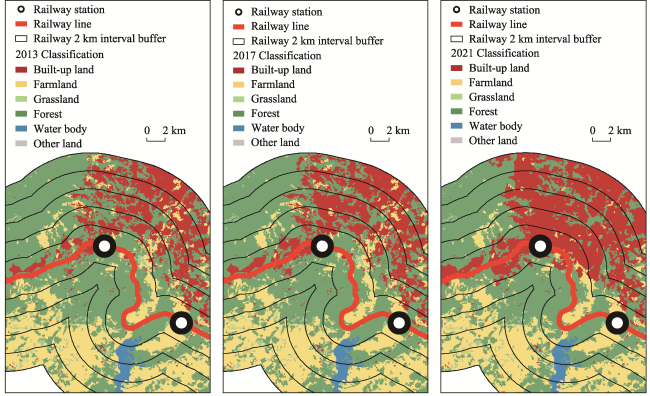
Figure 4 An enlarged map of the five buffer zones at 2 km intervals and the spatial distribution of land use along the railway line with Addis Ababa at the center in different time periods

2.3 Methods

2.3.1 Analysis of the changes in land use structure

The comparison of land use ratios at different periods is a common method for analyzing the changes in land use structure. A land use transfer matrix is widely used to reflect the number, proportion, and relationships of land use conversions between different land use types (Padonou et al., 2017), and information entropy is used to reflect the complexity and diversity of land use structure (Zhang et al., 2018).
(1) Land use transfer matrix
The land use transfer matrix can reflect the land use conversions that occur in different periods. Its expression is (Wu et al., 2015):
${{S}_{ij}}=\left[ \begin{matrix} {{S}_{11}} & {{S}_{12}} & \ldots & {{S}_{1n}} \\ {{S}_{21}} & {{S}_{22}} & \ldots & {{S}_{2n}} \\ \ldots & \ldots & \ldots & \ldots \\ {{S}_{n1}} & {{S}_{n2}} & \ldots & {{S}_{nn}} \\ \end{matrix} \right]$
where S is the area of land use; n is the total number of land use types; and Sij is the area of land transferred from Class i to Class j.
(2) Information entropy (IE) and equilibrium degree (ED)
The IE can directly reflect the degree of land use balance in a study area. The higher the IE value, the more land use types are present, the smaller the differences in area between different types of land, and the more balanced the land use structure. The IE is calculated as follows (Zhong et al., 2016):
$IE=-\underset{i=1}{\overset{n}{\mathop \sum }}\,\left( {{W}_{i}}\times \log {{W}_{i}} \right)$
where Wi is the area proportion of land use type i in the study area.
There may be differences in land use types at different developmental stages in a study area. To compensate for the lack of comparability of IE, the ED was proposed to reflect the differences in regional land use homogeneity (Zhang et al., 2018). The ED was calculated as follows (Chen et al., 2001):
$ED=\frac{H}{\log \left( n \right)}$
where H is the IE of land use structure in the study area and n is the number of land use types. The ED value is between 0 and 1, and the larger the value, the stronger the land use homogeneity.

2.3.2 The land use dynamic degree (LDD)

The LDD is often used to reflect the degree of change in the area of a particular type of land in different periods (Li et al., 2021), including the LDDs for a single land use type and comprehensive land use types.
(1) The LDD of a single land use type
The LDD of a single land use type was used to describe the change of a specific type of land in the study area within a particular period, and was calculated as follows (Li et al., 2017):
${{S}_{i}}=\frac{{{U}_{i,b}}-{{U}_{i,a}}}{{{U}_{i,a}}}\times \frac{1}{T}\times 100%$
where Si represents the LDD of a single land use type; Ui,a and Ui,b represent the area of a specific type of land at the beginning and end of the study, respectively; and T represents the time period (years).
(2) The LDD of comprehensive land use types
The LDD of comprehensive land use types was used to describe the overall change of various land use in the study area within a particular period, and was calculated as follows (Li et al., 2021):
$LC=\frac{\mathop{\sum }_{i=1}^{n}{{V}_{i}}}{\mathop{\sum }_{i=1}^{n}{{U}_{i}}}\times \frac{1}{T}\times 100%$
where LC represents the LDD of comprehensive land use types in the study area, Ui represents the area of land use type i at the initial stage of the study; Vi represents the area of land use type i that was transformed into other types of land use within the research period; and T represents the period (years).

2.3.3 The landscape fragmentation index (LFI)

The LFI is widely used to indicate the degree of fragmentation due to landscape segmentation and reflects the complexity of landscape spatial structure (Jaeger, 2000; De Montis et al., 2017). To some extent, LFI can reflect the impact of human interference on the landscape. Human activities, such as railway construction and urban development, transform the natural landscape from a single, homogeneous and continuous whole to a complex, heterogeneous, and discontinuous patch mosaic, such as the fragmentation of forests, grassland, and other ecosystems. This will have a specific impact on flora and fauna along the railway. The LFI was calculated as follows:
Li=Ni /Ai
where Li is the LFI of landscape i; Ni is the number of patches in landscape i; and Ai is the total area of landscape i. The larger the value of Li, the greater the degree of landscape fragmentation.

3 Results

3.1 Spatiotemporal changes of land use

The spatiotemporal changes of land use in the 10 km buffer zone on both sides of the Ethiopian section of the ADR were analyzed in terms of both quantity and spatial distribution.

3.1.1 Changes in land use structure

Along the railway, farmland, forest, grassland, and other land (including sandy land and bare land) were the primary land use, accounting for more than 95% of the study area at each of the three time points. From 2013 to 2021, the area of built-up land and farmland continued to increase, the area of forest, grassland and other land continued to decrease, and the variation in the area of water body was minimal (Table 2). Using the absolute value of the change range to represent the intensity of LUC (Table 3), we found that the change ranges of built-up land, farmland, and forest were relatively large during the railway construction period (2013-2017), but the change ranges of built-up land and farmland were larger during the railway operating period (2017-2021). From 2013 to 2021, built-up land was the land use type that increased the most, with the change rate displaying an increasing trend.
Table 2 Proportion of land use types in different time periods
Land use type 2013 2017 2021
Area (km2) Percentage (%) Area (km2) Percentage (%) Area (km2) Percentage (%)
Built-up land 254.05 1.91 293.61 2.21 375.02 2.82
Farmland 1980.16 14.91 2160.50 16.27 2250.52 16.94
Forest 4857.70 36.57 4678.44 35.22 4592.27 34.57
Grassland 3679.61 27.70 3639.53 27.40 3581.19 26.96
Other land 2428.08 18.28 2427.51 18.28 2400.60 18.07
Water body 83.21 0.63 83.22 0.63 83.22 0.63
Total 13282.82 100 13282.82 100 13282.82 100
Table 3 Range of land use change in different time periods
2013-2017 2017-2021 2013-2021
Built-up land 15.57% 27.73% 47.61%
Farmland 9.11% 4.17% 13.65%
Forest -3.69% -1.84% -5.46%
Grassland -1.09% -1.60% -2.67%
Other land -0.02% -1.11% -1.13%
Water body 0.01% 0.00% 0.01%

3.1.2 The land use dynamic degree and equilibrium degree of land use change

The LDDs of single and comprehensive land use types were calculated according to Equations (4) and (5) to determine the degree of LUC, as shown in Figure 5 and Table 4. In 2013-2017 and 2017-2021, the LDDs of forest, grassland, and other land were negative, indicating that their areas were continuously decreasing, while the LDDs of built-up land and farmland were positive, indicating that their areas were continuously increasing. The area of built-up land changed the most with a slow growth from 2013 to 2017 and a rapid growth from 2017 to 2021, indicating that the construction of urban built-up area in the study area was more obvious during the ADR operating period. The LDDs of comprehensive land use types in the two periods were 0.45% and 0.42% respectively, relatively low during the two periods, indicating that the speed of development in the regions along the railway decreased slightly over time and there were no substantial dynamic changes of all land use types overall.
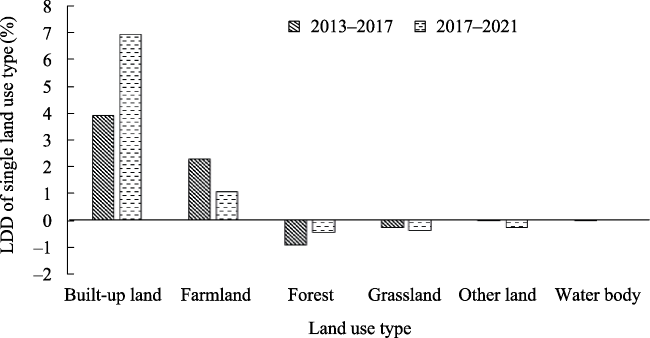
Figure 5 Land use dynamic degree (LDD) of single land use type in different periods
Table 4 Land use dynamic degree (LDD) of comprehensive land use type in different periods
Period 2013-2017 2017-2021
LDD of comprehensive land use types (%) 0.45 0.42
The IE and ED of land use were calculated using Equations (2) and (3) to study the ED of land use along the railway, with the results shown in Figure 6. The IE and ED of land use at the three time points increased slightly, indicating that the differences in the area of different land use types gradually decreased. The homogeneity of land use structure gradually increased, although the change was relatively small.
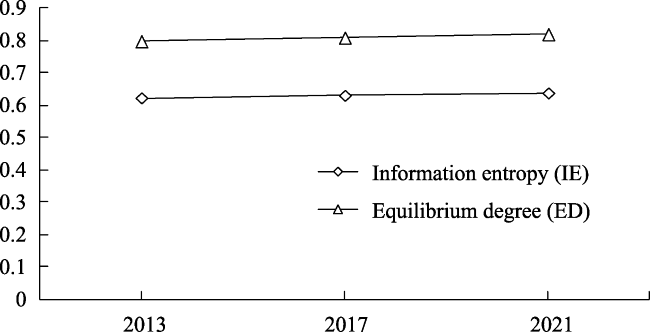
Figure 6 Information entropy (IE) and equilibrium degree (ED) of land use in different years

3.1.3 Direction of land use transfer

We used the land use transfer matrix to analyze the changes in area and conversions of various land uses along the ADR at different periods (Table 5). During the construction and operating period, forest, farmland and grassland were the main land use types transferred to built-up land, while forest and grassland were the main land use types transferred to farmland. Other conversions also occurred but on a relatively small scale.
Table 5 Land use transfer matrix in different periods
The conversion during the whole period from 2013 to 2021 is shown in Table 5(c). The area of built-up land increased by 120.97 km2, mainly due to transfers from forest, farmland and grassland. The newly added built-up land was mainly located around Furi-Labu, Indode, and Dire Dawa stations. Railway construction needs a large amount of land for supporting facilities, such as stations, but the expansion of human settlements around stations and along the railway occupied other types of land. The area of farmland increased by 270.35 km2, mainly from forest and grassland. The newly added farmland was mainly distributed around Sirba Kunkur and Mieso stations. This was mainly due to land reclamation by agricultural development in the Awash Valley region. The forest decreased by 265.43 km2, mainly due to conversion into farmland and built-up land, followed by grassland. Most of the converted forest was located between Sirba Kunkur and Mieso stations, and the southeastern suburb of Addis Ababa. In addition to railway construction and urban expansion, agricultural development was also responsible for a decrease in forest area.
The area of grassland decreased by 98.43 km2, mainly due to conversion into farmland and built-up land. The grassland that was converted to farmland was mainly distributed in the west of Adama and the northwest of Metehara. The grassland that was converted to built-up land was mainly distributed west of Dire Dawa core city. Similarly to forests, the decrease in grassland was not only caused by railway construction and urban expansion, but also by agricultural development. The area of water body increased by 0.01 km2, mainly due to conversion into farmland. The newly added water bodies were mainly located south of Adama, due to the development of irrigated agriculture in the region. The area of other land decreased by 27.47 km2, mainly due to conversion into forest and some built-up land. The area where most of the other land was converted to other land use types was mainly distributed around Harewa station. The increase in the water volume in the basin near Harewa may have driven the transformation of sandy land and bare land to forest in the valley area.

3.2 The relationship between land use change and distance from the railway

To analyze the LUC of regions with different distances from the railway, the 10 km buffer zone along the ADR was divided into five buffer zones at 2 km intervals.

3.2.1 The degree of land use change in different buffer zones

The LDDs of single and comprehensive land use types were calculated by Equations (4) and (5) to analyze the degree of change in the area of different land uses in the buffer zones at different distances from the ADR. The results are shown in Figure 7.
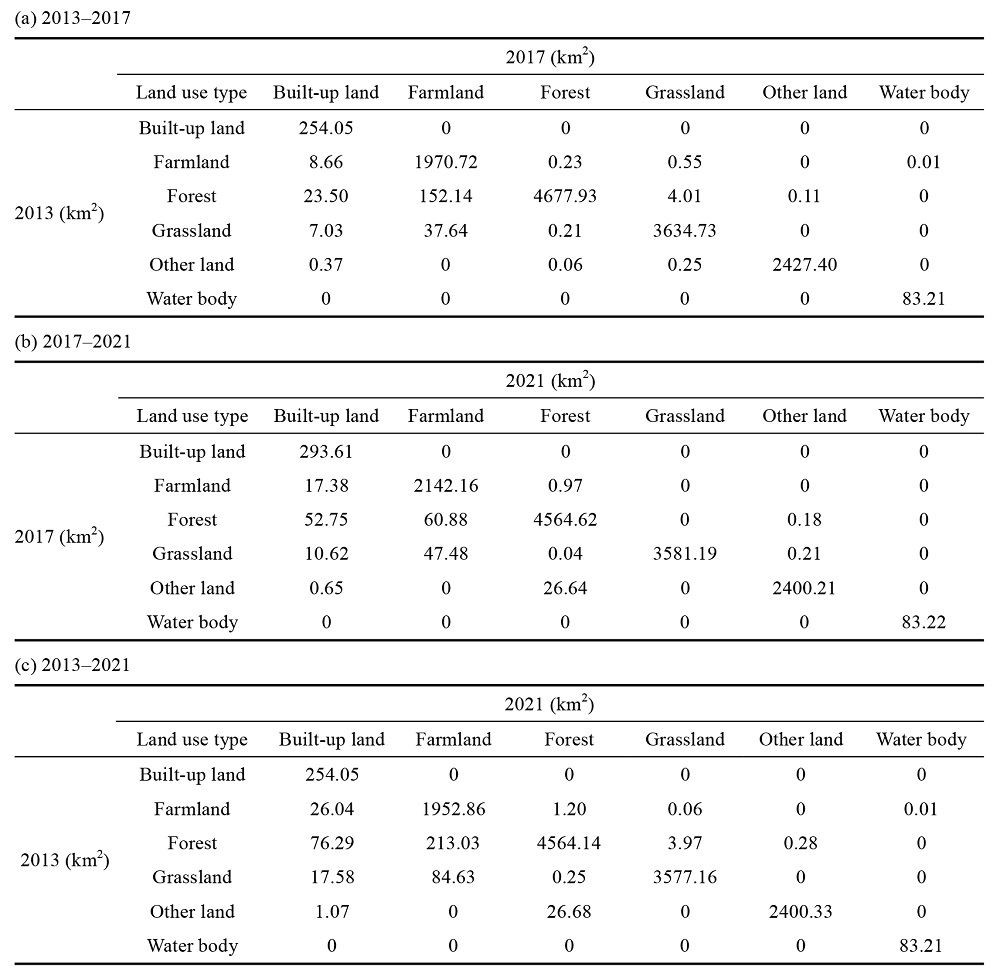
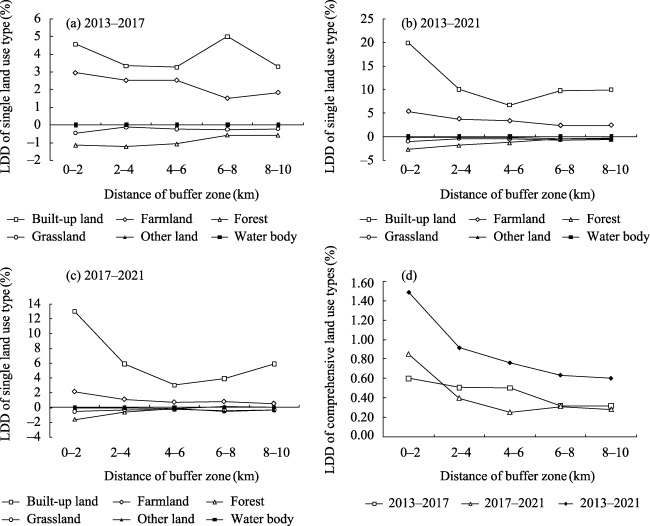
Figure 7 Relationship between land use dynamic degrees of land use change and buffer distance in each period
In 2013-2017, 2017-2021 and 2013-2021, the areas of built-up land and farmland in each buffer zone increased. The degree of change in the area of built-up land first decreased and then fluctuated or gradually increased with increasing distance. The degree of change in the area of farmland gradually decreased with increasing distance. The areas of forest and grassland in each buffer zone decreased. The degree of change in the area of forest decreased with increasing distance, while the degree of change in the area of grassland fluctuated. The area of other land did not change significantly from 2013 to 2017, but gradually increased with increasing distance from 2017 to 2021. For water body, there was almost no noticeable change with increasing distance. Overall, the degree of change in the area of built-up land, farmland and forest displayed a certain regularity with increasing buffer distance, reflecting the variation in the gradient of land use along the railway. The closer the built-up land was to the railway within a certain distance, the greater the degree of change in its area; while the closer the farmland and forest were to the railway, the greater the degree of change in their areas. The LDD of built-up land in 2013-2017 and 2017-2021 changed significantly within the 6 km buffer zone and presented a different trend beyond 6 km, indicating that 6 km may be the threshold distance for the noticeable impact of the railway on the area change of built-up land in the surrounding region.
In 2013-2017, 2017-2021 and 2013-2021, the LDDs of comprehensive land use types in each buffer zone showed the effect of distance on LUC. The closer the buffer zone was to the railway, the higher the LDD of comprehensive land use types, the stronger the land development, and the more significant the proportional areas of built-up land and farmland. Additionally, except for the 0-2 km buffer zone, the LDDs of comprehensive land use types in the other buffer zones decreased during the operating period. The decreasing trend of the LDD of comprehensive land use types with increasing distance was more significant in the operating period. This may be because during the construction period, the large-scale of engineering and construction work, large number of employees, and the need for support services had a broad influence on land use. In contrast, at the early stage of railway operation, the driving effect of traffic distribution and regional development was relatively limited and its influence extended over a smaller range along the ADR.

3.2.2 Comprehensive degree of land use in different buffer zones

To investigate the degree of land use balance in different buffer zones, the IE and ED of land use in each buffer zone were calculated by Equations (2) and (3), with the results shown in Figure 8. From 2013 to 2021, the IE and ED of land use increased in all buffer zones, indicating that the balance of the land use structure in each buffer zone gradually increased and the differences between the areas of different types of land use gradually decreased over time. In 2013 and 2017, the IE and ED of each buffer zone initially increased (within 0-4 km) and then decreased (4-10 km) with increasing distance. The balance of land use structure was strongest in the 2-4 km buffer zone. In 2021, the IE and ED decreased gradually with increasing distance, and the balance of the land use structure was strongest in the 0-2 km buffer zone.
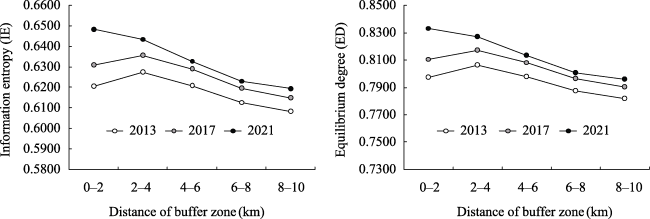
Figure 8 Information entropy and equilibrium degree of land use in each buffer zone in different periods
This pattern could be explained by the fact that with increasing distance from the center, the proportion of living environment space (e.g., built-up land and farmland) decreased, while the ratio of natural environment space (e.g., forest, grassland, other land, and water body) increased. This led to the further expansion of forest, which already accounted for a relatively high proportion of the land, and a decrease in the balance of land use structure. With the operation of the railway, there was an increase in development adjacent to the railway. The proportion of built-up land continually increased over time, with the balance of the land use structure being highest in the 0-2 km buffer zone. This also shows that in the early stage of operation, the driving effect of ADR on urban development was mainly concentrated in a small area on both sides of the railway.

3.3 Regional differences in land use change

To determine the regional differences in LUCs along the railway, the land use structure and LDD of the area around each station were analyzed.

3.3.1 Land use structure around different stations

To compare the land use structure around different stations along the Ethiopian section of the ADR, we established buffer zones with a radius of 10 km around the stations based on the land use data in 2021. Among the 17 stations along the railway, more than half had only a small proportion of built-up land in the surrounding area (Figure 9). The interaction between these stations and the adjacent area was therefore limited, making it difficult for them to obtain the expected operating income through passenger and freight transportation and achieve sustainable development.
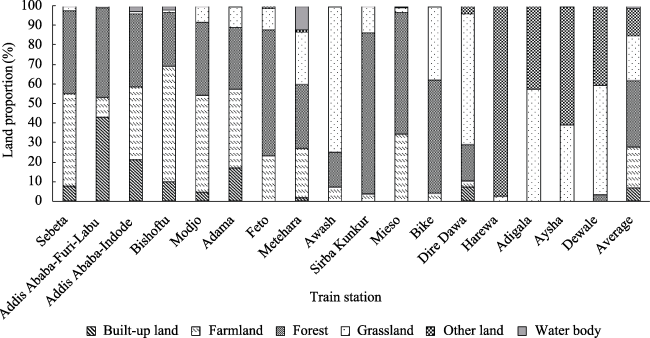
Figure 9 Land use structure of the buffer zones with a radius of 10 km around the stations along the Ethiopian section of the Addis Ababa-Djibouti Railway in 2021
There was a relatively high proportion of built-up land within the 10 km buffer zones of stations in the Addis Ababa Metropolitan Area, Adama, and Dire Dawa; however, it was still much lower than the average around most other stations. From Addis Ababa to Dire Dawa, there was a high proportion of farmland around most stations. East of Dire Dawa, there was a high proportion of grassland and other land and a low percentage of built-up land and farmland. In general, the areas around the stations outside Addis Ababa, Adama, and Dire Dawa were still dominated by agriculture with little urbanization and industrial development.

3.3.2 Changes in the area of built-up land around different stations

To further explore the regional differences in LUCs around the stations, we calculated the LDD of built-up land within the buffer zones around each station from 2013 to 2021. Additionally, we created a Boston Matrix using the proportion of built-up land in the buffer zones of each station in 2021 (Figure 10). Based on the average proportion of land use types and LDD values, the 17 stations could be divided into four types: high proportion-high change, high proportion-low change, low proportion-high change, and low proportion-low change. There were five high-high stations, including the three stations in Addis Ababa Metropolitan Area (Sebeta, Furi-Labu, Indode), and Adama and Dire Dawa. There was only one high-low station (Bishoftu) and one low-high station (Metehara). The remaining nine stations were classed as low-low: Feto, Awash, Sirba Kunkur, Mieso, Bike, Harewa, Adigala, Aysha, and Dewale.
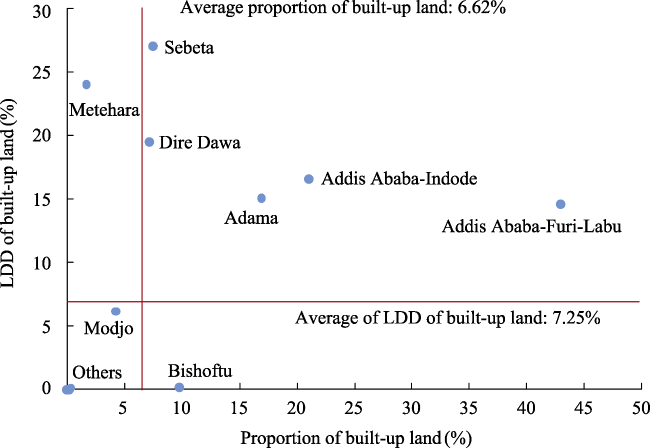
Figure 10 Proportion of built-up land in 2021 and land use dynamic degree (LDD) of built-up land from 2013 to 2021 of the buffer zones with a radius of 10 km around the stations along the Ethiopian section of the Addis Ababa-Djibouti Railway

Note: “Others” includes Feto, Awash, Sirba Kunkur, Mieso, Bike, Harewa, Adigala, Aysha, and Dewale.

More than half of the stations were therefore classed as low-low in terms of changes in the area of built-up land, most of which were very low. These stations were typically located in small and medium-sized towns, with the railway’s impact on changes in built-up land being minimal. High-high stations were all located in the regional central cities with urban development surrounding them, and the extent of built-up land significantly increased over time since the construction of the ADR. This indicates that the major changes in built-up land along the ADR were mainly concentrated in the capital and important regional central cities. In contrast, the changes in other regions were relatively small.

3.4 The landscape pattern of land use

It is generally believed that the linear cutting of traffic routes through the land cover will lead to landscape fragmentation along the routes. The most direct manifestation of landscape fragmentation in land use is the process of fragmentation and dispersion of land patches that were initially distributed as a whole. To investigate the disturbance to the natural landscape by the construction and operation of the ADR, we used ArcGIS to quantify the area and number of landscape patches for different land use types in 2013, 2017 and 2021 (Figure 11), and the LFI of the whole buffer zone along the ADR was calculated by Equation (6) (Figure 12).
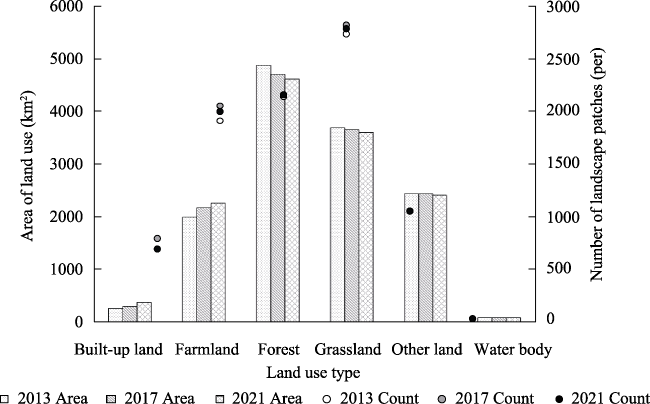
Figure 11 Change in land area and number of landscape patches in the Ethiopian section of the Addis Ababa-Djibouti Railway
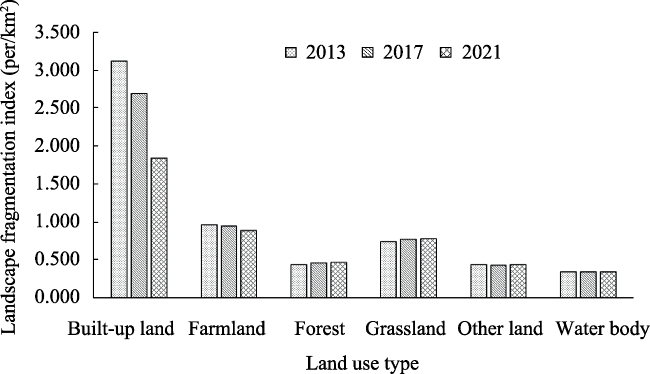
Figure 12 Landscape fragmentation index of different land use types in the Ethiopian section of the Addis Ababa-Djibouti Railway
The LFI of built-up land declined as the area of built-up land increased, reflecting a stable state with continuous urban development. The LFI of farmland continued to decline. The area of farmland continually increased and the number of patches initially increased and then decreased, reflecting the process of farmland being developed and integrated along the railway. The LFI of forest and grassland continued to increase, while the area decreased and the number of patches initially increased and then decreased, reflecting the increasing disturbance to natural vegetation caused by human activities, such as agriculture and urban development. The LFI of other land and water body did not change significantly, indicating that the disturbance by human activities was within the normal range.
The construction and operation of the ADR and other development activities have changed the original stable landscape pattern along the railway. In some areas, the land use pattern that was dominated by grassland and forest was disrupted. Other types of land use then increased and the landscape pattern along the railway was diversified. The construction and operation of the ADR are direct factors affecting landscape change. The regional migration and land development caused by the railway have further promoted the recombination of land uses along the railway, finally leading to a substantial change in landscape patterns in some areas.

4 Factors influencing land use change

The most significant LUC phenomenon observed along the Ethiopian section of the ADR was the expansion of built-up land, which was also the main manifestation of human activities at the spatial level. It is generally believed that the expansion of built-up land is affected by many factors, such as the natural environment and social economy. We conducted a regression analysis to further explore the correlation between different influencing factors and the expansion of built-up land in the study area.

4.1 Research unit and variable selection

It was found that the significant areas of LUC along the Ethiopian section of the ADR were mainly concentrated around the railway stations, with little changes in land use types in the areas away from the stations. Therefore, we focused on the areas within a radius of 10 km around railway stations and used a 3 km × 3 km grid as the spatial unit to calculate the expansion of built-up land around railway stations and to determine the influencing factors. The influencing factors were selected from three dimensions: railway, natural environment, and social economic factors. Considering the comprehensiveness of the index and the availability of data, we selected eight influencing factors as explanatory variables, as shown in Table 6.
Table 6 The influencing factors of built-up land expansion in the area around stations
Variable type Variable category Variable Data source
Dependent variable Built-up land expansion The proportion of built-up land
in the space unit
Land use data
Explanatory variable Railway factor Distance from the train station Railway station geolocation by Open Street Map
Distance from railway line Railway line shapefile by Open Street Map
Whether nearby station provides passenger service Operation strategy of ADR from the ADR Operation and Maintenance Project Company
Whether nearby station provides freight service
Natural environmental factor Slope DEM
Vegetation coverage Landsat-OLI
Social economic factor Population size LandScan
Distance from the central city Central city geolocation

Note: We identified several typical central cities in Ethiopia along the ADR by the size of urban space and population, including Addis Ababa, Bishoftu, Adama and Dire Dawa.

4.2 Construction of a model for analysis

A multiple linear regression model (MLR) and geographical weighted regression model (GWR) were applied for a quantitative analysis of the influencing factors. The MLR was used to determine the influencing factors and their effects on the changes of built-up land along the railway at the overall level, while the latter analyzed the spatial heterogeneity of the effect of factors on the change of built-up land by introducing geospatial characteristics. To ensure a significant amplitude of change of built-up land in the study area, we selected the data from the initial and final years (2013 and 2021) for a regression analysis, and compared the influence coefficient and significance of the statistical results to determine the effect of each factor on the expansion of built-up land.
(1) The MLR model
The MLR model used in this study was the ordinary least squares (OLS), which was calculated as follows:
$\begin{matrix} Y={{\alpha }_{i}}{{X}_{i}}+{{\alpha }_{0}}+\varepsilon ~ \\\end{matrix}$
where Y is the proportion of built-up land, Xi is the index of influential factor i, αi is the influence coefficient corresponding to Xi, α0 is the constant term of the regression model, and ε is the residual term. If αi > 0, the larger the value, the stronger the positive influence of Xi on the expansion of built-up land. If αi <0, the smaller the value, the stronger the negative influence of Xi on the expansion of built-up land. If αi approaches 0, Xi has no significant effect on the expansion of built-up land.
(2) The GWR model
Based on the MLR, the GWR model was used to assess the presence of spatial heterogeneity in the impacts of the influencing factors, so as to identify the effects of these factors on the expansion of built-up land around different stations more accurately. The GWR was calculated as follows:
$\begin{matrix} {{Y}_{i}}=~\underset{k=1}{\overset{p}{\mathop \sum }}\,{{\beta }_{ki}}\left( {{u}_{i}},{{v}_{i}} \right){{X}_{ki}}+{{\beta }_{0}}\left( {{u}_{i}},{{v}_{i}} \right)+{{\varepsilon }_{i}},\ \ \ \ k\in \left[ 1,\ p \right],\ i\in \left[ 1,\ n \right] \\ \end{matrix}$
where i represents the space unit i; ui and vi represent the X and Y coordinates of space unit i, respectively; and Xki is the factor index corresponding to explanatory variable k on space unit i. Therefore, βki represents the influence coefficient obtained by the regression estimation of explanatory variable k on space unit i;
β0 is the constant term of the regression model; and εi is the residual term. The spatial weight matrix represented by β is as follows:
$\begin{matrix} \hat{\beta }\left( {{u}_{i}},{{v}_{i}} \right)={{\left( {{X}^{T}}{{W}_{i}}X \right)}^{-1}}{{X}^{T}}{{W}_{i}}Y \\ \end{matrix}$
where Wi represents the space weight around space unit i, which is the weight matrix obtained based on the different function algorithms, and the function selected in the weight matrix will directly affect the estimation result obtained from formula (8). Following the experiments, the Adaptive Gaussian weight function was adopted as the weighting scheme.

4.3 Regression analysis results

(1) Regression results
The regression results are shown in Table 7, in which the fitting coefficient (R2) of the GWR was generally higher than that of the OLS, indicating that the effects of some factors had significant spatial heterogeneity. The fitting degree of the regression results in 2021 was generally higher than that in 2013, indicating that with the construction and operation of the ADR, the expansion of built-up land surrounding the stations was closely related to the influencing factors.
Table 7 Fitting degree comparison between OLS Model and GWR Model in 2013 and 2021
2013 2021
OLS GWR OLS GWR
-2 log-likelihood -1207.75 -1496.56 -1139.96 -1361.77
Classic AIC -1187.75 -1410.23 -1119.96 -1279.05
AICc -1187.35 -1402.87 -1119.56 -1272.30
BIC/MDL -1144.44 -1223.28 -1076.64 -1099.90
CV 0.0073 14384.42 0.0081 141.19
R2 0.5681 0.7417 0.7490 0.8309
Adjusted R2 0.5611 0.7207 0.7449 0.8177
(2) Regression result of OLS
The OLS results are shown in Table 8. The distance from the train station, whether the nearby station provides a passenger service, whether the nearby station provides a freight service, the population size, and the distance from the central city had the most significant impacts on the expansion of built-up land surrounding the ADR stations. In contrast, the influence coefficient of slope and vegetation coverage failed the significance test, indicating that natural environmental factors had little influence on the expansion of built-up land. In addition, the distance from the railway line did not pass the significance test, which further proved that the expansion of built-up land was mainly related to the presence of the railway stations, and had little relationship with the railway line.
Table 8 Estimation results of influencing factors of built-up land expansion based on OLS
2013 2021 2013 2021
Distance from the train station -0.0737** -0.0487* Vegetation coverage -0.0586** -0.0056
(0.0444) (0.0821) (0.0421) (0.7959)
Distance from railway line 0.0082 -0.0238 Population size 0.6386*** 0.7895***
(0.8198) (0.3843) (0.0000) (0.0000)
Whether nearby station provides passenger service 0.1653*** 0.0831*** Distance from the central city -0.2083*** -0.1314***
(0.0000) (0.0020) (0.0000) (0.0000)
Whether nearby station provides freight service -0.1587*** -0.0641** Constant 0.0000 -0.0000
(0.0000) (0.0170) (1.0000) (1.0000)
Slope 0.0140 0.0309
(0.6293) (0.1627)

Note: The coefficient in brackets represents the standard deviation of the influencing factor, with * representing p < 0.10, ** representing p < 0.05, and *** representing p < 0.01.

Among the factors with a significant influence, the shorter the distance from the railway station and the central city, and the larger the population size when the nearby station provided a passenger service, the greater the probability of the expansion of built-up land around the station. The factor of whether a nearby station provided a freight service had a negative correlation with the expansion of built-up land, and the probability of the expansion of built-up land was relatively low around the freight station.
Comparing the influence coefficients of 2013 and 2021, it was found that the influence coefficients of railway factors gradually approached 0 over time, while the influence coefficients of social and economic development factors, such as population size and distance from the central city, were stable at a high level or increased. This shows that social economic factors gradually replaced railway factors as the main driving force for the expansion of built-up land around the stations over time.
(3) The GWR results
The GWR model used the same influencing factors as the OLS model. Based on the OLS analysis, we extracted factors with a significant influence for a visual analysis. The regression coefficient of the GWR model was different in different areas, reflecting the difference in the effect strength of different factors in different areas.
(i) The spatial differentiation of the impact of distance from the train station on the expansion of built-up land in the surrounding areas
There were differences in the correlations between the distance from the station and the expansion of built-up land in the areas surrounding the different stations along the Ethiopian section of ADR (Figure 13). To the west of Feto Station, the negative correlation decreased over time, i.e., the farther away from the station, the less significant the expansion of built-up land. There were no significant correlations in the areas around Bishoftu, Modjo, and Adama stations, and in the areas around the three stations in the Addis Ababa Metropolitan Area. To the east of Feto station and in the area around Dire Dawa station there was a positive correlation that increased over time, i.e., the farther away from the station, the more significant the expansion of built-up land, while the correlation was not significant in the area around other stations.
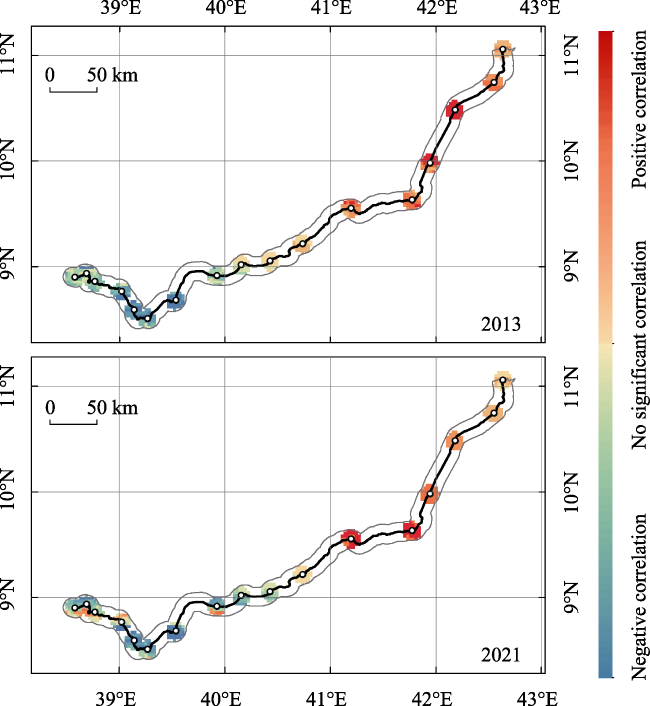
Figure 13 Spatial distribution of the distance from the train station in the GWR Model
To the west of Feto station, Bishoftu, Modjo and Adama stations were spatially connected to the built-up areas of the cities where they were located, and the built-up areas of the cities were within a 10 km radius of the stations. Therefore, the farther away from the station, and the closer to the edge of the built-up areas of the cities, the lower the intensity of the expansion of built-up land. In Addis Ababa Metropolitan Area, the development of the area around the three stations was influenced not only by the presence of the stations but also by the metropolitan city center. Under the combined influence of both factors, there appears to be no discernible correlation between the expansion of built-up land surrounding the Sebeta, Furi-Labu, and Indode stations and their respective distances.
In Dire Dawa, east of Feto, the station was on the edge of the city, 9.5 km from the city center. The 10 km radius around Dire Dawa station just covered the area from the city edge to the city center. On the side away from the city center, there were no large areas of built-up land. On the side facing the city center, the farther away from the station (i.e., the closer to the city center), the more significant the expansion of built-up land.
(ii) The spatial differentiation of the impact of population size on the expansion of built-up land in the surrounding areas
There was a relatively significant positive correlation between population size and the expansion of built-up land in the areas surrounding most stations along the Ethiopian section of ADR (Figure 14). The growth of population in the area around stations will lead to a growth in demand for residential space. In Ethiopia, urban residential space is dominated by low-rise residential buildings, owner-occupied housing, and informal housing. Therefore, the growth of residential space and the construction of urban amenities will further lead to the expansion of built-up land. Approximately 20,000 local workers were employed on the project during the construction of the ADR, and 4,000 direct jobs were created during its operation. The population growth in the area around the stations was not only due to the natural growth of the population in the region, employment growth, and agglomeration driven by the ADR, but also due to other factors, including the outflow of population from the central area, employment created by the ADR’s ancillary industries, and rural-urban migration.
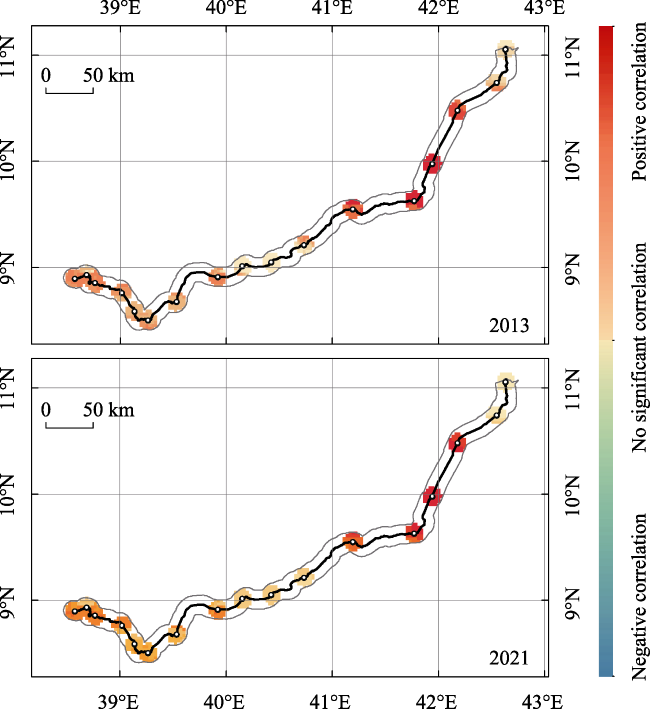
Figure 14 Spatial distribution of the population size in the GWR Model
(iii) The spatial differentiation of the impact of distance from the central city on the expansion of built-up land in the surrounding areas
There was a local negative correlation between the distance from the central city and the intensity of the expansion of built-up land (Figure 15). To the west of Feto station, there was a strong negative correlation, i.e., the farther away from the central city, the lower the intensity of the expansion of built-up land. To the east of Feto station, there was no significant correlation between the distance from the central city and the intensity of the expansion of built-up land.
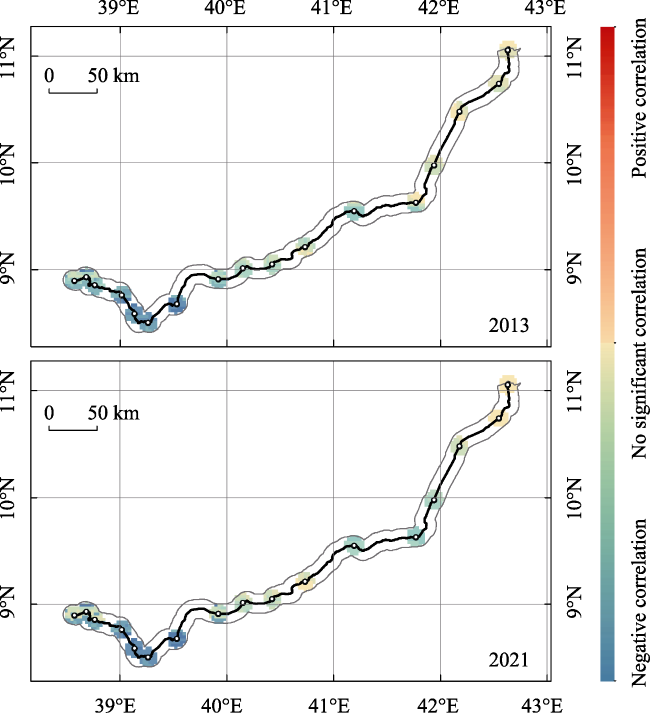
Figure 15 Spatial distribution of the distance from the central city in the GWR Model
To the west of Feto, the cities where the stations were located were mostly large and medium-sized cities (e.g., Addis Ababa, Adama, and Bishoftu), which possessed greater functionality and relatively higher attractiveness for development elements, even more so than the railway stations. The farther the area was from the urban center, the lower its agglomeration ability for population, capital, and enterprises, and the expansion of built-up land tended to be relatively slow.
To the east of Feto, Dire Dawa was the only medium-sized city with a regional influence, and the cities where each station were located, or were near, were mostly small towns, which was apparent from the land use structure around each station in Figure 10. The function of these small towns was relatively simple with limited attraction to the surrounding development elements. There was no significant difference in the agglomeration ability of development elements between the areas near and far from small towns. Most stations were also outside the radiation range of Dire Dawa City. Therefore, the distance from the central city had a weak correlation with the intensity of the expansion of built-up land in these areas.

5 Conclusions and discussion

5.1 Conclusions

Based on remote sensing images of 10 km buffer zones on both sides of the Ethiopian section of the ADR in 2013, 2017, and 2021, we analyzed the LUC in the area along the railway and its influencing factors. The specific conclusions were as follows.
(1) Along the railway, farmland, forest, grassland, and other land (including sandy land and bare land) were the primary land use, accounting for more than 95% of the study area. From 2013 to 2021, the areas of built-up land and farmland continued to increase, while the areas of forest, grassland and other land continued to decrease. Built-up land expanded the most with an increasing rate of change, indicating that there was more urban construction in the study area during the operating period than the construction period of the railway. Forest, farmland and grassland were the land use types most commonly transferred to built-up land, while forest and grassland were the land use types most commonly transferred to farmland.
(2) The degree of change in the area of built-up land, farmland and forest had a certain regularity as the buffer distance increased, indicating a gradient in the variation of LUC along the railway. The closer the built-up land to the railway within a certain distance, the greater the degree of change in its area, and the closer the farmland and forest to the railway, the greater the degree of change in their areas. The LDD of built-up land changed significantly within the 6 km buffer zone but presented a different trend beyond 6 km, indicating that 6 km may be the threshold distance for the noticeable impact of the railway on the area change of built-up land in the surrounding region. The closer the buffer zone to the railway, the higher the LDD of comprehensive land use, the more likely the land to be developed, and the more significant the proportions of built-up land and farmland.
(3) The land use structure and its changes in the areas surrounding the different stations had obvious differences. The proportion of built-up land within the 10 km buffer zones of stations in the Addis Ababa Metropolitan Area, Adama and Dire Dawa was relatively high, while it was much lower in the areas surrounding the other stations, which were still dominated by agriculture with little urbanization and industrial development. More than half of the stations were classed as low-low in terms of built-up land and were typically located in small and medium-sized towns. The high-high stations were all located in the regional central cities. The changes of built-up land along the railway were mainly concentrated in the capital and regional central cities.
(4) The construction and operation of the ADR was one of the direct factors affecting the landscape change along the railway. Regional migration and land development further promoted the recombination of land use along the railway, finally leading to substantial changes in landscape patterns.
(5) Based on an OLS analysis, the distance from the train station, whether the nearby station provides a passenger service, the population size and the distance from the central city had positive effects on the expansion of built-up land surrounding the stations. The factors of whether a nearby station provides a freight service had a negative correlation, slope, vegetation coverage, and distance from the railway line had little influence. Over time, social economic factors gradually replaced railway factors as the main driving force for the expansion of built-up land around the stations.
(6) Based on a GWR analysis, the effect strength of different factors on the expansion of built-up land was found to vary in the areas surrounding the different stations. There were different correlations between the distance from the station and the expansion of built-up land. In the areas around Bishoftu, Modjo and Adama stations, there was a significant negative correlation. In the area around Dire Dawa station, there was a positive correlation that increased over time. In the areas around the other stations, there were no significant correlations. There was a relatively significant positive correlation between the population size and the expansion of built-up land in the areas surrounding most stations. There was a local negative correlation between the distance from the central city and the expansion of built-up land in the area to the west of Feto station.

5.2 Discussion

The impact of the ADR on regional development along the railway has been the focus of many studies since its construction. This study objectively determined the LUC in the area along the railway and identified the factors influencing LUC. Since 2013, the land use structure along the ADR has changed considerably. The railway was one of the driving factors but its driving effect weakened over time compared with other social and economic factors. The ADR has driven the urbanization process in the area along the railway; however, the degree of change in the area of built-up land in most small and medium-sized towns along the railway was quite low, and was only relatively obvious in the regional central cities. This shows that the urbanization along the railway was mainly concentrated in the regional central cities. This was likely due to the differences in economic development along the railway, but may also be related to the differentiated operation of the ADR in its current stage of activity.
Due to the limitations of market demand, infrastructure, and operational capacity, the ADR is not yet fully operational (Figure 16). The efficiency of the railway is therefore not fully developed, leading to an unbalanced flow of regional development elements. For example, the section from Sebeta to Adama stations is double-tracked, while the section from Adama to Nagad stations in Djibouti is single-tracked (Railway Technology, 2020). In terms of passenger transport, short-distance intercity trains are being operated between Furi-Labu and Adama stations, with one pair of trains in the morning and one in the afternoon. The Furi-Labu to Nagad section is open to international long-distance express trains on alternate days. Of the 17 stations in Ethiopia, only ten currently offer passenger or freight services, with most of these located in Addis Ababa, Adama, Dire Dawa and the border areas. The stations established in other small towns have a limited capacity to provide passenger and freight services. The distribution of people and goods relying on ADR mainly occurs at specific stations, which explains the regional differences in the changes in the area of built-up land to some extent. At present, the model of railway-oriented development has only been realized in the capital and regional central cities in Ethiopia. It is likely to still take a long time in other less developed areas before the railway will be fully operational and therefore able to drive local development.
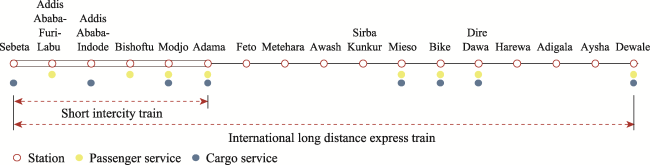
Figure 16 Operation strategy of the Ethiopian section of the Addis Ababa-Djibouti Railway
There is great hope that Africa will enter the railway age. As part of the Agenda 2063 strategic framework for the socio-economic transformation of Africa, the concept of an integrated high-speed rail network in Africa was endorsed by the heads of African countries at the 24th African Union Summit in 2013 (UIC, 2020). In Ethiopia, the railway network has been identified as one of the flagship programs in the Growth and Transformation Plan I and II (GTP Ⅰ and GTP Ⅱ) to facilitate the development of corridors and connect the country to neighboring countries. To harness the full potential of the driving effect of railways in Africa, it is crucial to understand the LUC along the railway and its influencing factors, which may help to formulate or adjust further development strategies and plans. The opportunity for railway-driven development has been created in Ethiopia. The challenge for achieving widespread and inclusive economic growth is how to connect large cities and small and medium-sized towns to the ADR, and to ensure that the new infrastructure and opportunities bring benefits through policy tools, regional participation, and consultation.
This study did have some limitations. First, the acquisition of land use data was based on a visual interpretation assisted by Google high-resolution images. Although high-resolution satellite images for the months when conditions enabled an easy identification of land use were selected, there was still the potential for identification errors. Second, there was a limit to the volume of data available for the quantitative analysis of influencing factors, due to the lack of availability of social and economic data for areas along the railway. Additionally, the study could be extended to the micro level. For example, an empirical study of LUC and its influencing factors could be conducted in the areas around specific stations, with the accurate identification of land use types and attributes, including the exact functions, land ownership, and land valuations. This would enable the formulation of a land development plan, the optimization of urban spatial layout, and the improvement of land use efficiency.
[1]
Baike, 2022. Addis Ababa-Djibouti Railway. Available at: https://baike.baidu.com/item/%E4%BA%9A%E5%90%89%E9%93%81%E8%B7%AF/20123454?fr=aladdin#2_2. Cited 02 March 2022.

[2]
Bharule S, Kidokoro T, Seta F, 2019. Evolution of high-speed rail and its development effects: Stylized facts and review of relationships. Asian Development Bank Institute Working Paper Series. Manila: Asian Development Bank.

[3]
Chen M X, 2021. Analysis on development strategy of African railway and market development strategy. Railway Transport and Economy, 43(3): 122-128. (in Chinese)

[4]
Chen Y G, Liu J S, 2001. An index of equilibrium of urban land use structure and information dimension of urban form. Geographical Research, 20(2): 146-152. (in Chinese)

[5]
Cilliers S S, Bredenkamp G J, 1998. Vegetation analysis of railway reserves in the Potchefstroom municipal area, North West Province, South Africa. South African Journal of Botany, 64(5): 271-280.

[6]
De Montis A, Martín B, Ortega E et al., 2017. Landscape fragmentation in Mediterranean Europe: A comparative approach. Land Use Policy, 64: 83-94.

[7]
Debrezion G, Pels E, Rietveld P, 2007. The effects of railway investments in a polycentric city: A comparison of competitive and segmented land markets. Environment and Planning A, 39(9): 2048-2067.

[8]
Docherty I, 2000. Cities on Rails (Book Review). Urban Studies, 37(8): 1464.

[9]
Dong S C, Yang Y, Li F J et al., 2018. An evaluation of the economic, social, and ecological risks of China-Mongolia-Russia high-speed railway construction and policy suggestions. Journal of Geographical Sciences, 28(7): 900-918.

[10]
Eizaguirre-Iribar A, Grijalba O, Hernández-Minguillón R J, 2020. An integrated approach to transportation and land use planning for the analysis of former railway nodes in sustainable transport development: The case of the Vasco-Navarro railway. Sustainability, 13(1): 322.

[11]
Githaiga N M, Bing W, 2019. Belt and road initiative in Africa: the impact of standard gauge railway in Kenya. China Report, 55(3): 219-240.

[12]
Guo Q Z, Jiang W G, Wang Z H, 2015. Effect of high-speed railway on the spatial-temporal changes of surrounding area land use. Journal of Chongqing Jiaotong University (Natural Science), 34(4): 133-139. (in Chinese)

[13]
Han Z, Li X, Liu X P et al., 2019. Will the development of a high-speed railway have impacts on land use patterns in China? Annals of the American Association of Geographers, 109(3): 979-1005.

[14]
He D, Zhou J, Cai J M et al., 2021. Analysis of land use and landscape pattern changes on the areas along the high-speed railway in China. Ecological Science, 40(4): 184-194. (in Chinese)

[15]
Heneidy S Z, Halmy M W, Toto S M et al., 2021. Pattern of urban flora in intra-city railway habitats (Alexandria, Egypt): A conservation perspective. Biology, 10(8): 698.

[16]
Jaeger J A, 2000. Landscape division, splitting index, and effective mesh size: New measures of landscape fragmentation. Landscape Ecology, 15(2): 115-130.

[17]
Jedwab R, Storeygard A, 2019. Economic and political factors in infrastructure investment: Evidence from railroads and roads in Africa 1960-2015. Economic History of Developing Regions, 34(2): 156-208.

[18]
Jiang F, 2020. Chinese contractor involvement in wildlife protection in Africa: Case study of Mombasa-Nairobi standard gauge railway project, Kenya. Land Use Policy, 95: 104650.

[19]
Jiang Z J, 2014. Human Geography of Modern Africa. Nanjing: Nanjing University Press. (in Chinese)

[20]
Jin X B, Zhou Y K, Tang X L et al., 2010. Land destruction features and reclamation decision for temporary built-up land in high-speed railway: A case study in Changzhou Section of Beijing-Shanghai High Speed Railway. Journal of Natural Resources, 25(7): 1070-1078. (in Chinese)

[21]
Li D X, Wang X P, 2021. Land use change and efficiency in Laos’ special economic zones. Land, 10(10): 1012.

[22]
Li R X, 2011. Study on the land development strategy for inter-city rail transport hub. Journal of Urban and Regional Planning, 4(3): 176-188. (in Chinese)

[23]
Li S P, Zeng Y, Zhou P et al., 2017. Dynamic change and driving force analysis of land use of Yiyang city based on RS/GIS. Land & Resources Herald, 14(3): 76-84. (in Chinese)

[24]
Li T Z, Yang X M, Zhao X S et al., 2013. High-speed rail’s influence on urban and regional spatial development: A review. Urban Development Studies, 20(2): 71-79. (in Chinese)

[25]
Li X J, Zhang M M, Wang J H, 2022. The spatio-temporal relationship between land use and population distribution around new intercity railway stations: A case study on the Pearl River Delta region, China. Journal of Transport Geography, 98: 103274.

[26]
Liu B L, Wagner L E, Ning D H et al., 2017. Estimation of wind erosion from construction of a railway in arid Northwest China. International Soil and Water Conservation Research, 5(2): 102-108.

[27]
Liu C L, Chang J, Liu N et al., 2020. Study of the effect of high-speed railway construction on the changes of surrounding area land use: Based the high speed railway of Beijing to Shanghai in Shandong province. Journal of Xi’an University of Technology, 36(3): 367-375, 423. (in Chinese)

[28]
Loo B P, Huang Z R, 2023. Location matters: High-speed railway (HSR) stations in city evolution. Cities, 139: 104380.

[29]
Mararakanye N, Magoro M N, Matshaya N N et al., 2017. Railway side mapping of alien plant distributions in Mpumalanga, South Africa. Bothalia-African Biodiversity & Conservation, 47(1): 1-11.

[30]
Mukwena M, 2018. Analysis of factors undermining the reliability of railway track in South Africa[D]. Johannesburg: University of Johannesburg.

[31]
Niu F Q, Xin Z L, Sun D Q, 2021. Urban land use effects of high-speed railway network in China: A spatial spillover perspective. Land Use Policy, 105: 105417.

[32]
Padonou E A, Lykke A M, Bachmann Y et al., 2017. Mapping changes in land use/land cover and prediction of future extension of Bowé in Benin, West Africa. Land Use Policy, 69: 85-92.

[33]
Railway Technology, 2020. Ethiopia-Djibouti Railway Line modernisation. Available at: https://www.railway-technology.com/projects/ethiopia-djibouti-railway-line-modernisation/. Cited 20 March 2022.

[34]
Rong W, Li Y C, Wang S J, 2022. Will the construction of high-speed rail accelerate urban land expansion? Evidences from Chinese cities. Land Use Policy, 114: 105920.

[35]
Santos D C, Souza-Filho P W M, da Rocha Nascimento Jr W et al., 2020. Land cover change, landscape degradation, and restoration along a railway line in the Amazon biome, Brazil. Land Degradation & Development, 31(15): 2033-2046.

[36]
Schutz E, 1998. Stadtentwicklung durch Hochgeschwindigkeitsverkehr (Urban development by high-speed railways). Heft, 6: 369-383.

[37]
Song Y, Jin L, Wang H B, 2018. Vegetation changes along the Qinghai-Tibet Plateau engineering corridor since 2000 induced by climate change and human activities. Remote Sensing, 10(1): 95.

[38]
Tang X L, Jin X B, Shen C Z et al., 2010. Characteristics of land damage due to high-speed railway construction and the prevention and control measures. China Land Science, 24(1): 56-60. (in Chinese)

[39]
Toffolo C, Gentili R, Banfi E et al., 2021. Urban plant assemblages by land use type in Milan: Floristic, ecological and functional diversities and refugium role of railway areas. Urban Forestry & Urban Greening, 62: 127175.

[40]
UIC, 2020. Update on the African integrated high-speed railway network by AUDA-NEPAD. Available at: https://uic.org/com/enews/nr/700/article/update-on-the-african-integrated-high-speed-railway-network-by-auda-nepad?page=modal_enews. Cited 20 March 2022.

[41]
Wang D G, Xu Y F, Zhao M F, 2022. Spatial differentiation and influence mechanism of the connection-distribution performance of urban high-speed railway hub in the Yangtze River Economic Belt. Journal of Geographical Sciences, 32(12): 2475-2502.

[42]
Wang J E, Ding J X, 2011. High-speed rail and its impacts on the urban spatial structure of China. Urban Planning International, 26(6): 49-54. (in Chinese)

[43]
Wang J L, Wei H S, Cheng K et al., 2019. Spatio-temporal pattern of land degradation along the China-Mongolia Railway (Mongolia). Sustainability, 11(9): 2705.

[44]
Wu J S, Cao Q W, Shi S Q et al., 2015. Spatio-temporal variability of habitat quality in Beijing-Tianjin-Hebei area based on land use change. Chinese Journal of Applied Ecology, 26(11): 3457-3466. (in Chinese)

[45]
Yang C Y, Wang S X, Yang C Y et al., 2021. Spatial-temporal variation characteristics of vegetation coverage along Sichuan-Tibet Railway. Journal of Arid Land Resources and Environment, 35(3): 174-182. (in Chinese)

[46]
Zeng W Y, Lei J, Zhang X L, 2012. Regional disparities in urban land use intensity among oasis cities along the railway line in the north of Xinjiang. Journal of Graduate University of Chinese Academy of Sciences, 29(1): 47-53. (in Chinese)

[47]
Zhang L, Wu Y D, Li J, 2018. Analysis of characteristics of land use change along scenic highway: Taking the East Ring Road of Erhai,Dali as an example. Resources and Environment in the Yangtze Basin, 27(12): 2707-2717. (in Chinese)

[48]
Zhao S B, Lu Y F, Wang X P et al., 2023. Study on the development effect and strategies of the railway economic corridors in Africa: A case study of the Addis Ababa-Djibouti Railway. Urban Development Studies, 30(3): 30-39. (in Chinese)

[49]
Zhong Y C, Feng J, He X R, 2016. The different impacts of rail transit on urban land use between different sections: A case study of the No.2 Rail Transit Line in Wuhan. Areal Research and Development, 35(5): 86-93. (in Chinese)

[50]
Zibibula S, Paxiagu A, Suliye M, 2012. Relationship between urbanization level and land use structure in five cities along south Xinjiang Railroad. Journal of Desert Research, 32(1): 264-269. (in Chinese)

Outlines

/