
Journal of Geographical Sciences >
Travel behavior resilience: Theory, method, and empirical studies
This paper is initially published in Acta Geographica Sinica (Chinese edition), 2023, 78(10): 2507‒2519.
|
Huang Jie, PhD and Associate Professor, specialized in big data and urban transport geography. E-mail: huangjie@igsnrr.ac.cn |
Received date: 2024-04-16
Accepted date: 2024-05-22
Online published: 2024-08-16
Supported by
National Natural Science Foundation of China(42225106)
National Natural Science Foundation of China(42121001)
Youth Innovation Promotion Association of Chinese Academy of Sciences(2021049)
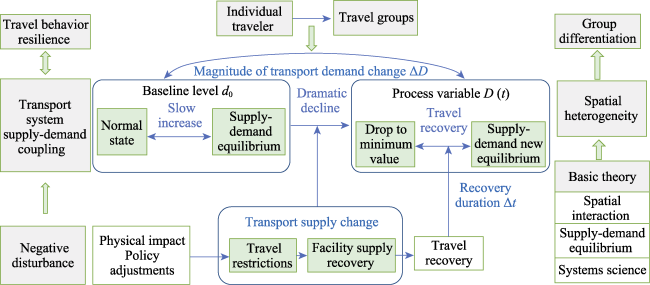
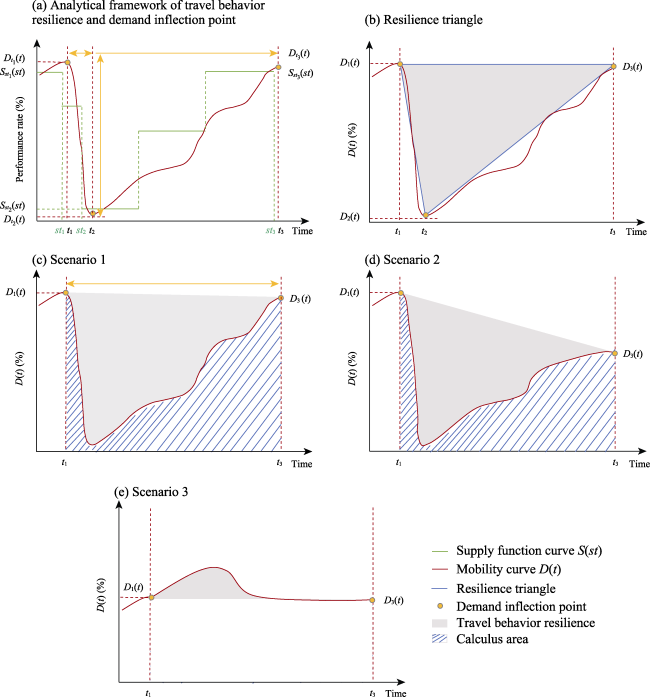
Resilience studies have long been a focal point in the fields of geography, social science, urban studies, and psychology. Recently, resilience studies from multiple disciplines have scrutinized resilience at an individual scale. As one important behavior in the daily life of human beings, travel behavior is characterized by spatial dependence, spatiotemporal dynamics, and group heterogeneity. Moreover, how to understand the interaction between travel behavior (or demand) and transportation supply and their dynamics is a fundamental question in transportation studies when transportation systems encounter unexpected disturbances. This paper refines the definition of travel behavior resilience based on fundamental theories from multiple disciplines, including ecology, transportation engineering, and psychology. Additionally, this paper proposes a conceptual theoretical framework of travel behavior resilience based on the dynamic equilibrium characteristics of transportation supply and demand. In general, travel behavior has three stages of variation, namely, dramatic reduction, rapid growth, and fluctuation recovery, which have helped capture the travel behavior resilience triangle. Then, we construct a corresponding evaluation methodology that is suitable for multiscale and multidimensional perspectives. We emphasize that the evaluation of travel behavior resilience should be process-oriented with temporal continuity or capture the inflection points of travel behavior. Using multisource big data such as mobile phone signaling data and smart card data, this paper reviews empirical studies on travel behavior resilience, exploring its spatial heterogeneity and group differences. With location-based analysis, we confirm that people show greater travel behavior resilience in places where people engage in various socioeconomic activities. The group-based analysis shows that age and socioeconomic attributes of mobility groups significantly affect travel behavior resilience. Travel behavior resilience can be one pillar, offering geographic perspectives in resilience studies. In the future, the study of travel behavior resilience at multiple scales and from multiple perspectives can explore the spatial heterogeneity of transportation re-equilibrium and travel modal differences, contributing to urban spatial structure studies. Studying travel behavior resilience can provide scientific and technological support for urban management and resilient city construction.
Key words: resilience; residential travel; social group; urban transportation; big data
HUANG Jie , WANG Jiaoe . Travel behavior resilience: Theory, method, and empirical studies[J]. Journal of Geographical Sciences, 2024 , 34(8) : 1657 -1674 . DOI: 10.1007/s11442-024-2265-4
Table 1 Categories and examples of disturbance and its influence on travel willingness |
| Disturbance feature | Examples | Travel willingness | ||
|---|---|---|---|---|
| Direction | Duration | Attributes | ||
| Negative | Long | Hard | Private car restriction measures, Lottery systems for private vehicle license plates | Passive restriction |
| Soft | Advocacy for travel reduction during pandemic periods | Spontaneous reduction | ||
| Short | Hard | Earthquakes, mudslides, and other natural disasters; Lockdowns and home quarantine among pandemic prevention measures | Passive restriction | |
| Soft | Advocacy for travel reduction during severe weather warnings | Spontaneous reduction | ||
| Positive | Long | Soft | Summer and winter vacations | Spontaneous increase |
| Short | Soft | Major sporting and entertainment events | Fluctuation | |
| Periodic | Soft | Weekends and public holidays | Spontaneous increase | |
Note: Negative disturbances are typically sporadic, with infrequent occurrences of periodic and regular negative disruptions; positive disturbances often serve as inducing stimuli, rarely resulting in significant impacts. |
Figure 1 A theoretical framework of travel behavior resilience |
Table 2 Indicators in the study of transport network resilience |
| Indicators | Meaning | Judgment criteria |
|---|---|---|
| Robustness | Resisting negative disturbances to preserve the fundamental service levels of transportation systems Smin. | $\bar{S}={{S}_{\text{min}}}$ |
| Bouncebackability | Bouncing back to a stable state prior to the negative disturbance, that is, the normal service level of the transportation system before the disturbance. | $\bar{S}={{S}_{0}}$ |
| Adaptability | Resisting negative disturbances and adjusting to the maximum level of service that can be provided ${{\bar{S}}_{\text{max}}}$. | $\bar{S}={{\bar{S}}_{\max }}$ |
| Flexibility | Responding to negative disturbances, exhibiting the anticipated level of service Sexp. | $\bar{S}={{S}_{\text{exp}}}$ |
| Agility | Responding to negative disturbances, demonstrating unanticipated changes in service. | $\bar{S}\ne {{S}_{\text{exp}}}$ |
| Vulnerability | The maximum degree of disturbance that can be resisted, and the level of disturbance when the service level is at its lowest. | $\bar{S}=0$ |
Source: Compiled by the author. Herein, the normal service level of the transportation system prior to experiencing a negative disturbance is represented by S0, while the service level exhibited after the negative disturbance is denoted by $\bar{S}$. |
Figure 2 Illustration of the travel behavior resilience calculation and inflection points |
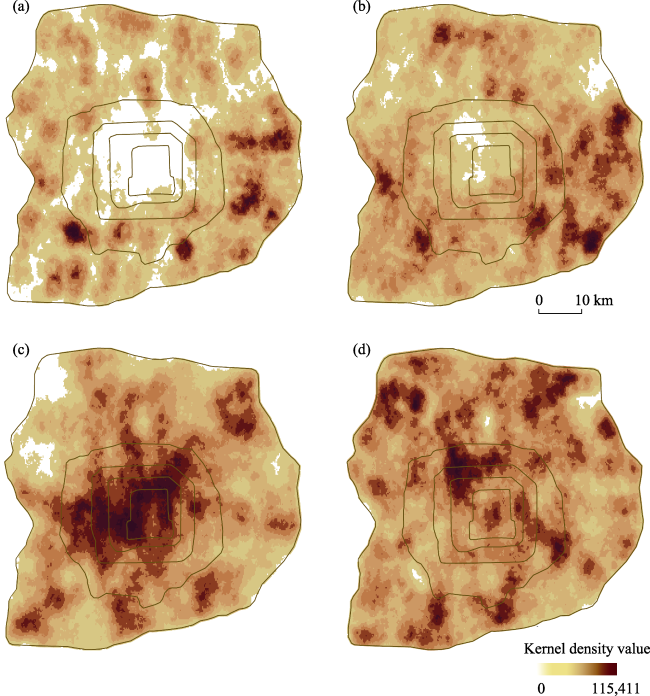
Figure 3 Spatial differentiation of travel behavior resilience according to kernel density analysis in Beijing (a. small variation with slow recovery; b. small variation with fast recovery; c. large variation with slow recovery; d. large variation with fast recovery) |
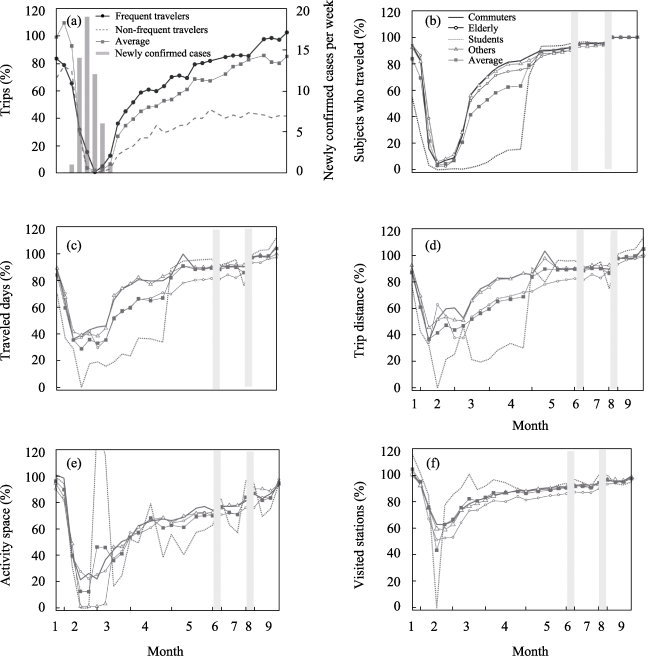
Figure 4 Research samples and travel behavior variations of mobility groups during the COVID-19 pandemic (2020 vs. 2019 monthly average levels) |
Table 3 Travel behavior resilience values by mobility group between February and September |
| Mobility groups | Traveled days | Trip distance | Activity spaces | Visited Stations |
|---|---|---|---|---|
| Commuters | 0.067 | 0.062 | -(93%) | 0.060 |
| Elderly | -(97%) | 0.061 | -(97%) | -(97%) |
| Students | 0.062 | 0.069 | 0.059 | -(95%) |
| Others | 0.060 | 0.061 | -(94%) | -(89%) |
Sincere appreciation is extended to the anonymous peer reviewers for the time and effort they invested in reviewing this manuscript. The reviewers provided constructive suggestions for improvements on the conceptual theoretical framework, methodological model, empirical studies, and conclusions, from which this paper has greatly benefited. Furthermore, gratitude is expressed to our PhD student FAN Wenying for conducting the data analysis for the case study in section 4.1. Also, we would like to thank our PhD student HE Wanqin for her careful assistance in translation.
| [1] |
|
| [2] |
|
| [3] |
|
| [4] |
|
| [5] |
|
| [6] |
|
| [7] |
|
| [8] |
|
| [9] |
|
| [10] |
|
| [11] |
|
| [12] |
|
| [13] |
|
| [14] |
|
| [15] |
|
| [16] |
|
| [17] |
|
| [18] |
|
| [19] |
|
| [20] |
|
| [21] |
|
| [22] |
|
| [23] |
|
| [24] |
|
| [25] |
|
| [26] |
|
| [27] |
|
| [28] |
|
| [29] |
|
| [30] |
|
| [31] |
|
| [32] |
|
| [33] |
|
| [34] |
|
| [35] |
|
| [36] |
|
| [37] |
|
| [38] |
|
| [39] |
|
| [40] |
|
| [41] |
|
| [42] |
|
| [43] |
|
| [44] |
|
| [45] |
|
| [46] |
|
/
| 〈 |
|
〉 |