
Journal of Geographical Sciences >
The location choice of Chinese investment in the United States: Industrial agglomeration, ethnic networks and firm heterogeneity
|
Si Yuefang (1982-), PhD and Professor, specialized in Chinese outward FDI, firm innovation and innovation networks. E-mail: yfsi@re.ecnu.edu.cn |
Received date: 2023-07-29
Accepted date: 2024-02-07
Online published: 2024-05-31
Supported by
National Natural Science Foundation of China(42130510)
National Natural Science Foundation of China(41871110)
The National Social Science Fund of China(23BJL113)
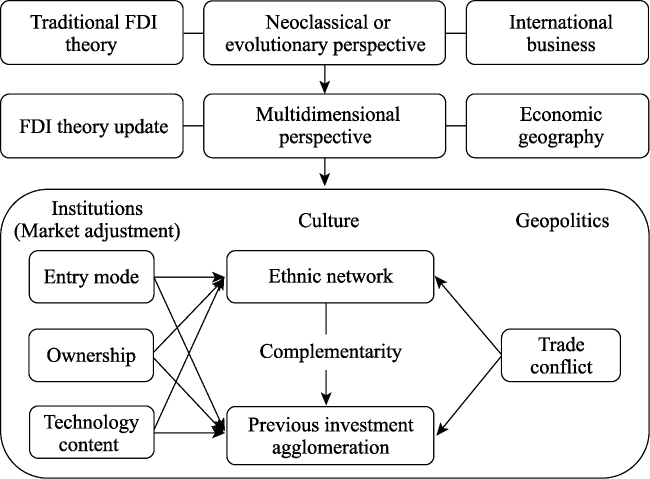
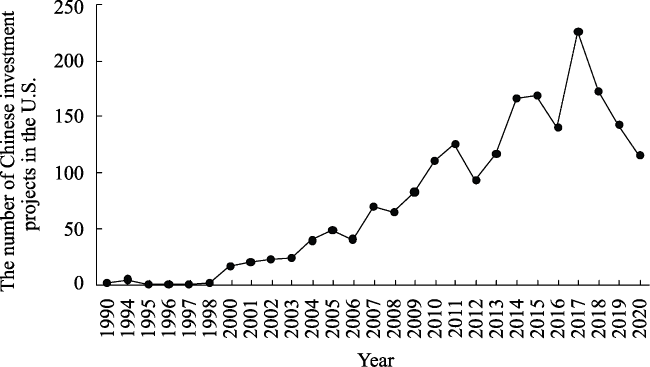
China’s outward foreign direct investment (FDI) is different from traditional FDI in various ways, for example being rooted in “Guanxi” in Chinese culture, influenced by government, and located in developed economies where they have limited ownership advantages compared with local firms. Chinese investment in the United States (the U.S.) is an example of how the location is influenced by economic factors, social linkages, as well as geopolitical events, such as the U.S.-China trade conflict, which deserves more academic attention. It is such a complex phenomenon that cannot be fully explained by traditional FDI theories, which mainly focus on economic factors. In this paper, we illustrate the historical development, distribution and firm heterogeneity of Chinese investment in the U.S. from 2000 to 2020, and use a conditional logit model to investigate the location factors. Our study reveals that the number of Chinese investment projects in the U.S. peaked in 2017 and has declined year-over-year since then. These projects are mainly located along the East and West coasts of the U.S. and around the Great Lakes, with the largest numbers in California and New York. Previous Chinese investment agglomeration and ethnic networks both influence the location choice of China’s outward FDI, even when controlling for regional attributes and economic embeddedness. In terms of firm heterogeneity, Chinese firms that enter the American market with greenfield investment modes, state-owned enterprises and firms in high-tech sectors are more likely to follow previous Chinese investment, but place less emphasis on Chinese ethnic linkages, implying that previous Chinese investment agglomeration can replace the role of Chinese ethnic networks for these firms. Finally, the U.S.-China trade conflict has significantly lessened the active role of Chinese ethnic networks and has reduced Chinese investment in states with higher industrial output.
SI Yuefang , SUN Hanyan , WANG Junsong , LIANG Xinyi . The location choice of Chinese investment in the United States: Industrial agglomeration, ethnic networks and firm heterogeneity[J]. Journal of Geographical Sciences, 2024 , 34(5) : 985 -1006 . DOI: 10.1007/s11442-024-2236-9
Figure 1 Research framework of the paper |
Table 1 Variable descriptions and sources |
| Variable | Description | Source | |
|---|---|---|---|
| Ethnic links | ln Chinese | Log of the number of ethnic Chinese in the host state | U.S. Census Bureau |
| Previous Chinese investment | ln cn_invest | Log of the previous FDI Stock of China provinces in the U.S. | The U.S.-China Investment Project |
| ln cn_invest_sector | Log of the previous FDI Stock of China provinces in the U.S. in the same industry | The U.S.-China Investment Project | |
| ln cn_invest_sector_ mode | Log of the previous FDI Stock of China provinces in the U.S. in the same industry in the same entry mode | The U.S.-China Investment Project | |
| Economic factors | ln sector output | Log of the output of the same industry of the states | BEA |
| ln wage | Log of the average wage per worker of the states | BEA | |
| ln tax | Log of tax of the states | BEA | |
| ln subsidy | Log of subsidies of the states | BEA | |
| Labor union | The percentage of each state’s non-agricultural wage and salary employees who are union members | www.unionstats.com | |
| Resource rate | The ratio of the resource industry to the whole industry | BEA | |
| Innovation | ln patent | Log of the number of the patents of the states | The U.S. Patent and Trademark Office |
Table 2 Chinese investment in the U.S., 2001-2020 |
| Number of Chinese investment projects in the U.S. | Share (%) | ||
|---|---|---|---|
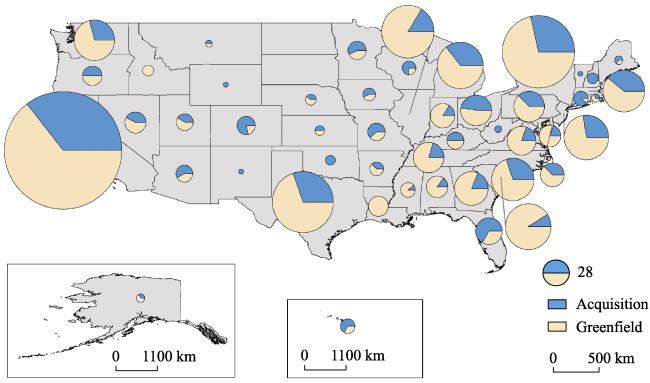
| Entry mode | Greenfield | 1417 | 67 |
| Acquisition | 683 | 33 | |
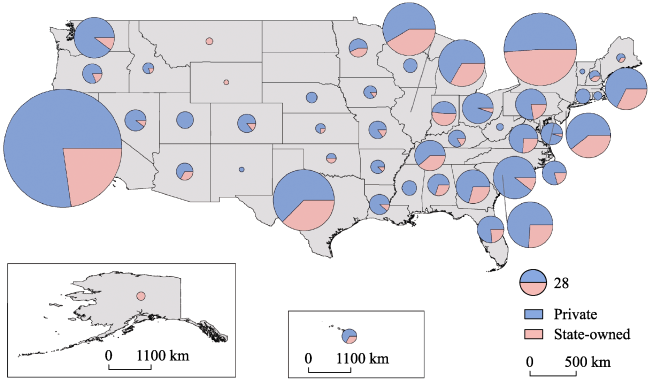
| Ownership | Private | 1505 | 72 |
| State-owned | 595 | 28 | |
| Technical types | High-tech industry | 916 | 44 |
| Traditional industry | 1184 | 56 |
Note: Following Michael Wolf and Dalton Terrell (2016), we consider high-tech industries to include Automotive, Aviation, Electronics and Electrical Equipment, Health, Pharmaceuticals and Biotechnology, ICT, and Machinery. The remaining industries subject to investment are considered traditional industries. |
Table 3 Sector distribution of Chinese investment in the U.S. (2001-2020) |
| Sector | Number of Chinese investment projects in the U.S. | Share (%) | |
|---|---|---|---|
| High-tech industries | Automotive | 261 | 12.43 |
| Aviation | 23 | 1.10 | |
| Electronics and electrical equipment | 95 | 4.52 | |
| Health, pharmaceuticals and biotechnology | 201 | 9.57 | |
| ICT | 222 | 10.57 | |
| Machinery | 114 | 5.43 | |
| Traditional industries | Agriculture and food | 40 | 1.90 |
| Basic materials, metals and minerals | 165 | 7.86 | |
| Consumer products and services | 178 | 8.48 | |
| Energy | 154 | 7.33 | |
| Entertainment, media and education | 53 | 2.52 | |
| Financial and business services | 103 | 4.90 | |
| Real estate and hospitality | 388 | 18.48 | |
| Transport, construction and infrastructure | 103 | 4.90 | |
| Total | 2100 | 100.00 | |
Figure 2 The number of Chinese investment projects in the U.S. (1990-2020) |
Figure 3 Distribution of Chinese investment via acquisition and greenfield in the U.S. (2001-2020) |
Figure 4 Distribution of Chinese investment from private investors and SOEs in the U.S. (2001-2020) |
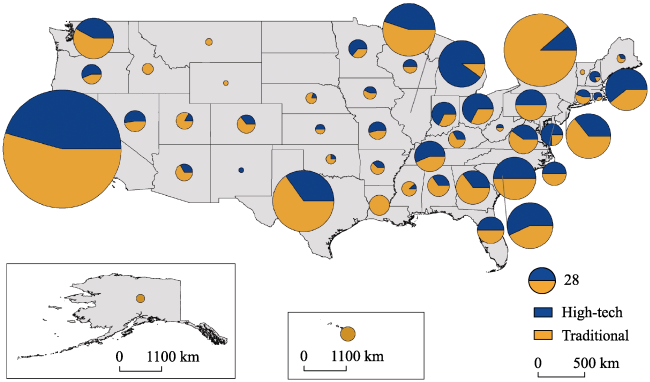
Figure 5 Distribution of Chinese MNEs in high-tech industry and traditional industry investment projects in the U.S. (2001-2020) |
Table 4 Estimation for Chinese MNEs in the U.S. |
| Variables | (1) | (2) | (3) | (4) | (5) |
|---|---|---|---|---|---|
| ln Chinese | 0.395*** | 0.248*** | 0.244*** | ||
| (0.046) | (0.048) | (0.048) | |||
| ln patent | 0.053 | -0.006 | 0.448*** | 0.164*** | -0.061 |
| (0.054) | (0.051) | (0.031) | (0.032) | (0.054) | |
| ln cn_invest | 0.162*** | 0.181*** | 0.159*** | ||
| (0.017) | (0.017) | (0.017) | |||
| ln cn_invest_sector | 0.194*** | 0.175*** | 0.179*** | ||
| (0.022) | (0.022) | (0.023) | |||
| ln cn_invest_sector_mode | 0.372*** | 0.373*** | 0.372*** | ||
| (0.024) | (0.024) | (0.024) | |||
| ln sector output | 0.655*** | 0.703*** | 0.116*** | 0.108*** | |
| (0.038) | (0.037) | (0.036) | (0.036) | ||
| ln wage | 0.265*** | 0.163*** | 0.322*** | 0.136*** | 0.119*** |
| (0.048) | (0.040) | (0.048) | (0.044) | (0.042) | |
| Labor union | -0.012** | -0.035*** | 0.008 | -0.020*** | -0.033*** |
| (0.006) | (0.006) | (0.005) | (0.005) | (0.006) | |
| ln tax | 0.198*** | 0.156*** | 0.246*** | 0.141*** | 0.117*** |
| (0.047) | (0.043) | (0.048) | (0.045) | (0.044) | |
| ln subsidy | 0.097 | 0.093 | 0.125** | 0.093 | 0.079 |
| (0.059) | (0.058) | (0.059) | (0.058) | (0.058) | |
| Resource rate | -6.371*** | -6.225*** | -6.498*** | -6.876*** | -7.018*** |
| (1.034) | (0.998) | (1.059) | (1.060) | (1.057) | |
| Observations | 107,100 | 107,100 | 107,100 | 107,100 | 107,100 |
| Pseudo R2 | 0.274 | 0.393 | 0.269 | 0.392 | 0.393 |
Note: Standard errors in parentheses, *** p<0.01, ** p<0.05, * p<0.1. |
Table 5 Conditional logit estimation for Chinese MNEs in the U.S. according to firm heterogeneity |
| Variables | (1) Greenfield | (2) Acquisition | (3) Private | (4) State-owned | (5) High-tech | (6) Traditional |
|---|---|---|---|---|---|---|
| ln Chinese | 0.308*** | 0.050 | 0.187*** | 0.408*** | 0.169** | 0.288*** |
| (0.058) | (0.087) | (0.058) | (0.089) | (0.074) | (0.067) | |
| ln patent | -0.191*** | 0.188* | 0.082 | -0.457*** | 0.058 | -0.128* |
| (0.065) | (0.097) | (0.065) | (0.101) | (0.097) | (0.067) | |
| ln cn_invest | 0.187*** | 0.110*** | 0.144*** | 0.201*** | 0.160*** | 0.158*** |
| (0.022) | (0.027) | (0.019) | (0.037) | (0.027) | (0.022) | |
| ln cn_invest_sector | 0.131*** | 0.136*** | 0.184*** | 0.168*** | 0.172*** | 0.181*** |
| (0.031) | (0.040) | (0.025) | (0.051) | (0.036) | (0.029) | |
| ln cn_invest_sector_mode | 0.562*** | 0.263*** | 0.344*** | 0.452*** | 0.387*** | 0.361*** |
| (0.038) | (0.038) | (0.027) | (0.056) | (0.038) | (0.032) | |
| ln sector output | 0.053 | 0.245*** | 0.057 | 0.321*** | 0.122** | 0.110** |
| (0.044) | (0.065) | (0.042) | (0.076) | (0.056) | (0.052) | |
| ln wage | 0.224*** | -0.020 | 0.145*** | 0.083 | 0.159** | 0.063 |
| (0.055) | (0.067) | (0.053) | (0.074) | (0.076) | (0.061) | |
| labor union | -0.032*** | -0.015 | -0.041*** | -0.026** | -0.037*** | -0.034*** |
| (0.007) | (0.010) | (0.007) | (0.012) | (0.009) | (0.008) | |
| ln tax | 0.234*** | -0.024 | 0.096* | 0.153* | 0.162* | 0.131** |
| (0.058) | (0.067) | (0.052) | (0.079) | (0.083) | (0.058) | |
| ln subsidy | 0.125* | -0.188* | 0.075 | 0.039 | 0.018 | 0.088 |
| (0.069) | (0.101) | (0.075) | (0.093) | (0.155) | (0.062) | |
| resource rate | -9.943*** | -3.535** | -9.912*** | -1.875 | -5.955*** | -7.324*** |
| (1.403) | (1.680) | (1.350) | (1.613) | (1.630) | (1.453) | |
| Observations | 72,267 | 34,833 | 76,755 | 30,345 | 46,716 | 60,384 |
| Pseudo R2 | 0.426 | 0.357 | 0.376 | 0.458 | 0.385 | 0.401 |
Note: Standard errors in parentheses, *** p<0.01, ** p<0.05, * p<0.1. |
Table 6 Conditional logit estimation for Chinese MNEs in the U.S. according to temporal heterogeneity |
| Variables | (1) 2001-2007 | (2) 2008-2017 | (3) 2018-2020 |
|---|---|---|---|
| ln Chinese | 0.057 | 0.193*** | 0.140 |
| (0.126) | (0.060) | (0.134) | |
| ln patent | 0.092 | 0.008 | -0.092 |
| (0.173) | (0.067) | (0.149) | |
| ln cn_invest | 0.265*** | 0.144*** | 0.224*** |
| (0.053) | (0.020) | (0.038) | |
| ln cn_invest_sector | 0.044 | 0.211*** | 0.245*** |
| (0.109) | (0.027) | (0.047) | |
| ln cn_invest_sector_mode | 0.700*** | 0.351*** | 0.422*** |
| (0.133) | (0.028) | (0.050) | |
| ln sector output | 0.580*** | 0.086** | -0.321*** |
| (0.110) | (0.044) | (0.085) | |
| ln wage | 0.323 | 0.094* | 0.283*** |
| (0.220) | (0.052) | (0.104) | |
| Labor union | -0.016 | -0.034*** | -0.040** |
| (0.014) | (0.007) | (0.016) | |
| ln tax | 0.027 | 0.123** | 0.277** |
| (0.113) | (0.055) | (0.111) | |
| ln subsidy | -0.151 | 0.036 | 0.416** |
| (0.174) | (0.068) | (0.209) | |
| Resource rate | -3.838 | -6.964*** | -7.834** |
| (2.778) | (1.219) | (3.318) | |
| Observations | 13056 | 72012 | 22032 |
| Pseudo R2 | 0.353 | 0.390 | 0.497 |
Note: Standard errors in parentheses, *** p<0.01, ** p<0.05, * p<0.1. |
| [1] |
|
| [2] |
|
| [3] |
|
| [4] |
|
| [5] |
|
| [6] |
|
| [7] |
|
| [8] |
|
| [9] |
|
| [10] |
|
| [11] |
|
| [12] |
|
| [13] |
|
| [14] |
|
| [15] |
|
| [16] |
|
| [17] |
|
| [18] |
|
| [19] |
|
| [20] |
|
| [21] |
|
| [22] |
|
| [23] |
|
| [24] |
|
| [25] |
|
| [26] |
|
| [27] |
|
| [28] |
|
| [29] |
|
| [30] |
|
| [31] |
|
| [32] |
|
| [33] |
|
| [34] |
|
| [35] |
|
| [36] |
|
| [37] |
|
| [38] |
|
| [39] |
|
| [40] |
|
| [41] |
|
| [42] |
|
| [43] |
|
| [44] |
|
| [45] |
|
| [46] |
|
| [47] |
|
| [48] |
|
| [49] |
|
| [50] |
|
| [51] |
|
| [52] |
|
| [53] |
|
| [54] |
|
| [55] |
UNCTAD, 2023. World Investment Report 2023: Investing in Sustainable Energy for All. United Nations Publication,
|
| [56] |
|
| [57] |
|
| [58] |
|
| [59] |
|
| [60] |
|
| [61] |
|
| [62] |
|
| [63] |
|
| [64] |
|
| [65] |
|
| [66] |
|
| [67] |
|
| [68] |
|
| [69] |
|
| [70] |
|
| [71] |
|
| [72] |
|
/
| 〈 |
|
〉 |