Research Articles

Spatio-temporal characteristics of farmland occupation of construction land expansion and its spatial relationship with grain yield in China for 2000-2020

  • LI Zihua , 1, 2 ,
  • DING Mingjun , 3, 4, * ,
  • XIE Kun 5 ,
  • LI Jingru 3 ,
  • CHEN Liwen 6
Expand
  • 1. Territorial Spatial Survey and Planning Institute, Department of Natural Resources of Jiangxi Province, Nanchang 330025, China
  • 2. Engineering Technology Innovation Center for Ecological Protection and Restoration of Land Space in the Great Lakes Basin, Ministry of Natural Resources, Nanchang 330025, China
  • 3. School of Geography and Environment, Jiangxi Normal University, Nanchang 330028, China
  • 4. Key Lab of Poyang Lake Wetland and Watershed Research of Ministry of Education and School of Geography and Environment, Jiangxi Normal University, Nanchang 330028, China
  • 5. Yuzhang Normal University, Nanchang 330103, China
  • 6. Nanjing Engineering Vocational College of Jiangsu Province, Nanjing 211135, China
*Ding Mingjun (1978-), PhD and Professor, specialized in land use change. E-mail:

Li Zihua (1981-), Master Candidate, specialized in land use change. E-mail:

Received date: 2023-08-07

  Accepted date: 2024-01-25

  Online published: 2024-05-31

Supported by

National Natural Science Foundation of China(42161021)

National Natural Science Foundation of China(41761020)

Abstract

Construction land expansion is a key driver of urbanization and industrialization, yet it poses the risk of losing farmland and cascading impacts on food supply. The spatial characteristics of farmland occupied by construction land and its association with grain yield in China were unclear. We analyzed the characteristics of farmland converted into construction land, and its relationship with grain yield in China for 2000-2020. Construction land increased in area in central and western regions of China, and farmland decreased in area in southeastern China. The expansion of construction land in the North China Plain, Northeast China Plain, and the Loess Plateau, occurred at the expense of farmland. Except the southeast coast of China, grain yield increase was only weakly dependent on farmland area. Patterns in which farmland was converted into construction land and grain-yield change were highly coupled in southeastern coastal China, Sichuan Basin, Shandong Peninsula, and the Hu Huanyong Line. It should be noted that expansion in construction land area does have some influence on grain production; ultimately it is greatly affected by yield per unit area.

Cite this article

LI Zihua , DING Mingjun , XIE Kun , LI Jingru , CHEN Liwen . Spatio-temporal characteristics of farmland occupation of construction land expansion and its spatial relationship with grain yield in China for 2000-2020[J]. Journal of Geographical Sciences, 2024 , 34(5) : 855 -870 . DOI: 10.1007/s11442-024-2230-2

1 Introduction

Construction land expansion has emerged as the most rapid and irreversible process of land cover/land use change in the history of human civilization (Gao et al., 2020), and it is a key driver of urbanization and industrialization. However, construction land expansion has also brought forth a plethora of problems, such as farmland loss, habitat destruction, and conflicts of interest in the land acquisition process (Liu et al., 2014; Cao et al., 2018; Wang et al., 2019; Lu et al., 2021). Of these problems, farmland loss has received the most international attention (Tan et al., 2004; Liu et al., 2019). New construction land invariably encroaches on farmland, and farmland is the foundation of food production. The occupation of farmland for construction land and its relationship with food production is still a question worthy of debate.
Many studies have demonstrated that a large area of construction land is needed to accommodate urban expansion and industrial development. The consequent encroachment onto fertile farmland directly reduces farmland area (Deng et al., 2015; Pandey et al., 2015; Zhou et al., 2020). In practice, farmland conversion sometimes boosts grain output in some regions, while it decreases in others. Thus, the effects of farmland conversion into construction land are variable. When farmland area is reduced for urban usage, the change in land use may affect grain production. By 2030, it is estimated that growth in urban areas will cause a 1.8%-2.4% decrease in available farmland globally, potentially reducing crop production by 3%-4% (Bren et al., 2017). However, expansion in area of construction land may have little effect on grain production, because current increases in grain yield do not depend on farmland expansion (Feng et al., 2016; Wang et al., 2021). An FAO study showed that, from 1961-2005 there was substantial growth in global agricultural production, of which 77% was attributed to increased per unit area yield, 14% to expansion of farmland, and 9% to increased planting intensity (Zhou et al., 2021). Technological advancements in agriculture such as use of high-yield crop varieties or enhanced irrigation systems may even compensate for lost farmland, and contribute to increased grain productivity. Additionally, expansion in construction land usually enhances urbanization, and because people gravitate towards cities from rural areas, more idle rural housing land can be reclaimed, which may be beneficial to crop production (Deng et al., 2015; Mascarenhas et al., 2019).
China has the second-largest economy globally, and its rapid economic growth has occurred concomitant with a continuous expansion of land dedicated to construction. According to China’s National Bureau of Statistics, urban construction land in 1981 was 6720 km2, but by 2018 it had increased to 56,100 km2, up at an annual rate of 5.90%. China also has the largest global population, and to feed it the country needs considerable agricultural land. The government should not only ensure healthy city development but also ensure a supply of farmland. In response to the shortage of construction land and loss of high-quality farmland during urban development, policies including measures to balance between farmland requisition and compensation, regulate the equilibrium between expansion and reduction of urban-rural construction land, and delineate the “three lines” in urban planning (ecological protection red line, permanent basic farmland, and urban development boundary) have been implemented. The government has tried to reduce high-quality cultivated land occupation while ensuring an effective supply of construction land. However, the rapid expansion of construction land and its impact should not be underestimated.
How the distribution of land converted from farmland into construction land affected grain production was not clear. Therefore, we examined land-use and grain yield data at a county level in China between 2000 and 2020. Characteristics of farmland converted into construction land were reported, correlations between farmland area and grain production using a grain-farmland elasticity coefficient (GFEC) were identified, and spatial relationships between farmland occupied by construction land and grain production were explored. These analyses identify relationships between land use and grain production in China, provide a scientific foundation on which sustainable management of China’s cities and agricultural production can be improved, and our methodology potentially represents a template for similar studies more globally.

2 Research methods and materials

2.1 Data source and processing

Data on land use used in this study were derived from the global land cover data for the years 2000, 2010, and 2020, released by China’s National Geomatics Center, with a 30 m resolution (http://www.globallandcover.com/). There were ten first-class data types (farmland, tundra, shrubland, grassland, forest, wetland, water bodies, permanent snow and ice, artificial surface and bare land). We used “artificial surfaces” in the dataset as our metric of “construction land”, and this category concerned surfaces shaped by human activity. This category included diverse urban and rural residential areas, industrial and mining zones, transportation infrastructure, and other related areas. Conversely, contiguous green spaces and bodies of water were not considered as part of the construction land use classification. “Farmland” encompassed various types of land utilized for crop cultivation (e.g., paddy fields, rainfed upland areas, irrigated upland areas, vegetable plots, greenhouse land, farmland for crops and fruit trees, tea gardens, coffee plantations, cultivated pastures, and other economic agricultural lands). The total accuracies of GlobeLand30 for 2000, 2010 and 2020 were 83.15% (Wang et al., 2017), 83.50% and 85.72% (Fu et al., 2023), respectively. The spatial patterns of farmland and construction land in the study area in 2020 are shown in Figure 1. Grain production data came from the China County Statistical Yearbooks of 2001, 2011, and 2021. We used county-level administrative regions as the research units, and adjusted administrative districts of different years according to the administrative divisions in 2015. After excluding the counties without data, 2241 effective units were obtained. We excluded Hong Kong, Macao, and Taiwan.
Figure 1 Spatial patterns of farmland and construction land in China in 2020

2.2 Research methods

2.2.1 Indicators of land-use change

The “land use dynamic degree” indicates the magnitude and rate of the change in different types of land use over a specific period (Ning et al., 2018). We applied this degree to assess changes in area of construction land and farmland in accordance with equation (1):
$K=\frac{{{F}_{t2}}-{{F}_{t1}}}{{{F}_{t1}}}\times \frac{1}{T}\times 100\%$
where K is the degree of land use dynamics for construction land or farmland over the study
period T, Ft1 and Ft2 are the areas of construction land or farmland at the start and end of the study period, respectively, and T is the length/period of time over which the study was conducted.

2.2.2 Farmland occupied by construction land index

We established an index of farmland occupied by construction land and used it to quantify the extent to which farmland for construction expansion in accordance with equation (2):
$F=\frac{Fv{{C}_{t}}-Cv{{F}_{t}}}{\sum O{{V}_{t}}-\sum F{{V}_{t}}}\times 100\%$
where F represents the index of reliance on farmland for the expansion in area of construction land over a study period, with a higher value indicating greater reliance on conversion of farmland into new construction land. FvCt denotes the area of farmland converted into construction land. CvFt represents the amount area of construction land reconverted to farmland. ΣOVt is the area of other land types converted into construction land, and ΣFVt is the area of construction land converted into other land-use categories.

2.2.3 Grain-farmland elasticity coefficient (GFEC)

We used a grain-farmland elasticity coefficient (GFEC) to examine correlations between grain output and farmland area. GFEC is the ratio of the percentage change in grain output to the percentage change in farmland area over a given period of time (Zhou et al., 2009; Ge et al., 2017). The calculation formula of GFEC is:
$GFEC=\frac{G{{R}_{it}}}{F{{R}_{it}}}=\frac{\left[ \left( {{G}_{t2}}-{{G}_{t1}} \right)/{{G}_{t1}} \right]}{\left[ \left( {{F}_{t2}}-{{F}_{t1}} \right)/{{F}_{t1}} \right]}$
where GFEC is the grain-farmland elasticity coefficient for county i (the coupling relationship between fluctuations in grain output and variations in farmland area from period t1 to t2 in county i). GRit represents the rate of change in grain output in county i in year t. FRit is the rate of change in farmland area within county i in year t. Gt2 and Gt1 are the grain production values at the start and end of the study period, respectively. Ft2 and Ft1 represent the farmland area at the start and end of the study period, respectively.
To illustrate relationships between the coupling mode of farmland area and change in grain yield, we assumed that, without taking into account the multiple cropping index, grain output is affected by the both the extent of farmland and per unit area yield. Under current technical conditions, the productivity of each unit area in China increases year by year (NBS, 2019). When GFEC>0, grain production varies in the same direction as change in farmland area, and grain output is significantly affected by the extent of farmland. If FRit>0, both grain output and farmland area increase in the region, and the grain yield is affected by both farmland and yield per unit area (farmland area and grain yield per unit area leading pattern). If FRit<0, grain yield decreases in the region with decreased farmland area, and the decline in grain yield can be attributed to the reduction in available farmland area (farmland area leading pattern). When GFEC<0, grain production varies in the direction opposite the change in farmland area, and grain yield is notably affected by non-farmland factors. This means that the greater the absolute value of GFEC is, the stronger the impact of non-farmland area factors on grain production will be. In this situation, there are two possible scenarios for FRit. If FRit<0, grain yield could increase in the region where farmland reduced, and the increased grain yield is influenced by the productivity of each unit area (grain yield per unit area leading pattern). If FRit>0, grain yield could decrease in the region with increased farmland area, in the case of an increased grain yield per unit area and an expansion of farmland, and grain yield is impacted by other factors (other factors leading pattern), such as non-grain production expansion.

3 Results

3.1 Overall characteristics of farmland occupied by construction land

3.1.1 Characteristics of construction land and farmland changes

The overall area of construction land in China increased, and the rate of expansion accelerated, particularly in the country’s central and western regions (Figure 2). Between 2000 and 2020, the area of construction land increased by 10.86 million hectares (Mha), with 2.04 Mha of which occurring between 2000 and 2010. Since 2010, the expansion of construction land has accelerated significantly, increasing by 8.82 Mha from 2010-2020, at a rate 4.32 times that of the previous decade. Moreover, between 2000 and 2020 there was an increase in construction land in 98.61% of counties. The greatest expansion occurred mostly in central and western regions, especially in the Longhai-Lanxin Economic Belt, and the western part of the Yangtze River Economic Belt (where the average dynamic degree of construction land in 11 provinces and municipalities along its route (10.37%), exceeded the value calculated for the entire country). Expansion of urban areas within the Yangtze River Economic Belt was well documented (Guan et al., 2020; Zhong et al., 2020). A government decision to establish urban centers in the middle reaches of the Yangtze River and the Chengdu-Chongqing region in 2015 and 2016 led to formation of several city clusters, including the Yunnan central urban agglomeration, the Chengdu-Chongqing city cluster, and the central Guizhou urban agglomeration. As a result, there was a significant surge in the expansion of construction land in these regions.
Figure 2 Patterns of change in construction land of China between 2000 and 2020
From the perspective of farmland, the total area of China decreased, declining in southeastern region and increasing in northwestern region (Figure 3). Throughout China the total area of farmland has decreased by 3.48 Mha between 2000 and 2020. The rate of reduction between 2010 and 2020 was slower than that between 2000 and 2010; from 2000-2010 farmland decreased by 2.20 Mha and from 2010-2020 by 1.28 Mha. Farmland in 74.48% of counties decreased between 2000 and 2020. Declines in farmland occurred mainly in southeastern China, particularly in the Shandong Peninsula, and Yangtze River Delta and Pearl River Delta. Although the nationwide decrease in farmland area slowed down between 2010 and 2020, the reduction of farmland in the Shandong Peninsula, Yangtze River Delta and Pearl River Delta was more severe during this time compared with that between 2000 and 2010. In these areas, land occupied by secondary and tertiary industries placed considerable pressure on that for primary industries, resulting in an ongoing reduction in farmland (Ye et al., 2022). For example, in Zhejiang province in the Yangtze River Delta, the average dynamic degree of farmland over the past 20 years (-0.57%) was the lowest value for the country, equating to a reduction of 0.50 Mha of farmland. An increase in farmland areas occurred mostly in northwestern areas such as in Xinjiang, Qinghai, and northeastern Inner Mongolia (where the top 5% of counties with the highest increase mostly occurred).
Figure 3 Patterns of change in farmland of China between 2000 and 2020

3.1.2 Characteristics of construction land expansion dependent on farmland

The expansion of construction land mainly occurred at the expense of farmland, with regions in northern China more reliant on it than those in the south (Figure 4). The average proportion of farmland for construction land was 59.32% between 2000 and 2010, and for 43.46% of the counties (mostly in the North China Plain, Dongting Lake Plain and Jianghan Plain, and the Nanling region) the ratio of farmland converted into construction land exceeded 90%. The average ratio of farmland converted into construction land increased to 65.44% between 2010 and 2020, and for 54.31% of counties the ratio of farmland converted into construction land exceeded 90%. There was a shift in distribution towards the north and west compared to the previous decade, with the northern region expanding from the North China Plain northwards to the Northeast China Plain, westwards to the Loess Plateau, and even to the Gannan region. In the south, the Sichuan Basin replaced the Dongting Lake Plain, Jianghan Plain, and the Nanling region.
Figure 4 Average ratio of farmland converted into construction land in China

3.2 Relationship between fluctuations in farmland and variations in grain production

3.2.1 Patterns of grain yield change

The total grain yield in China increased, up in northern regions and down in southern regions (Figure 5). Total yield increased by 207 million tons between 2000 and 2020. Grain yield increased in 59.48% of counties, and elsewhere decreased. Areas where grain yield increased occurred in the Northeast China Plain, Inner Mongolia Plateau, North China Plain, Dongting Lake Plain, Poyang Lake Plain, and southwestern Yunnan-Guizhou Plateau. Of these, Inner Mongolia and Heilongjiang, at the top of the country, had average grain yield increases of 11.48% and 7.84%, respectively. In Fuyuan county (Heilongjiang province) the grain yield increased 21.47 times (836 million tons in 2000, and 17,945 million tons in 2020). Regions with declines in grain production occurred mainly along the southeastern coast. Among these areas, grain yield in Zhejiang province decreased the most from 2000-2020, with an average per county decrease of 38,700 tons.
Figure 5 Patterns of change in grain yield of China between 2000 and 2020

3.2.2 Relationships between fluctuations in farmland area and grain production

Growth in grain yield was not heavily reliant on increased farmland area. While grain yield along the southeastern coast and Sichuan Basin was affected by farmland area, in northwestern and southwestern regions, grain yield values were affected by both yield per unit area and farmland area, and grain output values in the North China Plain and Northeast China Plain were mainly affected by yield per unit area (Figures 6a-6c).
Figure 6 Relationship between fluctuations in farmland and grain production in China
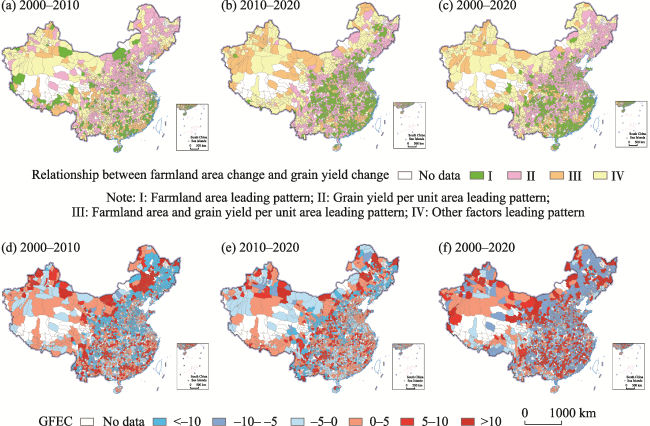
Regions with GFEC > 0 expanded from 2000 to 2020, and the proportion of counties with the same change in farmland area and grain yield increased from 45.07% between 2000 and 2010 to 54.26% between 2010 and 2020 (Figures 6d-6f). The number of counties with a farmland area leading pattern (grain yield and farmland both decreased, 
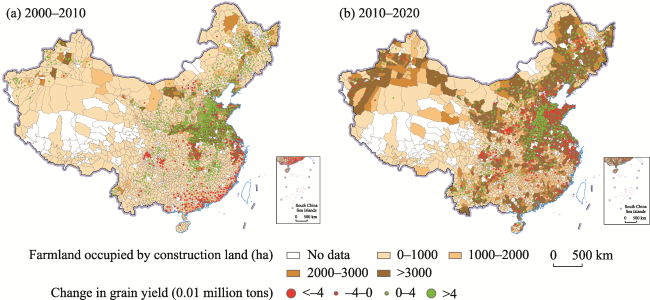
FRit <0) increased by 430, mainly in the southeastern coastal areas such as the Yangtze River Delta and Pearl River Delta, as well as the Sichuan Basin (Figures 6a-6c). For instance, in Guangdong province, counties with this pattern represented 89.77% of all counties. In these areas over the last two decades, economic development and construction land expansion continuously reduced the quality of farmland, and decreased the proportion of grain planting (Liu et al., 2014; Gao et al., 2019). The once famous land of rice and fish became the areas with the most serious reduction in grain production in China. The number of counties with a farmland area and grain yield per unit area leading pattern (grain yield and farmland increased together, FRit >0) decreased from 553 between 2000 and 2010 to 329 between 2010 and 2020. Decreases were mostly in the Inner Mongolia Plateau and the northwestern parts of Xinjiang and Yunnan (Figures 6a-6c), where grain production increased because of the expansion of farmland. Many counties with GFEC>0 were widely distributed (Figures 6a-6c). Among them, the number of counties with a grain yield per unit area leading pattern (grain yield increased while farmland decreased, FRit<0) was the greatest (to 970 over the study period), and most widely distributed, particularly in the Northeast China Plain and North China Plain (Figures 6d-6f). An increase in grain output can be a consequence of improved yield per unit area of farmland, which is closely related to agricultural technological progress, promotion of improved crop varieties, and improvements in farmland management technology (Feng et al., 2016; Liu et al., 2019). Moreover, although the area of farmland decreased in these regions, the total amount of original farmland remained large. Because the effect of grain yield reduction caused by farmland reduction was far less than that caused by yield per unit area increase, grain yield still increased. For example, the absolute value of GFEC in more than 65% of counties in Heilongjiang province exceeded 10, and farmland reduction had a weak impact on grain yield. There were fewer counties with other factors leading pattern (grain yield decreased while farmland increased, 
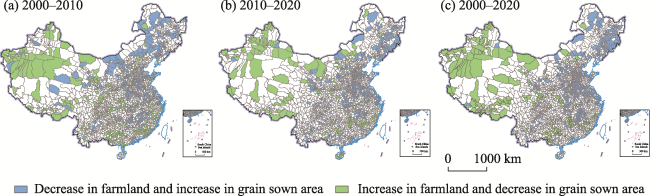
FRit >0), with only 209 between 2000 and 2020, sporadically distributed within Guangxi, Fujian, Hainan, Sichuan, Xizang and Xinjiang (Figures 6d-6f). In these regions, farmland increased, but grain production decreased for reasons partly related to local expansion in non-grain production. Farmland in these regions was used to plant vegetables, fruits, sugar and other economic crops. For example, in Liujiang county (Guangxi), statistics indicated that farmland area increased by 621.54 ha over the past 20 years, grain yield decreased by 124,100 tons, but vegetable and sugar cane production increased by 7.06 million tons and 7.49 million tons, respectively. Furthermore, regions might used low-quality farmland as a substitute for the loss of high-quality farmland when the government implemented a policy of balancing farmland requisition and compensation (Wang et al., 2017). Therefore, although the total area of farmland in such regions increased, grain production decreased.

3.3 Spatial relationship between encroachment of construction land on farmland and change in grain production

The classification color of farmland occupied by construction land was used as a base map, and a gradation drawing was prepared based on the change in grain yield. There was no obvious spatial coupling between the distribution of farmland converted into construction land and grain yield change in China (Figure 7). High coupling regions mainly occurred in the southeastern coastal areas and Sichuan Basin, such as in Guangdong, Zhejiang, Sichuan and Chongqing. These areas were characterized by a considerable amount of farmland having been converted into construction land, and an obvious reduction in grain yield. Between 2010 and 2020, this kind of region expanded to the Shandong Peninsula and both sides of the Hu Huanyong Line. However, other areas were non-coupled, especially in regions like the North China Plain and Northeast China Plain (e.g. in Henan and Jilin), where land used for construction increased, farmland area decreased, but grain output increased.
Figure 7 Spatial relationship between encroachment of construction land on farmland and change in grain production in China

4 Discussion

4.1 Comparison with previous studies

Existing research has shown that construction land in China continues to increase (Bai et al., 2012; Li et al., 2015), particularly in central and western regions of the country (Liu et al., 2020). Over 80% of this increase occurred at the expense of lost farmland (Zhou et al., 2020). The overall area of farmland decreased (Chien, 2015; Long et al., 2018), but it increased in the north and decreased in the south (Liu et al., 2021). The grain’s center of gravity shifted towards the north, and the grain yield decreased in the south (Wang et al., 2018; Liu et al., 2019; Yu et al., 2019). An increase in grain yield is driven by the improvements in farmland yield per unit area (Li et al., 2016; Liu et al., 2019; Liu et al., 2021). We reported that more counties have a grain yield per unit area leading pattern than any others. Both the per unit area yield and farmland area influence grain yield in northwestern regions, whereas in the North China Plain, grain yield is predominantly influenced by yield per unit area. This result aligns with studies of Feng et al. (2016) and Zheng et al. (2019), respectively. Grain yield along the southeastern coast of China and in Sichuan Basin is influenced by farmland area. Wang et al. (2017) also reported that grain production in the southeastern coast is highly sensitive to changes in farmland area.

4.2 Relationship between farmland converted to construction land and grain production

Although new construction land includes former farmland, we found no significant relationship between the conversion of farmland into construction land and grain yield. The expansion of construction did occupy a certain amount of farmland. With the addition of abandonment of farmland and ecological fallowing, farmland area continued to decrease. However, since 2000, China has continuously reclaimed new farmland and actively adjusted the agricultural planting structure, affecting food production. The construction occupation does not necessarily lead to a reduction in grain yield. This finding is basically consistent with the conclusions drawn by Wang et al. (2021) and Hou et al. (2022).
Relationships between the overall area of farmland converted into construction land and changes in farmland are complex. While considerable farmland was lost to construction land in certain regions in China, some regions experienced an increase in farmland area, particularly in northwestern China (Figure 3). Large areas of farmland were converted into construction land in these areas, which implies that other types of land in these areas were supplementing lost farmland. Farmland reclamation occurred in many parts of China in the past 20 years, with approximately 0.18 Mha of new farmland added to the northwest region (Shaanxi, Gansu, Qinghai, Ningxia, and Xinjiang). Between 2000 and 2010, the total area of farmland in China decreased by 2.20 Mha, with 3.21 Mha of farmland being converted into construction land. Between 2010 and 2020, the area of farmland in the country reduced a further 1.28 Mha, with 8.27 Mha of farmland being converted into construction land. While the amount of farmland converted into construction land has increased, the rate of reduction in farmland area decreased. Therefore, the area of farmland converted into construction land was greater than the area of lost farmland, and farmland was supplemented by other land types.
Relationships between changes in farmland area and grain sown area are also complex. A decrease in farmland area does not necessarily lead to a decrease in the area sown with grain; some regions increase the grain sown area by increasing the replanting index. The 596 counties and regions that experienced a decrease in farmland area but an increase in sown area from 2000 to 2020 occurred mainly in low mountainous and hilly areas of Changbai Mountains, Huaihe River Basin and Poyang Lake Plain (Figure 8). For example, 82 counties and districts in Henan province (e.g., Yushi and Lankao counties), and 46 counties in Jiangxi province (e.g., Nanchang, Xinjian, and Anyi counties) experienced a decrease in farmland area but an increase in grain sown area. Accordingly, adjustments in agricultural cropping structure led to changes in grain production by acting on grain sown area.
Figure 8 Relationship between changes in farmland and grain sown area of China
Most importantly, different farmers respond differently to decreases in grain sown area at the micro level. Some may continue to maintain previous production input, leading to a lower grain yield, but others may change the input of fertilizers, pesticides, and other productive material elements to improve the per unit area yield, and expand grain sown area by intercropping to maintain or increase grain yield. The expansion of construction land usually leads to urbanization, which increases rural farmland per capita (Satterthwaite et al., 2010; Wang et al., 2021). Urbanization promotes land to transfer to more efficient farmers by promoting relevant policies. This scale of operation improves grain yield per unit area (Chen et al., 2014). Thus, construction land expansion has a limited effect on food production.

4.3 Key factors affecting China’s grain production

Because the pattern of encroachment of construction land into farmland is not strongly related to changes in grain production, we sought to identify the key factors that affect China’s grain production. Grain yield is jointly influenced by grain yield per unit and grain sown area. According to the National Bureau of Statistics, China’s grain yield increased by 491.5% from 113.18 million tons in 1949 to 669.49 million tons in 2020. Grain yield per unit increased by 457.2% from 1029 kg/ha in 1949 to 5734 kg/ha in 2020. However, the grain sown area increased by only 6.2% from 11.00 Mha in 1949 to 11.68 Mha in 2020. This reveals that China’s growth in grain production is mainly influenced by grain yield per unit area, with grain sown area playing a minor role. We also reported that the number of counties with the grain yield per unit area leading pattern was the greatest in China. Several studies have shown that the unit area yield is closely related to factors such as quality seeds, irrigation, machinery, and chemical fertilizers (Cheng et al., 2007; Zhang et al., 2018; Wang, 2020).

4.4 Effectiveness of China’s farmland conservation policy

We demonstrated that the rate of farmland loss decreased between 2010-2020 compared with the previous decade, and that new farmland was reclaimed in the northwest of the country. We attribute this reduction to effective implementation of various policies designed to protect farmland. After the “1.8 billion mu red line of farmland” was initiated in 2006, the government proposed various policies to protect farmland. The “replenishment first and then farmland occupation” was implemented in 2009, and the building of “high-standard basic farmland” in 2011, followed by a proposal that “high-quality farmland should be supplemented when high-quality farmland is occupied”. Since the18th National Congress of the CPC (2012), a system to protect farmland has been gradually established. A core element of
this system is “control”, including permanent basic farmland protection, land consolidation, high standard farmland construction, and agricultural land conversion, and land expropriation as main parts. Land use control involves land survey registration, land use planning, and annual plan, farmland requisition-compensation balance, and land law enforcement supervision. Land tax, land conservation and intensive use, ecological environment protection, and other aspects of farmland protection policies are equally crucial for the preservation of farmland, especially for quality farmland protection.
We examined relationships between land gradient and the area of farmland converted into construction land (Figure 9). From 2010 to 2020, there was a shift towards increased gradient during the conversion. The proportion of farmland with a slope < 6° decreased, and that > 6° increased. The proportion of farmland converted into construction land between 6° and 15° rose by 9.42% between 2010 and 2020, higher than that over the previous decade. In general, farmland with a slope < 6° is of high quality. This observation reinforces the effectiveness of protection policies to control the conversion of high-quality farmland into construction land.
Figure 9 Relationship between slope and area of farmland occupied by construction land expansion

5 Conclusions

We revealed patterns in the change of construction land, farmland and grain yield, as well as spatial relationships between them in China. Between 2000 and 2020, the area of construction land increased by 10.86 Mha. Rapid expansion occurred mainly in central and western regions of China, specifically in the Longhai-Lanxin Economic Belt and western part of the Yangtze River Economic Belt. The area of farmland decreased by 3.48 Mha between 2000 and 2020, primarily driven by southeastern region, and in northwestern region it increased. The expansion in area of construction land mostly occurred at the expense of farmland (on average, and the ratio of farmland converted into construction land was 62.38%). The increased area of construction land in northern China, such as the Northeast China Plain and North China Plain, and the Loess Plateau, occurred mainly at the expense of farmland. Grain yield has increased by 207 million tons since 2000. Grain yield increased in the Northeast China Plain, North China Plain, Dongting Lake Plain, and Poyang Lake Plain, and southwestern Yunnan-Guizhou Plateau and Inner Mongolia Plateau, while it decreased along the southeastern coast. Grain yield increase was weakly dependent on farmland area. There was no apparent spatial correlation between the distribution of farmland converted into construction land and the changes in grain yield across China. High-coupling regions occurred mostly in the southeastern coastal areas, Sichuan Basin, Shandong Peninsula and on both sides of the Hu Huanyong Line, where large areas of farmland were converted into construction land and there was an obvious reduction in grain yield. In contrast, in areas where no coupling was apparent, specifically, in Henan and Jilin provinces, considerable farmland was converted into construction land, but grain yield increased.

6 Policy implications

Throughout China, except southeastern coastal areas, Sichuan Basin, Shandong Peninsula, and both sides of the Hu Huanyong Line, spatial coupling between the distribution of farmland converted into construction land and changes in grain yield are not obvious. For regions where the degree of coupling between the distribution of farmland converted into construction land and grain yield changes is high, the scale and intensity of farmland conversion into construction land must be controlled. For regions such as the southeastern coastal areas and the Shandong Peninsula, urban-rural land use planning must be implemented, and conversion of farmland into construction land must be managed. For regions where the degree of coupling is not high, such as the hilly region west of Henan province, the Huaihe River Basin and the Poyang Lake Plain, attention must be given to the role of economic development in subsidizing agriculture, increasing investment in science and technology and financial support for agriculture, and deepening “supply-side” agricultural reform. This approach will turn the relative advantage of grain production into economic advantages, which not only ensure grain output but also promote economic development.
Expansion in the area of construction land occurs mostly at the expense of farmland. Therefore, it is important to strengthen the rigid constraints of the “three lines” during urban development and regulate expansion of new construction land. Emphasis should be placed on converting existing urban and rural land instead of expanding construction areas into farming land. Additionally, we reported a trend for new construction land to occur on land with an increased gradient. Many cities have developed low hills and gentle slopes to resolve the limited supply of land. More rapid expansion in the area of construction land occurs mainly in central and western regions of China, such as the western part of the Yangtze River Economic Belt (e.g., Sichuan, Yunnan, and Guizhou), where many cities are built on mountainous terrain. Development without planning constraint increases the risk of geological disasters and threatens regional ecology. For major agricultural production regions and key ecological function areas, it is of importance to assess the appropriateness of developing land on low hills and on more gradual slopes.
We reported that an expansion in the area of farmland occurs mostly in northwestern China, including Xinjiang, Qinghai, and northeastern Inner Mongolia. Influenced by natural factors such as moisture, soil, sunlight, and heat, the southern region experienced a greater loss in quality farmland than the northwest region (Li et al., 2018). Increases in grain production capacity brought by increased farmland area in the northwest cannot compensate for decreased grain production capacity caused by reduced farmland area in the south. Additionally, the expansion of farmland in the northwest region easily leads to a reduction in ecological land such as forests and grasslands, posing an increased risk of land degradation. Therefore, these regions need to change focus on farmland management and control to consider grain production capacity and ecological security.
The expansion in the area of land for construction leads to urbanization and industrialization. We solely explored the influence of construction land increase on farmland and grain production, with a specific focus on land urbanization. Urbanization and industrialization involve reforms in social structure and the spread of culture, which impact the use and quality of farmland and agricultural production. Therefore, future analyses could examine the effects of urbanization and industrialization to better understand relationships between increased construction land and agricultural production. Additionally, many other factors (e.g., changes in farmland, climate fluctuation, changing agricultural structure and policies) also affect grain production, and we plan to examine them in the future.
[1]
Bai X M, Chen J, Shi P J, 2012. Landscape urbanization and economic growth in China: Positive feedbacks and sustainability dilemmas. Environmental Science & Technology, 46: 132-139.

[2]
Bren D A, Reitsma F, Baiocchi G et al., 2017. Future urban land expansion and implications for global croplands. Proceedings of the National Academy of Sciences of the United States of America, 114(34): 8939-8944.

DOI PMID

[3]
Cao Y, Zhang X L, 2018. Are they satisfied with land taking? Aspects on procedural fairness, monetary compensation and behavioral simulation in China’s land expropriation story. Land Use Policy, 74: 166-178.

[4]
Chen H L, Shi Q H, Gu H Q, 2014. Is the transfer of land from farmers efficient? Take Shanxi as an example. Chinese Rural Economy, (7): 61-71. (in Chinese)

[5]
Cheng Y Q, Zhang P Y, Zhang H M, 2007. Variation character of grain yield per unit area in main grain-producing area of Northeast China. Chinese Geographical Science, 17(2): 110-116.

[6]
Chien S S, 2015. Local farmland loss and preservation in China: A perspective of quota territorialization. Land Use Policy, 49: 65-74.

[7]
Deng X Z, Huang J K, Rozelle S, et al. 2015. Impact of urbanization on cultivated land changes in China. Land Use Policy, 45: 1-7.

[8]
Feng Z M, Sun T, Yang Y Z, 2016. Study on the spatiotemporal patterns and contribution factors of China’s grain output increase during 2003-2013. Journal of Natural Resources, 31(6): 895-907. (in Chinese)

[9]
Fu J Y, Gao Q, Jiang D et al., 2023. Spatial-temporal distribution of global production-living-ecological space during the period 2000-2020. Scientific Data, 10: 589.

DOI PMID

[10]
Gao J, Neill B C, 2020. Mapping global urban land for the 21st century with data-driven simulations and shared socioeconomic path ways. Nature Communications, 11: 2302.

[11]
Gao X Y, Cheng W M, Wang N et al., 2019. Spatio-temporal distribution and transformation of cropland in geomorphologic regions of China during 1990-2015. Journal of Geographical Sciences, 29(2): 180-196.

DOI

[12]
Ge D Z, Long H L, Zhang Y N et al., 2017. Pattern and coupling relationship between grain yield and agricultural labor changes at county level in China. Acta Geographica Sinica, 72(6): 1063-1077. (in Chinese)

DOI

[13]
Guan D J, He X J, He C Y et al., 2020. Does the urban sprawl matter in Yangtze River Economic Belt, China? An integrated analysis with urban sprawl index and one scenario analysis model. Cities, 99: 102611.

[14]
Hou M Y, Deng Y J, Yao S B, 2022. Coordinated relationship between urbanization and grain production in China: Degree measurement, spatial differentiation and its factors detection. Journal of Cleaner Production, 331: 129957.

[15]
Li H, Wei Y H, Liao F L et al., 2015. Administrative hierarchy and urban land expansion in transitional China. Applied Geography, 56: 177-186.

[16]
Li T X, Baležentis T, Cao L J et al., 2016. Are the changes in China’s grain production sustainable: Extensive and intensive development by the LMDI approach. Sustainability, 8: 1198.

[17]
Li Y Y, Li X B, Tan M H et al., 2018. The impact of cultivated land spatial shift on food crop production in China, 1990-2010. Land Degradation & Development, 29: 1652-1659.

[18]
Liu J Y, Kuang W H, Zhang Z X et al., 2014. Spatiotemporal characteristics, patterns, and causes of land-use changes in China since the late 1980s. Journal of Geographical Sciences, 24(2): 195-210.

[19]
Liu S C, Ye Y M, Zhong S Q, 2020. Research on shift route of gravity center and decoupling relationship between urban land expansion and economic growth in China. Resources and Environment in the Yangtze Basin, 29(12): 2563-2571. (in Chinese)

[20]
Liu X Q, Liu Y S, Liu Z J et al., 2021. Impacts of climatic warming on cropping system borders of China and potential adaptation strategies for regional agriculture development. Science of the Total Environment, 755: 142415.

[21]
Liu Y, Zhang F R, Xie Z et al., 2019. Evolution of spatio-temporal characteristics of grain production in China from the perspective of arable land use. Journal of China Agricultural University, 24(11): 173-182. (in Chinese)

[22]
Liu Z J, Liu Y S, Li Y R, 2019. Extended warm temperate zone and opportunities for cropping system change in the Loess Plateau of China. International Journal of Climatology, 39: 658-669.

[23]
Long H L, Ge D Z, Zhang Y N et al., 2018. Changing man-land interrelations in China’s farming area under urbanization and its implications for food security. Journal of Environmental Management, 209: 440-451.

[24]
Lu J, Li B, Li H et al., 2021. Expansion of city scale, traffic modes, traffic congestion, and air pollution. Cities, 108: 102974.

[25]
Mascarenhas A, Haase D, Ramos T B et al., 2019. Pathways of demographic and urban development and their effects on land take and ecosystem services: The case of Lisbon Metropolitan Area, Portugal. Land Use Policy, 82: 181-194.

DOI

[26]
National Bureau of Statistics (NBS), 2019. China Statistical Yearbook. Beijing: China Statistics Press. (in Chinese)

[27]
Ning J, Liu J Y, Kuang W H et al., 2018. Spatiotemporal patterns and characteristics of land-use change in China during 2010-2015. Journal of Geographical Sciences, 28(5): 547-562.

DOI

[28]
Pandey B, Seto K C, 2015. Urbanization and agricultural land loss in India: Comparing satellite estimates with census data. Journal of Environmental Management, 148: 53-66.

DOI PMID

[29]
Satterthwaite D, McGranahan G, Tacoli C, 2010. Urbanization and its implications for food and farming. Philosophical Transactions of the Royal Society, 365: 2809-2820.

[30]
Tan M H, Li X B, Lv C H, 2004. The expansion of construction land and its occupation of cultivated land in large and medium cities in China in the 1990s. Science in China Series D: Earth Sciences, 34(12): 1157-1165. (in Chinese)

[31]
Wang H G, 2020. China’s Food Security Strategy and Countermeasures. Beijing: CITIC Press Group, 59-60. (in Chinese)

[32]
Wang J Y, Xin L J, 2017. Spatial-temporal variations of cultivated land and grain production in China based on GlobeLand30. Transactions of the Chinese Society of Agricultural Engineering, 33(22): 1-8. (in Chinese)

[33]
Wang J Y, Zhang Z W, Liu Y S, 2018. Spatial shifts in grain production increases in China and implications for food security. Land Use Policy, 74: 204-213.

[34]
Wang S T, Bai X M, Zhang X L et al., 2021. Urbanization can benefit agricultural production with large-scale farming in China. Nature Food, 2: 183-191.

DOI PMID

[35]
Wang Y K, Zhao H, Peter H, 2019. Study on the procedure of land requisition from the perspective of protecting peasants’ rights and interest: Taking five construction projects in Hebei province as an example. Chinese Journal of Agricultural Resources and Regional Planning, 40(4): 161-171. (in Chinese)

[36]
Ye S J, Ren S Y, Song C Q et al., 2022. Spatial patterns of county-level arable land productive-capacity and its coordination with land-use intensity in mainland of China. Agriculture, Ecosystems and Environment, 326: 107757.

[37]
Yu X, Sun J X, Sun S K et al., 2019. A comprehensive analysis of regional grain production characteristics in China from the scale and efficiency perspectives. Journal of Cleaner Production, 212: 610-621.

[38]
Zhang L G, Bao B F, Dong L, 2018. Spatial and temporal pattern evolution of grain yield and spatial heterogeneity of driving factors in Poyang Lake Eco-Economic Zone. Economic Geography, 38(2): 154-161. (in Chinese)

[39]
Zheng Y N, Zhang F R, Xie Z et al., 2019. Research on spatial-temporal evolution of grain production and sustainable use of cultivated land in China. World Regional Studies, 28(6): 120-131. (in Chinese)

DOI

[40]
Zhong Y, Lin A W, He L J et al., 2020. Spatiotemporal dynamics and driving forces of urban land-use expansion: A case study of the Yangtze River Economic Belt, China. Remote Sensing, 12: 287.

[41]
Zhou B B, Aggarwal R, Wu J G et al., 2021. Urbanization-associated farmland loss: A macro-micro comparative study in China. Land Use Policy, 101: 105228.

[42]
Zhou B B, Lv L G, 2020. Understanding the dynamics of farmland loss in a rapidly urbanizing region: A problem-driven, diagnostic approach to landscape sustainability. Landscape Ecology, 35: 2471-2486.

[43]
Zhou J, Long H L, 2009. The variation of farmland use and the security pattern of grain production in China since 1978. Journal of Natural Resources, 24(8): 1366-1377. (in Chinese)

DOI

Outlines

/