
Journal of Geographical Sciences >
The coupling coordination of social and economic upgrading in China: Evolution, regional disparities and influencing factors
|
Huang Gengzhi, PhD and Professor, specialized in urban and social geographies. E-mail: hgzhi3@mail.sysu.edu.cn |
Received date: 2023-08-15
Accepted date: 2024-02-07
Online published: 2024-05-31
Supported by
National Natural Science Foundation of China(42122007)
National Natural Science Foundation of China(41930646)
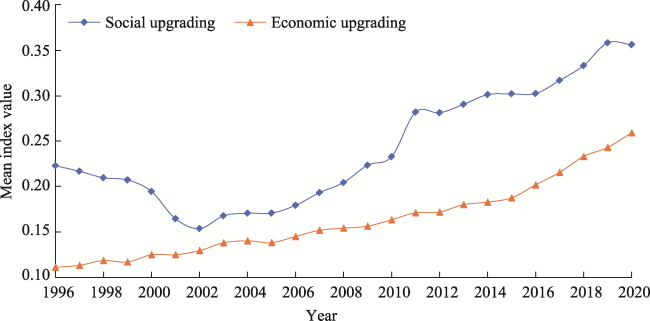
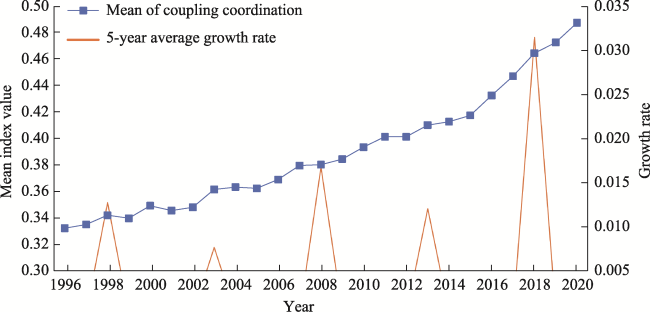
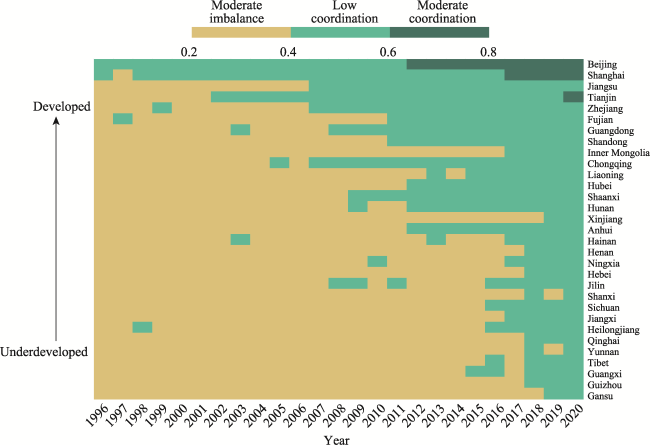
Social upgrading does not inherently follow economic upgrading; rather, they present a complex interplay. This paper, focusing on China, utilizes the coupling coordination degree and a panel regression model to shed light on the intricate interaction between social upgrading and economic upgrading. It is found that the coupling coordination degree of social and economic upgrading in China has improved from 0.33 to 0.49 since the mid-1990s, undergoing a shift from a stage of slight imbalance to low-level coordination. However, significant regional disparities are present in terms of economic upgrading, social upgrading, and their coupling coordination degree. Developed areas exhibit a higher degree of coupling coordination compared to less developed regions, indicating a connection between the coupling coordination degree and the level of economic growth. Economic globalization, public governance, and the legal environment positively impact the coupling coordination between social and economic upgrading, while economic privatization and corporate violations of law exert negative effects. The paper concludes with policy discussions for enhancing the coupling coordination between social and economic upgrading.
HUANG Gengzhi , LIU Shuyi , CAI Bowei , WANG Bo . The coupling coordination of social and economic upgrading in China: Evolution, regional disparities and influencing factors[J]. Journal of Geographical Sciences, 2024 , 34(5) : 835 -854 . DOI: 10.1007/s11442-024-2229-8
Table 1 Measurement of economic upgrading |
| Primary indicators | Secondary indicators | Proxy variables | Influence direction | Weight |
|---|---|---|---|---|
| Economic structure | Change rate | Lilien coefficient | + | 0.1006 |
| Industrial upgrading | Industrial structure sophistication index | + | 0.0809 | |
| (Value added of tertiary industry/value added of secondary industry) | ||||
| Economic efficiency | Outcome conversion | Profits from industrial enterprises above designated size/main business income | + | 0.0501 |
| Quality benefit | Social labor productivity | + | 0.1123 | |
| Economic innovation | R&D investment | R&D expenditure/GDP | + | 0.1088 |
| R&D outputs | Granted invention patent applications/R&D expenditure | + | 0.1003 | |
| Innovation environment | Per capita technology market transaction value | + | 0.2847 | |
| Innovation efficiency | New product sales income from industrial enterprises above designated size/main business income | + | 0.1154 | |
| Economic growth | Output growth | Per capita GDP growth | + | 0.0470 |
Table 2 Measurement of social upgrading |
| Primary indicators | Secondary indicators | Proxy variables | Influence direction | Weight |
|---|---|---|---|---|
| Labor employment | Job opportunities | Current job openings registered by businesses | + | 0.1419 |
| Unemployment rate | Unemployment rate | - | 0.0449 | |
| Remunerated employment | Average salary of urban employees | + | 0.1253 | |
| Social security | Social security | Medical insurance coverage rate | + | 0.1367 |
| Basic rights | Access to education | Proportion of employed individuals with a college degree or above | + | 0.0954 |
| Gender equality | Proportion of female workers | + | 0.0787 | |
| Union participation | Ratio of union membership to total employment | + | 0.0568 | |
| Social dialogue | Negotiation and consultation | Success rate of labor dispute arbitrations | + | 0.0580 |
| Union role | Success rate of dispute mediations involving unions | + | 0.1287 | |
| Economic democracy | Number of implemented rational suggestions | + | 0.1335 |
Table 3 Degree of coupling coordination between economic upgrading and social upgrading |
| Coupling coordination degree | Division of developmental stages |
|---|---|
| (0, 0.2] | Severe imbalance |
| (0.2, 0.4] | Moderate imbalance |
| (0.4, 0.6] | Low coordination |
| (0.6, 0.8] | Moderate coordination |
| (0.8, 1] | Advanced coordination |
Figure 1 The flux in the indices for social and economic upgrading |
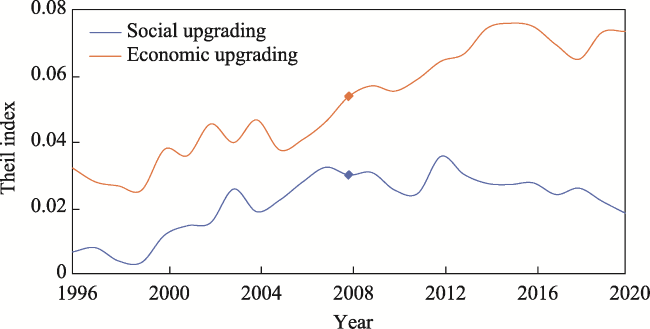
Figure 2 Disparities in social and economic upgrading across regions |
Figure 3 Evolution of the degree of coupling coordination between social and economic upgrading |
Figure 4 Regional disparities in the coupling coordination between social upgrading and economic upgrading |
Table 4 Descriptive statistics for variables in regression model |
| Regression variables | Measurement indicators | Mean | Median | Maximum | Minimum | Variance | Sample size |
|---|---|---|---|---|---|---|---|
| Level of coupling coordination (D) | Degree of coupling coordination | 0.390 | 0.374 | 0.735 | 0.270 | 0.071 | 775 |
| Economic privatization (NSTAT) | Index of non-state economy’s share in industrial sales | 5.951 | 5.731 | 12.796 | -0.270 | 3.427 | 775 |
| Economic globalization (ln(pIFDI)) | Logarithm of per capita foreign direct investment | 8.739 | 8.614 | 14.442 | 4.019 | 1.456 | 775 |
| Government governance (ln(pFE)) | Logarithm of per capita fiscal expenditure | 8.082 | 8.372 | 11.013 | 3.000 | 1.501 | 775 |
| Legal environment (LAW) | Index of development of market intermediaries and the legal system environment | 4.934 | 3.790 | 14.297 | -0.736 | 3.315 | 775 |
| Corporate violations (FP_GDP) | Ratio of fines and forfeitures in fiscal revenue to GDP | 0.003 | 0.003 | 0.007 | 0.001 | 0.001 | 775 |
Table 5 Results of unit root test |
| Variable | LLC | ADF | Stationarity state | ||
|---|---|---|---|---|---|
| Statistic | P-value | Statistic | P-value | ||
| D | -4.04 | 0.00 | 101.59 | 0.00 | Stationary |
| ΔD | -25.55 | 0.00 | 568.60 | 0.00 | Stationary |
| NSTAT | -3.69 | 0.00 | 56.06 | 0.69 | Non-stationary |
| ΔNSTAT | -18.55 | 0.00 | 380.90 | 0.00 | Stationary |
| ln(pIFDI) | 0.67 | 0.75 | 104.92 | 0.00 | Non-stationary |
| Δln(pIFDI) | -14.60 | 0.00 | 382.42 | 0.00 | Stationary |
| ln(pFE) | -14.45 | 0.00 | 333.73 | 0.00 | Stationary |
| Δln(pFE) | -8.25 | 0.00 | 186.25 | 0.00 | Stationary |
| LAW | -5.80 | 0.00 | 120.25 | 0.00 | Stationary |
| ΔLAW | -16.36 | 0.00 | 373.77 | 0.00 | Stationary |
| FP_GDP | -2.90 | 0.00 | 113.82 | 0.00 | Stationary |
| ΔFP_GDP | -15.25 | 0.00 | 375.33 | 0.00 | Stationary |
Table 6 Results of panel cointegration test |
| Methodology | KAO ADF- Statistic | Pedroni | |||
|---|---|---|---|---|---|
| Panel PP-Statistic | Panel ADF-Statistic | Group PP-Statistic | Group ADF-Statistic | ||
| Statistic | -6.88 | -8.20 | -8.06 | -12.50 | -9.14 |
| P-value | 0.00 | 0.00 | 0.00 | 0.00 | 0.00 |
| Result | Reject the null hypothesis | ||||
Table 7 Results of panel regression |
| Dependent variable | Model 1 OLS | Model 2 FE | Model 3 FGLS |
|---|---|---|---|
| NSTAT | -0.004*** | -0.005*** | -0.004*** |
| ln(pIFDI) | 0.018*** | 0.020*** | 0.019*** |
| ln(pFE) | 0.008*** | 0.010*** | 0.007*** |
| LAW | 0.012*** | 0.010*** | 0.010*** |
| FP_GDP | -4.641*** | -4.350*** | -1.402 |
| Constant | 0.140*** | 0.132*** | 0.144*** |
| N | 775 | 775 | 775 |
| R2 | 0.797 | 0.876 | 0.875 |
| Adjusted-R2 | 0.796 | 0.870 | 0.869 |
| F-test | 603.20*** | 149.28*** | 147.27*** |
Note: *, **, and *** represent significance levels of 10%, 5%, and 1%, respectively. |
| [1] |
|
| [2] |
|
| [3] |
|
| [4] |
|
| [5] |
|
| [6] |
|
| [7] |
|
| [8] |
|
| [9] |
|
| [10] |
|
| [11] |
|
| [12] |
|
| [13] |
|
| [14] |
|
| [15] |
|
| [16] |
|
| [17] |
|
| [18] |
|
| [19] |
|
| [20] |
|
| [21] |
|
| [22] |
|
| [23] |
|
| [24] |
|
| [25] |
|
| [26] |
|
| [27] |
|
| [28] |
|
| [29] |
|
| [30] |
|
| [31] |
|
| [32] |
|
| [33] |
|
| [34] |
|
| [35] |
|
| [36] |
|
| [37] |
|
| [38] |
|
| [39] |
|
| [40] |
|
| [41] |
|
| [42] |
|
| [43] |
|
| [44] |
|
| [45] |
|
| [46] |
|
| [47] |
|
| [48] |
|
| [49] |
|
| [50] |
|
| [51] |
|
| [52] |
|
| [53] |
|
| [54] |
|
| [55] |
|
| [56] |
|
/
| 〈 |
|
〉 |