
Journal of Geographical Sciences >
Network and mechanism of China’s new energy vehicle industry from the perspective of value chain
This paper is initially published in Acta Geographica Sinica (Chinese edition), 2023, 78(12): 3018‒3036.
|
He Yao, PhD Candidate, specialized in urban and regional development planning. E-mail: heyao1116@163.com |
Received date: 2023-12-09
Accepted date: 2024-01-20
Online published: 2024-04-24
Supported by
National Natural Science Foundation of China(41971198)
The Second Tibetan Plateau Scientific Expedition and Research Program(2019QZKK1005)
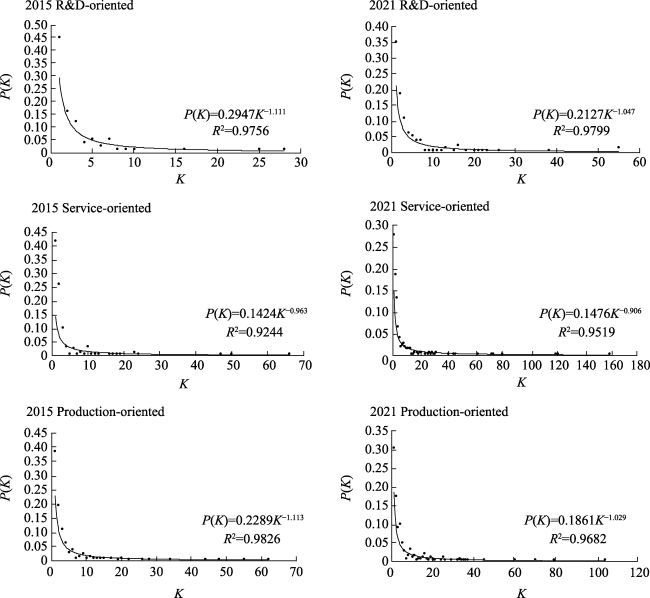
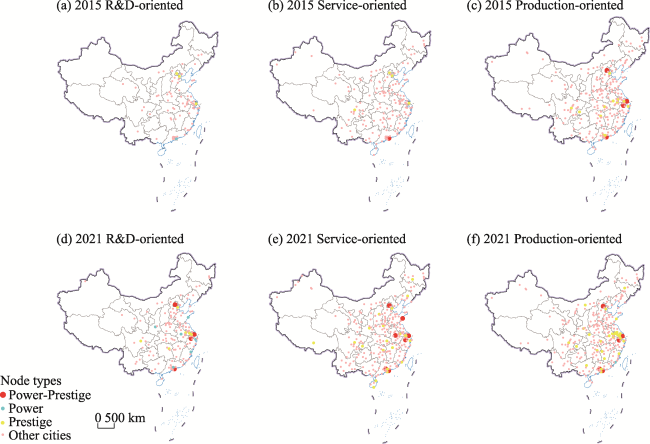
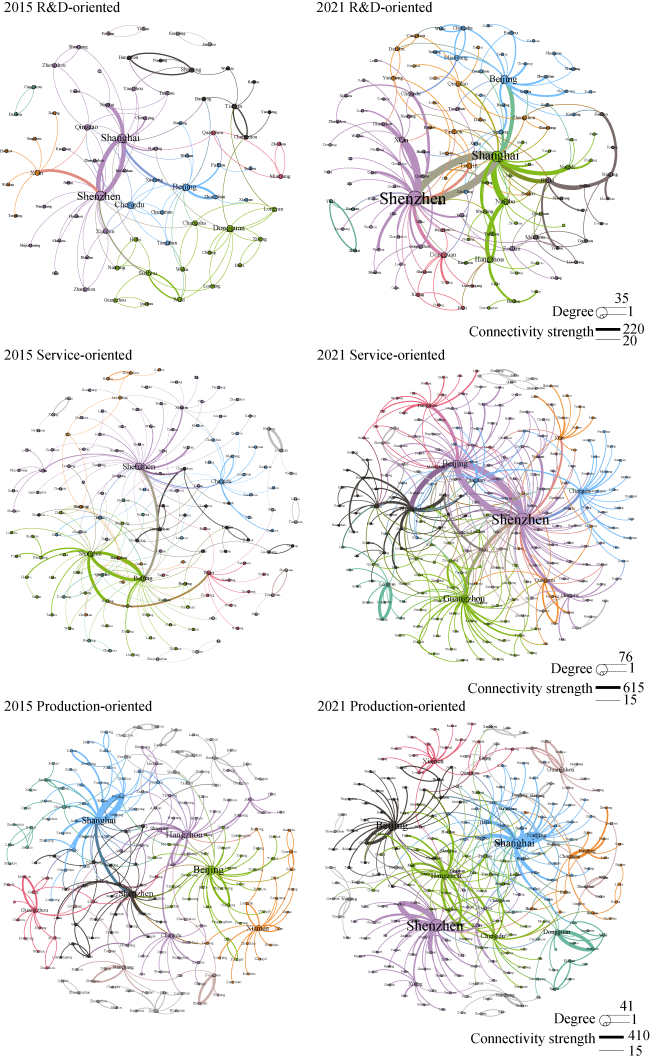
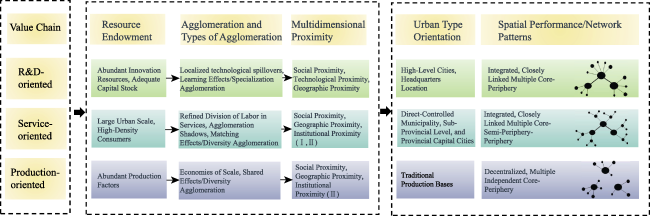
Based on the data of listed companies in the core industry chain of China's new energy vehicles in 2015 and 2021, this paper constructs their industrial network from the perspective of the value chain, and uses methods such as social network and negative binomial regression model to study the characteristics, evolution, differences, and formation mechanisms of different value chain networks. The results show that: (1) R&D-oriented, production-oriented, and service-oriented networks share several common features: These networks are simultaneously expanding in scale and transitioning towards more efficient “small world” network; The degree distribution in these networks follows a power-law distribution, indicating a scale-free network structure; There is a decrease in the power-law exponent of network’s degree distribution, indicating an increase in network heterogeneity. Furthermore, there is a significant positive correlation between the degrees of nodes in networks with diverse value chains, suggesting that the same node holds a similar level of significance across different networks. (2) The number of power-prestige, power and prestige nodes increases in the networks of all value chain segments, except in the service-oriented network, where there are no power nodes. In each value chain network, these nodes have different agglomeration directions: In R&D-oriented network, the nodes tend to cluster around headquarters and high-level cities. In contrast, service-oriented network shows a concentration of nodes in municipalities, sub-provincial and provincial capitals. Similarly, production-oriented network demonstrates a clustering of nodes in traditional production bases. (3) Different value-added segments of industry form different types of agglomeration in pursuit of different factor endowments and agglomeration effect, and form the spatial structure of the strongest connection industrial network with different characteristics. The R&D-oriented networks have always been an integrated and closely connected multiple core-periphery structure community with the influence of social, technological and geographical proximities; Transformation of service-oriented network from an integrated and closely connected multiple core-periphery structure community to a multiple core-semi-periphery-periphery structure community with the influence of social, geographical and institutional proximities; Transformation of production-oriented network from the partially integrated and localized core-periphery structure community to the more decentralized multiple independent core-periphery structure community with the influence of the social, institutional of administrative boundaries and geographical proximities.
HE Yao , YANG Yongchun , WANG Shaobo . Network and mechanism of China’s new energy vehicle industry from the perspective of value chain[J]. Journal of Geographical Sciences, 2024 , 34(4) : 779 -803 . DOI: 10.1007/s11442-024-2227-x
Figure 1 Degree distribution of China’s new energy vehicle industry network from the perspective of value chain in 2015 and 2021 |
Table 1 Evolution of node types in China’s new energy vehicle industry network from the perspective of value chain |
| Year Type | 2015 | 2021 | ||||
|---|---|---|---|---|---|---|
| R&D- oriented | Service- oriented | Production- oriented | R&D- oriented | Service- oriented | Production- oriented | |
| Power-Prestige | Shenzhen | Shanghai, Beijing, Shenzhen, Hangzhou | Shanghai, Shenzhen, Beijing, Hangzhou | Shanghai, Shenzhen, Beijing, Guangzhou, Hangzhou, Qingdao, Hefei | Shenzhen, Beijing, Shanghai, Hangzhou, Guangzhou | |
| Power | Shenzhen | Hefei, Ningbo, Dongguan, Qingdao, Xi’an, Ningde | Xiamen | |||
| Prestige | Shanghai, Beijing, Tianjin | Shanghai, Beijing, Tianjin, Chengdu | Guangzhou, Tianjin, Suzhou, Wuhan, Hefei, Ningbo, Chengdu, Chongqing, Wuhu, Changsha, Nanjing, Dongguan | Tianjin, Chengdu, Suzhou, Nanjing, Changzhou, Wuxi, Changsha | Chengdu, Suzhou, Haikou, Wuhan, Chongqing, Tianjin, Nanjing, Xi’an, Xiamen, Ningbo, Sanya, Zhengzhou, Wuxi, Taiyuan, Shenyang, Changsha, Zhuhai, Dongguan, Harbin, Lasa, Nanchang | Nanjing, Dongguan, Hefei, Chengdu, Ningbo, Xi’an, Chongqing, Suzhou, Tianjin, Wuhan,Changsha, Wuhu, Yichun, Jiaxing, Nantong, Wuxi, Chuzhou, Changchun, Liuzhou, Zhenjiang, Changzhou, Qingdao, Baotou, Taizhou, Yangzhou, Ganzhou, Shiyan, Ningde, Zhuhai |
Note: Classification criteria for levels: Research-oriented networks, high-level in-degree (8-36), low-level in-degree (0-7), high-level out-degree (10-40), low-level out-degree (0-9); Service-oriented networks, high-level in-degree (10-40), low-level in-degree (0-9), high-level out-degree (33-124), low-level out-degree (0-32); Production-oriented networks, high-level in-degree (7-18), low-level in-degree (0-6), high-level out-degree (28-90), low-level out-degree (0-27). |
Figure 2 Distribution and evolution of node types in China’s new energy vehicle industry network in 2015 and 2021Note: Based on the standard map production with the approval number GS (2019) 1815 on the standard map service website of the Ministry of Natural Resources, the boundary of the base map has not been modified |
Figure 3 The evolution of China’s new energy vehicle industry network structure based on the strongest connection in 2015 and 2021 |
Figure 4 The Formation mechanism of the network structure of China’s new energy vehicle industry from the perspective of value chain |
Table 2 Regression results of multidimensional proximity mechanism in China’s new energy vehicle industry network from the perspective of value chain |
| Variable | Model 1 R&D | Model 2 Production | Model 3 Service | Variable | Model 1 R&D | Model 2 Production | Model 3 Service |
|---|---|---|---|---|---|---|---|
| Geoij | 0.0851016** | 0.1028103*** | 0.0610812** | Gdpij | 0.0014708*** | 0.0008793** | 0.0008893*** |
| (0.0365204) | (0.0332531) | (0.0309952) | (0.0005832) | (0.0004873) | (0.0004504) | ||
| Socij | 1.329344*** | 1.699106*** | 1.744836*** | Patij/Popij | 0.0000146** | 0.0004679*** | 0.0005694*** |
| (0.4147179) | (0.3668167) | (0.2370462) | (0.00000463) | (0.000085) | (0.0000679) | ||
| Tecij | 0.2277579** | -0.05579 | 0.121154 | Cons | 2.513486*** | 2.292235*** | 1.999777*** |
| (0.1062781) | (0.1089859) | (0.1586508) | (0.1472295) | (0.1332833) | (0.1844383) | ||
| InsijI | 0.013834 | 0.046011 | 0.1607244*** | α | 0.21133 | 0.377051 | 0.372476 |
| (0.0347458) | (0.0322685) | (0.0266826) | Log likelihood | -1256.93 | -3193.46 | -3817.34 | |
| InsijII | -0.04883 | 0.186526** | 0.4449469*** | ||||
| (0.1109177) | (0.0885989) | (0.0865728) |
Note: The variance inflation factors (VIF) for Models 1-3 are all below the critical value of 10, indicating no multicollinearity among explanatory variables. Values in parentheses represent standard errors. *, *, and *** denote p<0.10, p<0.05, and p<0.01, respectively. |
| [1] |
|
| [2] |
|
| [3] |
|
| [4] |
|
| [5] |
|
| [6] |
|
| [7] |
|
| [8] |
|
| [9] |
|
| [10] |
|
| [11] |
|
| [12] |
|
| [13] |
|
| [14] |
|
| [15] |
|
| [16] |
|
| [17] |
|
| [18] |
|
| [19] |
|
| [20] |
|
| [21] |
|
| [22] |
|
| [23] |
|
| [24] |
|
| [25] |
|
| [26] |
|
| [27] |
|
| [28] |
|
| [29] |
|
| [30] |
|
| [31] |
|
| [32] |
|
| [33] |
|
| [34] |
|
| [35] |
|
| [36] |
|
| [37] |
|
| [38] |
|
| [39] |
|
| [40] |
|
| [41] |
|
| [42] |
|
| [43] |
|
| [44] |
|
| [45] |
|
| [46] |
|
| [47] |
|
| [48] |
|
| [49] |
|
| [50] |
|
| [51] |
|
| [52] |
|
| [53] |
|
| [54] |
|
| [55] |
|
| [56] |
|
| [57] |
|
| [58] |
|
| [59] |
|
| [60] |
|
| [61] |
|
| [62] |
|
/
| 〈 |
|
〉 |