Research Articles

Comprehensive evaluation of newly cultivated land sustainable utilization at project scale: A case study in Guangdong, China

  • GUO Chang , 1, 2 ,
  • JIN Xiaobin , 1, 2, 3, * ,
  • YANG Xuhong 1, 2, 3 ,
  • XU Weiyi 1, 2 ,
  • SUN Rui 1, 2 ,
  • ZHOU Yinkang 1, 2, 3
Expand
  • 1. School of Geography and Ocean Science, Nanjing University, Nanjing 210023, China
  • 2. Key Laboratory of Coastal Zone Exploitation and Protection, Ministry of Land and Resources, Nanjing 210023, China
  • 3. Jiangsu Land Development and Consolidation Technology Engineering Center, Nanjing 210023, China
* Jin Xiaobin, PhD and Professor, specialized in land use planning and management. E-mail:

Guo Chang, specialized in sustainable land use. E-mail:

Received date: 2023-07-19

  Accepted date: 2024-01-04

  Online published: 2024-04-24

Supported by

National Natural Science Foundation of China(42271259)

Abstract

Cultivated land plays a pivotal role in ensuring national food security, particularly in populous nations like China, where substantial investments are made to develop cultivated land as a counterbalance to construction-occupied areas. Consequently, long-term, effective monitoring of the utilization of newly cultivated land becomes imperative. This study introduces a comprehensive monitoring framework, designed for refined scales, that leverages remote sensing data. The framework focuses on the sustainable utilization of newly cultivated land, emphasizing utilization sustainability, productivity stability, and landscape integration. Its effectiveness was validated through a case study in Guangdong province, China. The results revealed satisfactory utilization sustainability and improved productivity stability of newly cultivated land in Guangdong, though landscape integration showed sub-optimal results. Furthermore, the comprehensive evaluation categorized the newly cultivated land into three levels and eight types. The study recommends enhancing the site selection process for newly cultivated land and improving the long-term monitoring, as well as incentive and constraint mechanisms, for their utilization. This study can provide a scientific reference to bolster the implementation of cultivated land protection policies, thereby contributing significantly to high-quality economic and social development.

Cite this article

GUO Chang , JIN Xiaobin , YANG Xuhong , XU Weiyi , SUN Rui , ZHOU Yinkang . Comprehensive evaluation of newly cultivated land sustainable utilization at project scale: A case study in Guangdong, China[J]. Journal of Geographical Sciences, 2024 , 34(4) : 745 -762 . DOI: 10.1007/s11442-024-2225-z

1 Introduction

Cultivated land serves as the cornerstone for food production, underpinning sustainable economic and societal growth (Tan and Li, 2019; Zhou et al., 2019). In recent decades, the global trend of rapidly converting highly productive farmland to development land has raised concerns among policymakers and conservation organizations worldwide (Foley et al., 2005; Seto and Ramankutty, 2016; Bren d’Amour et al., 2017; van Vliet, 2019; Malakoff and Nolte, 2023). This issue is particularly acute in China, where a large population, limited land resources, and rapid urbanization collide (He et al., 2016). Balancing economic development with the protection of cultivated land and meeting the escalating demand for food has emerged as a critical research area (Deng et al., 2006; Liu et al., 2015).
In response to the challenge of losing cultivated land and ensuring food security, the Chinese government, since the late 1990s, has enforced the “requisition-compensation balance” policy (Qie et al., 2023). This policy aims to maintain a dynamic equilibrium of total cultivated land nationwide (Lichtenberg and Ding, 2008). Its fundamental principle dictates that if non-agricultural construction requires the use of cultivated land, upon authorization, the entities utilizing the land must provide an equivalent amount of cultivated land, both in quantity and quality, as compensation (Liu et al., 2022). Consequently, China has executed over 200,000 projects, generating substantial amounts of newly cultivated land to offset the loss due to development (Dang et al., 2022). Significant human and financial resources have been allocated towards these endeavors. Nonetheless, the efficacy of the “requisition-compensation balance” policy and the utilization of the newly cultivated land remain subjects of debate. While it is generally acknowledged that this policy aids in preserving cultivated land to a certain degree (Zhou et al., 2021), issues such as “occupy the superior land but compensate with the inferior” and “exploitation without cultivation” have arisen in some regions (Su et al., 2019). These practices lead to reduced productivity on the cultivated land and ecological degradation (Tan et al., 2020; Kang et al., 2021; Ye et al., 2022). Thus, conducting a comprehensive and effective evaluation of the utilization of newly cultivated land holds significant theoretical and practical relevance.
Existing research on newly cultivated land primarily focuses on aspects like quantity (Wei et al., 2022; Liu et al., 2023), productivity (Chen et al., 2019, 2022), and ecological consequences (Liu et al., 2019; Zheng et al., 2022). It has been observed that while the volume of newly cultivated land nationally approximates the area of cultivated land lost to development, discrepancies arise at provincial or municipal levels (Fan et al., 2022; Liu et al., 2023). In some regions, the newly cultivated land area is insufficient to compensate for the land lost. Additionally, the productivity of newly cultivated land is often found to be lower than that of the land it replaces, a trend identified in multiple areas (Song and Pijanowski, 2014; Shen et al., 2017). Ecologically, the development of new agricultural areas frequently results in significant reductions in grassland and forest land, consequently leading to various ecological and environmental issues (Zhang et al., 2019; Kuang et al., 2022). Regarding study scales and data sources, most research has been conducted at the administrative level, relying on statistical data (Tan et al., 2020). In contrast, there are limited studies utilizing remote sensing data to monitor the utilization of newly cultivated land. Furthermore, evaluations of newly cultivated land utilization have generally been from a singular perspective, lacking a comprehensive assessment. The specifics of newly cultivated land use tend to be obscured, as most such land in China arises from land consolidation projects, which are often small and dispersed due to regional resource constraints and economic considerations (Liu and Wang, 2019). Moreover, cultivated land uses are subject to dynamic changes influenced by national policy directives and individual farmers’ decisions, characterized by multiple objectives and uncertainty (Alexander et al., 2017). Studies based on statistical data struggle to provide effective evaluation over extended periods, hence failing to accurately depict the ongoing process of newly cultivated land utilization.
This paper aims to introduce a novel methodology for conducting a comprehensive evaluation of the long-term utilization of newly cultivated land at the project level. Initially, an assessment framework is developed, integrating utilization sustainability, productivity stability, and landscape integration of newly cultivated land, utilizing remote sensing data. This framework is then applied in a case study to quantitatively evaluate and analyze the utilization of newly cultivated land in Guangdong province. As one of China’s most socio-economically developed provinces, Guangdong has experienced rapid economic growth, leading to extensive construction land expansion and cultivated land encroachment, thereby heightening the need for newly cultivated land through land consolidation. Based on the quantitative findings, this study proposes recommendations for monitoring the utilization of newly cultivated land and refining the “requisition-compensation balance” policy.
The structure of this paper is organized as follows: Section 2 details the evaluation of newly cultivated land utilization, including the study area and data processing methods. Section 3 presents the empirical results. Section 4 delves into the interpretation of these findings, comparison with previous studies, suggestions for cultivated land management, and addresses the study’s limitations. Finally, Section 5 summarizes the conclusions drawn from this research.

2 Research methods and data sources

2.1 Evaluation framework

The “requisition-compensation balance” policy, aiming for no net loss of cultivated land, underscores the importance of quantity, quality, and ecological considerations in preventing ecological deterioration and managing the costs associated with land occupation (Song et al., 2012). This policy necessitates that newly cultivated land is utilized sustainably, meets productivity requirements, and harmoniously integrates with surrounding ecological landscapes. This study proposes an evaluation based on a “utilization sustainability-productivity stability-landscape integration” framework (Figure 1).
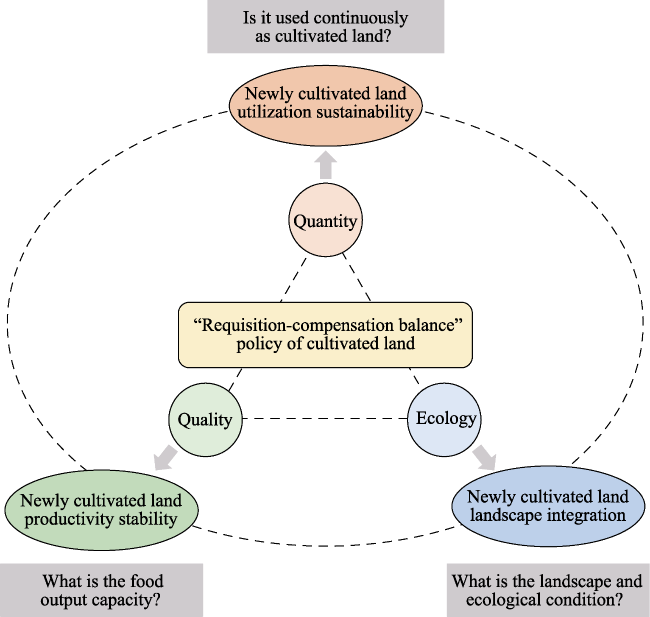
Figure 1 Research framework of newly cultivated land utilization evaluation
Utilization sustainability forms the cornerstone of this evaluation (Lu et al., 2021). Given the constraints of natural resources and utilization capacities, arable reserve resources are predominantly found in locations with sub-optimal agricultural production conditions. Concurrently, issues such as ecological constraints and ownership disputes often lead to the non-use or abandonment of newly cultivated land in these areas. Particularly in the context of current efforts to prevent the decline in cultivated land, utilization sustainability emerges as a key objective in the evaluation of newly cultivated land.
Secondly, productivity stability is intricately linked with food security (Yang and Li, 2000; Yang et al., 2022). With population growth and changes in dietary preferences, food demand will also increase. Ensuring consistent food production and security represents a major strategic issue in national economic development, social stability, and self-sufficiency (Zhao et al., 2018). Yet, newly cultivated land often resides in areas characterized by sub-optimal water and heat resources, location, topography, and overall poor agricultural production conditions, resulting in productivity uncertainties. Hence, it is crucial to assess the productivity and stability of newly cultivated land.
Thirdly, landscape integration plays a vital role in the stability and sustainability of newly cultivated land (Bai et al., 2022; Wang Y et al., 2023). Agricultural development in these areas must carefully balance food production with ecological protection (Wang X et al., 2023). Some newly cultivated lands are located at a significant distance from existing cultivated areas. This often leads to a stark contrast with the surrounding ecological environment, causing landscape fragmentation, diminished risk resistance, and reduced recuperative capacity (Sun et al., 2014; Zhang et al., 2021), all of which are detrimental to the sustainable development of cultivated land. The quality of the ecological environment and the concentration of cultivated land can, to an extent, indicate the stability of the cultivated land ecosystem. This forms an essential criterion for evaluating the protection and quality improvement of cultivated land (Wang et al., 2018). Consequently, landscape integration should also be considered a key indicator in the evaluation of newly cultivated land utilization.

2.2 Construction of the evaluation index system

2.2.1 Utilization sustainability calculation

The comprehensive index of land use effectively illustrates regional land use changes by grading various land use types (Zhu and Li, 2003). This study employed the cumulative value of this comprehensive index to indicate the trend of land use change in case areas, thereby reflecting the utilization sustainability of newly cultivated land. Based on existing research, land use extent is quantifiable, considering the defined limits of land use. The upper limit signifies the peak of land resource utilization, beyond which human development and further utilization are generally unfeasible. Conversely, the lower limit represents the commencement of human development and the utilization of land resources (Zhuang and Liu, 1997).
In addressing the utilization characteristics of newly cultivated land, land use types are categorized into 4 grades (Table 1). Here, cultivated land is considered the baseline for development and utilization, assigned a value of 1. Impervious land, marking the upper limit of development and utilization, is assigned a value of 4. The higher the grading index of a particular land use type, the more challenging it is to transform this land into cultivated land. The formula is as follows:
${{F}_{1}}=\sum\limits_{k=1}^{p}{\frac{\sum\limits_{j=1}^{m}{\sum\limits_{i=1}^{n}{{{A}_{i}}\times {{C}_{ijk}}}}}{m}}$
where F1 denotes the utilization sustainability index; p represents the number of stages in the land consolidation life cycle experienced by the case area; m is the number of years in a specific stage of the life cycle; n is the grading index of land use types, ranging from 1 to 4 based on the difficulty of converting each type into cultivated land; Ai is the grading index for the i-th land use type in the region; and Cijk is the proportion of the i-th land use type area in the case area during the j-th year of the k-th stage.
Table 1 Land use type and corresponding grading index
Land use type Grading index Land use type Grading index
Cultivated land 1 Water 3
Forest or shrub 2 Impervious land 4
During the stationary phase of land consolidation, a utilization sustainability index closer to 4 indicates that the land type in the case area closely resembles cultivated land, signifying superior utilization sustainability of the newly cultivated land.

2.2.2 Productivity stability quantification

Remote sensing data, particularly the Enhanced Vegetation Index (EVI), are instrumental in assessing crop yields (Muruganantham et al., 2022). This study constructs a productivity stability index using EVI, dividing it into productivity status and fluctuation indexes. The average EVI is used to calculate the productivity status index for each stage of the land consolidation life cycle, representing the grain yield productivity of the case area. Meanwhile, the productivity fluctuation index, derived from the standard deviation of EVI during each life cycle stage, indicates the variability of grain output in the case area. The calculation formulas are as follows:
${{F}_{2}}=\frac{\underset{i=1}{\overset{n}{\mathop{\mathop{\sum }^{}}}}\,{{\left( \frac{\underset{j=1}{\overset{m}{\mathop{\mathop{\sum }^{}}}}\,EV{{I}_{j}}}{m} \right)}_{i}}}{n}$
${{F}_{3}}=\sqrt{\frac{\underset{i=1}{\overset{n}{\mathop{\mathop{\sum }^{}}}}\,{{\left[ {{\left( \frac{\underset{j=1}{\overset{m}{\mathop{\mathop{\sum }^{}}}}\,EV{{I}_{j}}}{m} \right)}_{i}}-{{F}_{2}} \right]}^{2}}}{n-1}}$
where F2 denotes the productivity state index; F3 denotes the productivity fluctuation index; n denotes the count of remote sensing images; m denotes the number of grids covered by the project area in remote sensing images; EVIj denotes the EVI value of the j-th gird.

2.2.3 Landscape integration assessment

The Remote Sensing Ecological Index (RSEI), incorporating greenness, humidity, dryness, and heat index, is extensively utilized for evaluating regional environmental quality (Huang et al., 2021; Liao et al., 2022). In this study, the landscape integration index is based on RSEI, and is divided into an ecological coordination index and a cultivated land contiguity index. The environmental coordination index is computed through the disparity between the RSEI of the case area and its buffer zone, reflecting the harmonization of ecological environment quality. The cultivated land contiguity index is calculated by the proportion of cultivated land in the buffer zone, depicting the concentration and continuity of newly cultivated land in relation to existing cultivated land in surrounding areas. The formulas are expressed as follows:
${{F}_{4}}=\left| \frac{\underset{i=1}{\overset{n}{\mathop{\mathop{\sum }^{}}}}\,RSE{{I}_{ci}}}{n}-\frac{\underset{i=1}{\overset{m}{\mathop{\mathop{\sum }^{}}}}\,RSE{{I}_{bi}}}{m} \right|$
where F4 represents the environmental coordination index; n and m represent the number of grids in the case and buffer areas, respectively; RSEIci and RSEIbi represent the RSEI of the i-th grid in the case and buffer areas, respectively.
The RSEI is determined as follows:
$RSE{{I}_{0}}=PAC[f(NDVI,Wet,NDSI,LST)]$
$RSEI=\left( RSE{{I}_{0}}-RSE{{I}_{min}} \right)/\left( RSE{{I}_{max}}-RSE{{I}_{min}} \right)$
where RSEI0 represents the initial remote sensing ecological index, PAC refers to the principal component analysis, and RSEI is the standardized remote sensing ecological index (RSEI). NDVI, Wet, NDSI and LST represent the greenness, humidity, dryness, and heat indices, respectively.
The cropland contiguity index is computed as follows:
${{F}_{5}}=\frac{{{s}_{c}}}{{{s}_{b}}}$
where F5 represents the cropland contiguity index, sc represents the cultivated area within the buffer zone, and sb represents the total area of the buffer zone.
A lower environmental coordination index signifies a minimal difference in ecological quality between the project and buffer zones, indicating better environmental harmony. Conversely, a higher cultivated land contiguity index indicates a larger proportion of cultivated land in the buffer zone, suggesting enhanced contiguity between newly cultivated and existing cultivated land.

2.3 Comprehensive evaluation

To conduct a thorough evaluation of newly cultivated land utilization, this study employs a three-dimensional spatial coordinate system, representing three key utilization dimensions: utilization sustainability (x-axis), productivity stability (y-axis), and landscape integration (z-axis) (Li et al., 2022). Specifically, this study categorizes these dimensions into three levels: low (L), medium (M), and high (H). The grading criteria are as follows:
(1) During the stationary period, the study area is segmented into three tiers based on the utilization sustainability index, utilizing the natural break-point method to categorize from low to high.
(2) In the stationary period, the productivity status index and productivity fluctuation index are classified into high and low levels. The study area is then divided into three grades based on these indices’ characteristics (Table 2).
Table 2 Grades of the productivity stability index
Characteristics of index Grade
High productivity status index and low productivity fluctuation index High
High productivity status index and high productivity fluctuation index Medium
Low productivity status index and high or low productivity fluctuation index Low
(3) Similarly, during the stationary period, the environmental coordination index and the cultivated land contiguity index are split into high and low categories. The study area is then grouped into three grades according to the combined characteristics of these two indexes (Table 3).
Table 3 Grades of landscape integration index
Characteristics of index Grade
High or low environmental coordination index and high cultivated land contiguity index High
Low environmental coordination index and low cultivated land contiguity index Medium
High environmental coordination index and low cultivated land contiguity index Low
This study aggregates these 27 combinations to optimize within-group homogeneity and delineates the study area into three levels and eight types. The categorization is visually represented in Figures 2 and 3.
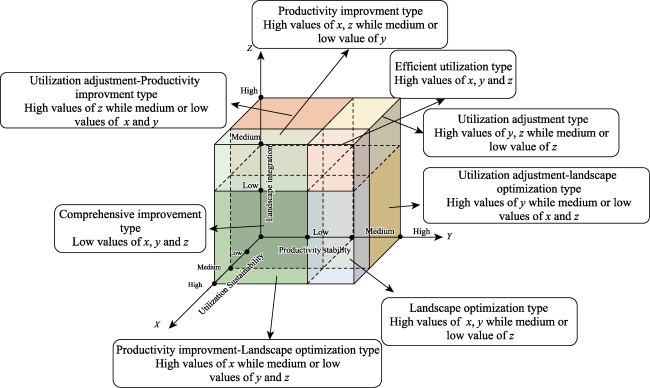
Figure 2 The conceptual model of utilization types of newly cultivated land. The red, green, and blue solid lines represent x (Utilization sustainability), y (Productivity stability), and z (Landscape integration), respectively.
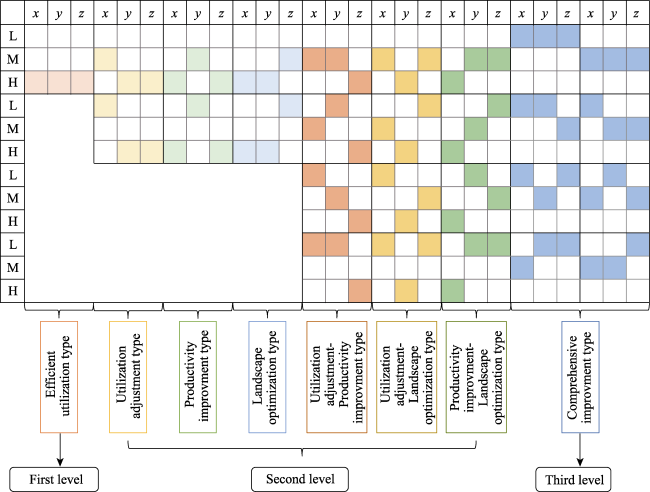
Figure 3 The combinations and classification criteria of the three dimensions of newly cultivated land utilization evaluation. This study defined utilization sustainability as x, productivity stability as y, and landscape integration as z. L is the abbreviation of low, M is medium, and H is high. Each thick black box represents a combination type.

2.4 Study area

Guangdong province, situated in southern China, spans from 20°13ʹ-25°31ʹN and 109°39ʹ-117°19ʹE. Characterized by a subtropical and tropical monsoon climate, it enjoys long summers and plentiful rainfall, making it one of China’s regions richest in light, heat, and water resources. The province’s topography is elevated in the north, descending towards lower elevations in the south, with the northern part predominantly mountainous and hilly, while the southern region consists mainly of plains and tablelands. Geographically and economically, Guangdong is divided into several distinct areas: the Mountainous Areas, the East Wing, the West Wing, and the Pearl River Delta (PRD). The PRD, in particular, stands out as an economically advanced area, contributing significantly to the province’s GDP (RMB 10.08 trillion in 2021, accounting for 80.5% of Guangdong’s total GDP) and hosting a major portion of the population (62.0% of Guangdong’s total population). In contrast, the Mountainous Areas, the East Wing, and the West Wing exhibit relatively slower development. Over the past 15 years, Guangdong has experienced considerable expansion in construction land along with rapid economic growth. Specifically, the built-up area in the PRD has expanded from 2875.55 km2 to 4741.69 km2 with cultivated land occupation reaching 437.69 km2. Recently, there has been a continuous decline in cultivated land within the province, with the per capita cultivated land measuring only 226.67 m2, merely one-fourth of the national average. Consequently, this places immense pressure on Guangdong’s natural resource capacity and the protection of arable land.

2.5 Data sources and processing

The study utilized land consolidation data from the Monitoring and Supervision System of Rural Land Consolidation, which included detailed statistics on project location, approval and acceptance dates, total construction scale, and newly cultivated land area. Additionally, land use data were extracted from a dataset developed by Yang et al. (2021), based on Landsat remote sensing images with a 30-m spatial resolution. Remote sensing data were sourced from the MOD09A1, MOD11A2, and MOD13Q1 datasets of the MODIS product series, encompassing surface reflectance, temperature, and vegetation index data with respective spatial resolutions of 500 m, 1000 m, and 250 m and temporal resolutions of 8 and 16 days. A total of 448 remote sensing images, spanning from 2002 to 2018, were analyzed in this research.
To accurately represent the evolution and dynamics of newly cultivated land utilization, this study segmented land consolidation projects into four distinct phases: pre-construction, construction, recovery, and stationary (Guan et al., 2014). The timeline of each phase was determined using the year of project approval and acceptance as benchmarks: the 3 years preceding the approval year were categorized as the pre-construction period, the span from approval to acceptance as the construction period, the following 3 years as the recovery period, and the subsequent 3 years as the stationary period. From the initial dataset, data for land consolidation projects in Guangdong, approved between 2008 and 2012, were selected. Owing to spatial resolution constraints in remote sensing imagery, only projects exceeding 1 km² were included. Criteria for selection also included projects where the actual newly cultivated land area constituted over 50% of the total construction scale. The selected case areas ranged from 1.00 to 5.25 km2, totaling 176.61 km2. Control areas were established 1 km outside the boundaries of these case areas, sharing similar meteorological conditions, crop types, planting systems, and field management methods with the case areas. The geographic distribution of the case areas within Guangdong and their relation to the larger region are depicted in Figure 4.
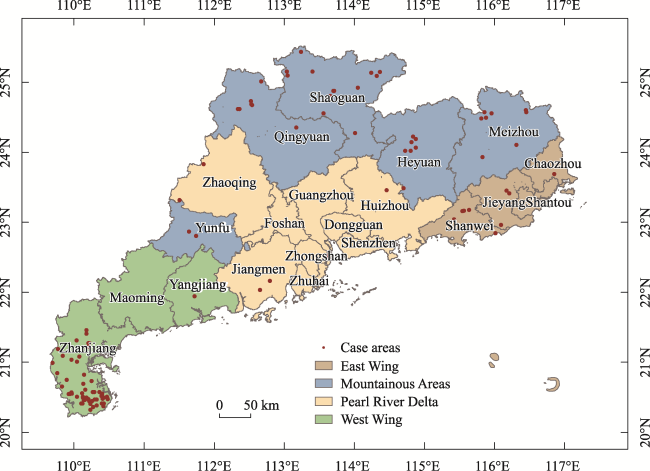
Figure 4 Administrative divisions of Guangdong province and location of the case areas

3 Results

3.1 Utilization sustainability of newly cultivated land

Figure 5 illustrates the utilization sustainability index throughout the entire life-cycle of land consolidation in the selected case areas. This index indicates a favorable trend in the utilization sustainability of newly cultivated land in Guangdong. As land consolidation projects progress, the extent of land used for cultivation gradually increases. However, some areas remain underutilized for agricultural purposes. During the pre-construction phase, the utilization sustainability index in case areas primarily ranged between 1.05 and 2.03, reflecting a homogeneity in initial land uses, predominantly cultivated land, forests, and shrub-lands. In the stationary phase, the index varied more significantly, spanning from 4.22 to 7.72 across different case areas. This variation suggests a marked increase in land use diversity as land consolidation progressed.
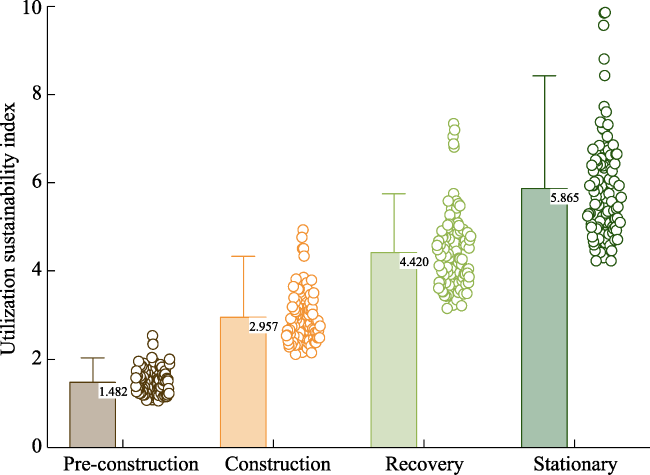
Figure 5 Results of utilization sustainability index
Throughout the consolidation process, the median utilization sustainability index of each case area gradually rose across the four phases—pre-construction, construction, recovery, and stationary—with corresponding values of 1.482, 2.957, 4.420, and 5.865. However, the growth rate exhibited a gradual decline, with incremental increases of 1.475, 1.463, and 1.445, respectively. Employing the natural break-point method for classification based on the index values during the stationary period, the findings (depicted in Figure 8a) reveal that high sustainability index case areas, accounting for 49.55% of the total, were predominantly situated in the West Wing. Conversely, the East Wing and Mountainous Areas had fewer areas with high utilization sustainability indices. Medium utilization sustainability index case areas constituted 43.24%, dispersed throughout the region. Case areas with a low utilization sustainability index, representing only 7.21%, were comparatively fewer and did not exhibit distinct spatial distribution characteristics due to their limited number.

3.2 Productivity stability of newly cultivated land

The productivity stability index of newly cultivated land, as depicted in Figure 6, reveals that land consolidation leads to an increasing trend in the productivity status index and a decreasing trend in the productivity fluctuation index. The median productivity status index in the case areas increased from 0.352 in the pre-construction phase to 0.351 during construction, further improved to 0.364 in the recovery phase, and reached 0.369 in the stationary phase, indicating enhanced output levels. Conversely, the median productivity fluctuation index, initially at 10.162 in the pre-construction phase, decreased to 9.641 in the construction phase, rose to 10.233 in the recovery phase, and finally declined to 8.893 in the stationary phase. This significant reduction from the pre-construction phase demonstrates increased stability in output capability in the case areas. Overall, the productivity stability of the newly cultivated land in the study area has shown improvement, with a continuing upward trend over time.
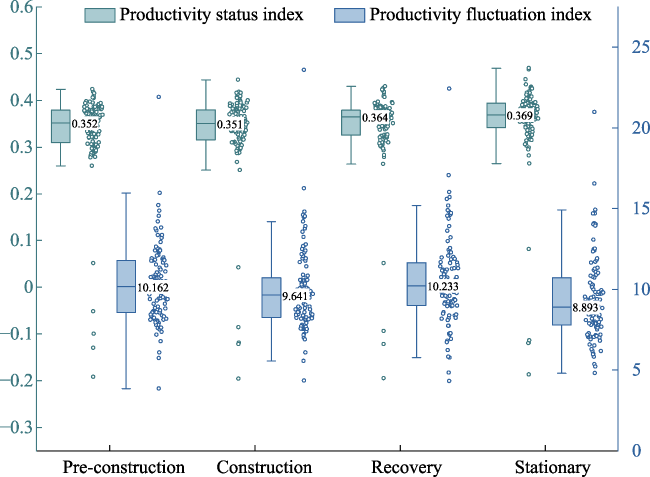
Figure 6 Results of productivity stability index
The case areas were classified using the natural break-point method, and the findings are presented in Figure 8b. Areas with a high productivity stability index, constituting 70.27% of the total, were predominantly found in the West and East Wings, displaying clear spatial clustering. Areas with a medium productivity stability index, accounting for 26.13%, were primarily located in the Mountainous Areas, with fewer in the West Wing. Only 3.6% of areas demonstrated a low productivity stability index, not exhibiting significant spatial distribution patterns due to their limited number.

3.3 Landscape integration of newly cultivated land

The results of the landscape integration index are presented in Figure 7. These results indicate a significant increase in the environmental coordination index in the study area, while the cultivated land contiguity index initially decreases, then rises, and eventually stabilizes. During the initial three phases of land consolidation, the environmental coordination index was consistently low with a narrow inter-quartile range, signifying minor differences in ecological and environmental quality between the case areas and their buffer zones. In the latter phase, a notable increase in the environmental coordination index was observed, coupled with an expanded inter-quartile range. This suggests substantial variations in the ecological environment quality between the case area and buffer zone, with pronounced differences in environmental coordination among the case areas. The median cultivated land contiguity index was recorded at 0.643 and 0.625 during the pre-construction and construction periods, respectively, and increased to 0.685 and 0.681 in the recovery and stationary periods. This reflects a marginal enhancement in the contiguity of cultivated land. Overall, there has been a significant increase in the disparity in ecological environment quality between the newly cultivated land and the surrounding areas in the study area and a slight improvement in the continuity of the cultivated land.
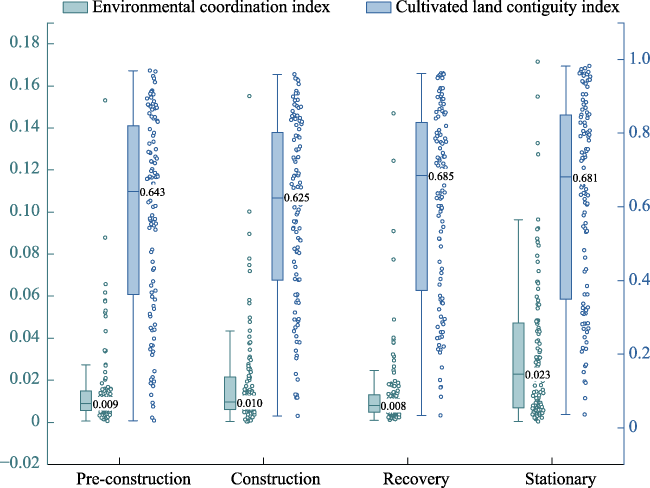
Figure 7 Results of landscape integration index
Utilizing the natural break-point method for classifying the case areas, as shown in Figure 8c, it is observed that 66.67% of the case areas with a high landscape integration index are primarily located in the West Wing, with fewer occurrences in the East Wing and Mountainous Areas. A mere 5.41% of the case areas possess a medium landscape integration index, showing no distinct spatial distribution due to their limited number. The proportion of case areas with a low landscape integration index stands at 27.92%, predominantly in the Eastern Wing and the Mountainous Areas.
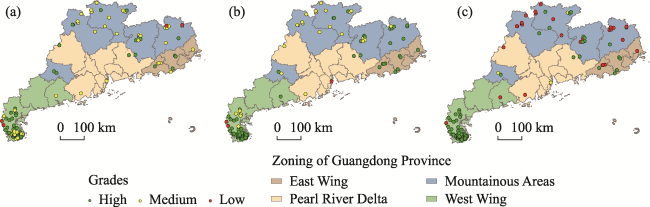
Figure 8 Spatial characteristics of utilization sustainability index (a), productivity stability index (b) and landscape integration index (c) in Guangdong province

3.4 Comprehensive evaluation of newly cultivated land

Variations in utilization sustainability, productivity stability, and landscape integration have led to different types of case areas emerging from the same newly cultivated land characteristics, as illustrated in Figure 9. The principal attributes of newly cultivated land utilization are outlined below:
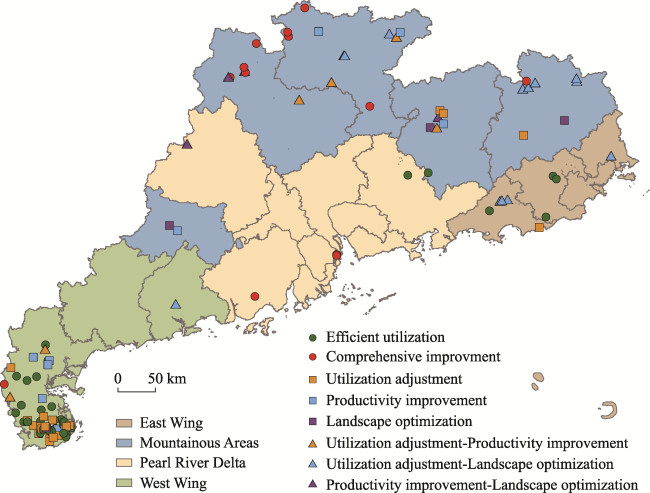
Figure 9 Comprehensive evaluation and classification of newly cultivated land in Guangdong province
(1) The first level of newly cultivated land utilization encompasses the efficient utilization type, constituting 35.19% of the total case areas. This category is characterized by high levels of utilization sustainability, productivity stability, and landscape integration. It aligns with the “requisition-compensation balance” policy and practical requirements. Spatially, these projects are predominantly located in the West Wing.
(2) The second level of newly cultivated land utilization is characterized by six types: utilization adjustment, productivity improvement, landscape optimization, utilization adjustment-productivity improvement, utilization adjustment-landscape optimization, and productivity improvement-landscape optimization. At this level, newly cultivated lands exhibit at least one of the three dimensions—utilization sustainability, productivity stability, or landscape integration—at a high level, while the remaining dimensions range from medium to low. This level accounts for 45.77% of the case areas. Specifically, utilization adjustment case areas, making up 19.44%, are primarily located in the West Wing. The productivity improvement case areas, constituting 8.33%, are found mostly in the West Wing and Mountainous Areas. Both landscape optimization and utilization adjustment-productivity improvement case areas, representing 3.70% and 5.56% of the total, respectively, do not show distinct spatial distribution patterns. Case areas categorized under utilization adjustment-landscape optimization, comprising 12.04%, are predominantly in the Mountainous Areas and East Wing. Finally, productivity improvement-landscape optimization case areas, accounting for 3.70%, are largely situated in the Mountainous Areas.
(3) The third level of newly cultivated land utilization includes the comprehensive improvement type, which constitutes 12.04% of the total case areas. In this category, newly cultivated land displays relatively low levels of utilization sustainability, productivity stability, and landscape integration. Spatially, these lands are mainly located in the Mountainous Areas and the PRD.

4 Discussion

4.1 Interpretation of the findings

In this paper, a comprehensive evaluation framework was constructed to assess the utilization of newly cultivated land, incorporating utilization sustainability, productivity stability, and landscape integration. The application of this framework in Guangdong province demonstrated its effectiveness. This methodological approach is vital for gaining a thorough and accurate understanding of the sustainable use of newly cultivated land, which is crucial for the effective management of cultivated land resources and the assurance of food security. The evaluation system developed in this study exhibits systematicness and representativeness, effectively capturing the multidimensional aspects of newly cultivated land utilization.
Spatial heterogeneity is evident in the utilization of newly cultivated land in Guangdong. Based on the comprehensive evaluation and level classification, it was observed that the first level of newly cultivated land predominantly exists in the West Wing, a traditional agricultural region in Guangdong with a longstanding history of farming and favorable conditions for agricultural production. Conversely, the third level of newly cultivated land is primarily found in the Mountainous Areas and the PRD. The Mountainous Areas, characterized by their mountainous and hilly terrain, lag in urban development compared to other regions in Guangdong. These areas face constraints in agricultural development due to limited natural resources and socio-economic conditions. The PRD, undergoing rapid urbanization with a high demand for construction land, experiences a significant land-human conflict. The limited availability of land resources in this region poses challenges to agricultural development.

4.2 Comparison with previous studies

This study aligns with conclusions drawn from previous research. Earlier studies identified that the western part of the province most effectively implemented the “requisition-compensation balance” policy, whereas the PRD exhibited less effective implementation (Li et al., 2021). Consistent with these findings, our study concluded that the first level of newly cultivated land is predominantly located in the West Wing, while the third level is chiefly found in the Mountainous Areas and the PRD.
Moreover, this research extends beyond previous studies, offering additional insights. Previous investigations have shown that Guangdong balanced the quantity of compensated and occupied cultivated land by examining land use statistical data (Liu et al., 2019). This study, through the analysis of remote sensing data, further uncovered that some areas classified as cultivated land are actually abandoned or occupied by construction land in practice. Shi et al. (2013) observed that in the Huang-Huai-Hai Plain of China, more “above average” quality and irrigated cropland was abandoned or converted to urbanization or other non-agricultural uses than that gained by reclamation. Although the study areas differ, our research identified instances of under-productive newly cultivated land. The distinction lies in this study’s focus on land consolidation projects and their execution at a finer scale, allowing for a reflection of regional characteristics while considering individual peculiarities.

4.3 Suggestions for cultivated land management

For policymakers at national and local levels, a comprehensive understanding of the state of newly cultivated land is imperative. This includes factors such as utilization sustainability, productivity stability, and landscape integration. Acknowledging these elements enables policymakers to formulate decisions that are both sustainable and practical.
It was observed that certain complementary cultivated land projects in Guangdong are situated in areas with sub-optimal location conditions. Additionally, some project areas were already classified as cultivated land before the implementation of land remediation. To enhance the sustainable utilization of newly cultivated land, it is recommended to strengthen the site selection process for these projects. Moreover, the monitoring of newly cultivated land for subsequent use and management should be improved, utilizing remote sensing and other methodologies (Kuang et al., 2022). While the “requisition-compensation balance” policy has significantly contributed to the protection of China’s cultivated land, the incentive and restraint mechanisms within this policy require further refinement (Liu et al., 2017). These recommendations are pertinent not only to Guangdong but also to other regions in China facing scarcity of land resources and significant human-land conflicts.

4.4 Limitations

In this study, remote sensing data were utilized to develop a comprehensive evaluation system for newly cultivated land, encompassing aspects such as utilization sustainability, productivity stability, and landscape integration. An empirical analysis was conducted using Guangdong as a case study. Nonetheless, certain limitations are identified in the research.
Firstly, assessing the performance of the “requisition-compensation balance” policy is a complex, systematic task. Due to constraints in data availability, the analysis was confined to complementary cultivated land, excluding a comparative study of both complementary and occupied cultivated land. Secondly, due to the evident fragmentation of cultivated land in Guangdong and the typically small scale of land consolidation projects, the spatial resolution limitations of available remote sensing data impeded the depiction of detailed characteristics of newly cultivated land, thereby potentially affecting the accuracy of the results. Thirdly, while this study concentrated on the utilization characteristics and development trends of newly cultivated land, the concrete index values possess limited direct implications and should be corroborated with field research to enhance the depth of the findings. Lastly, the productivity stability index was constructed based on EVI data. Although using EVI to assess crop yield offers advantages like ease of data acquisition, broad applicability, and rapid processing, direct comparisons of EVI across different crops may introduce errors. Future studies should endeavor to refine crop classification data to improve the accuracy of productivity stability assessments.

5 Conclusions

The assessment of newly cultivated land utilization is crucial for promoting sustainable use of such land and ensuring food security. Utilizing remote sensing data, this paper developed a comprehensive evaluation framework that integrates utilization sustainability, productivity stability, and landscape integration. This framework was applied to evaluate newly cultivated land in Guangdong, China.
The findings indicate that, throughout the study period, the sustainability of the utilization of newly cultivated land in Guangdong was generally positive. However, instances of land exploitation without effective use were also observed in some areas. The productivity stability evaluation yielded predominantly favorable results, characterized by an increasing productivity level and a decreasing trend in productivity fluctuation. However, challenges were noted in landscape integration, where significant differences were found in ecological environment quality between newly cultivated land and adjacent areas, and only marginal improvement in the contiguity of cultivated land was observed. Based on the comprehensive evaluation, newly cultivated land was categorized into three levels and eight types. The first level encompassed the efficient utilization type; the second level comprised the utilization adjustment type, productivity improvement type, landscape optimization type, utilization adjustment-productivity improvement type, utilization adjustment-landscape optimization type, and productivity improvement-landscape optimization type; and the third level included the comprehensive improvement type. The respective proportions of these three levels were 35.19%, 45.77%, and 19.04%. To foster sustainable utilization of newly cultivated land, it is recommended to strengthen site selection verification for complementary cultivated land projects, enhance post-utilization monitoring of newly cultivated land, and optimize incentive and restraint mechanisms for its utilization.
[1]
Alexander P, Prestele R, Verburg P H et al., 2017. Assessing uncertainties in land cover projections. Global Change Biology, 23(2): 767-781.

DOI PMID

[2]
Bai Y, Liu Y S, Li Y H et al., 2022. Land consolidation and eco-environmental sustainability in Loess Plateau: A study of Baota district, Shaanxi province, China. Journal of Geographical Sciences, 32(9): 1724-1744.

DOI

[3]
Bren d’Amour C, Reitsma F, Baiocchi G et al., 2017. Future urban land expansion and implications for global croplands. Proceedings of the National Academy of Sciences of the United States of America, 114(34): 8939-8944.

DOI PMID

[4]
Chen H, Tan Y Z, Xiao W et al., 2022. Urbanization in China drives farmland uphill under the constraint of the requisition-compensation balance. Science of The Total Environment, 831: 154895.

DOI

[5]
Chen W X, Ye X Y, Li J F et al., 2019. Analyzing requisition-compensation balance of farmland policy in China through telecoupling: A case study in the middle reaches of Yangtze River Urban Agglomerations. Land Use Policy, 83: 134-146.

DOI

[6]
Dang Y X, Liao Y B, Kong X B et al., 2022. Discussion on the top-level design and optimization of the system of cultivated land requisition-compensation balance. Natural Resource Economics of China, 35(6): 43-48, 88. (in Chinese)

[7]
Deng X Z, Huang J K, Rozelle S et al., 2006. Cultivated land conversion and potential agricultural productivity in China. Land Use Policy, 23(4): 372-384.

DOI

[8]
Fan X J, Quan B, Deng Z W et al., 2022. Study on land use changes in Changsha-Zhuzhou-Xiangtan under the background of cultivated land protection policy. Sustainability, 14(22): 15162.

DOI

[9]
Foley J A, DeFries R, Asner G P et al., 2005. Global consequences of land use. Science, 309(5734): 570-574.

DOI PMID

[10]
Guan X, Jin X B, Wei D Y et al., 2014. Discussion on the construction of comprehensive monitoring system for land consolidation project. China Land Sciences, 28(4): 71-76. (in Chinese)

[11]
He J H, Guan X D, Yu Y, 2016. A modeling approach for farmland protection zoning considering spatial heterogeneity: A case study of E-zhou city, China. Sustainability, 8(10): 1052.

DOI

[12]
Huang H P, Chen W, Zhang Y et al., 2021. Analysis of ecological quality in Lhasa Metropolitan Area during 1990-2017 based on remote sensing and Google Earth Engine platform. Journal of Geographical Sciences, 31(2): 265-280.

DOI

[13]
Kang L, Zhao R, Wu K N et al., 2021. Impacts of farming layer constructions on cultivated land quality under the cultivated land balance policy. Agronomy, 11(12): 2403.

DOI

[14]
Kuang W H, Liu J Y, Tian H Q et al., 2022a. Cropland redistribution to marginal lands undermines environmental sustainability. National Science Review, 9(1): 66-78.

[15]
Kuang W H, Zhang S W, Du G M et al., 2022b. Monitoring periodically national land use changes and analyzing their spatiotemporal patterns in China during 2015-2020. Journal of Geographical Sciences, 32(9): 1705-1723.

DOI

[16]
Li H B, Jin X B, Liu J et al., 2022. Analytical framework for integrating resources, morphology, and function of rural system resilience: An empirical study of 386 villages. Journal of Cleaner Production, 365: 132738.

DOI

[17]
Li J, Zhang S, Hu Y M et al., 2021. Performance evaluation of cultivated land occupation compensation balance policy in Guangdong province from the perspective of time and space. Journal of Agricultural Resources and Environment, 38(6): 1064-1073. (in Chinese)

[18]
Liao W H, Jiang W G, Huang Z Q, 2022. Spatiotemporal variations of eco-environment in the Guangxi Beibu Gulf Economic Zone based on remote sensing ecological index and granular computing. Journal of Geographical Sciences, 32(9): 1813-1830.

DOI

[19]
Lichtenberg E, Ding C R, 2008. Assessing farmland protection policy in China. Land Use Policy, 25(1): 59-68.

DOI

[20]
Liu B, Zhou H T, Qi M J et al., 2022. Requisition-compensation balance relief for hydraulic projects based on cultivated land quality improvement. Sustainability, 14(20): 13576.

DOI

[21]
Liu C Y, Song C Q, Ye S J et al., 2023. Estimate provincial-level effectiveness of the arable land requisition-compensation balance policy in mainland of China in the last 20 years. Land Use Policy, 131: 106733.

DOI

[22]
Liu L, Liu Z J, Gong J Z et al., 2019. Quantifying the amount, heterogeneity, and pattern of farmland: Implications for China’s requisition-compensation balance of farmland policy. Land Use Policy, 81: 256-266.

DOI

[23]
Liu L, Xu X L, Chen X, 2015. Assessing the impact of urban expansion on potential crop yield in China during 1990-2010. Food Security, 7: 33-43.

[24]
Liu X W, Zhao C L, Song W, 2017. Review of the evolution of cultivated land protection policies in the period following China’s reform and liberalization. Land Use Policy, 67: 660-669.

DOI

[25]
Liu Y S, Wang Y S, 2019. Rural land engineering and poverty alleviation: Lessons from typical regions in China. Journal of Geographical Sciences, 29(5): 643-657.

DOI

[26]
Lu X H, Zhang Y W, Zou Y C, 2021. Evaluation the effect of cultivated land protection policies based on the cloud model: A case study of Xingning, China. Ecological Indicators, 131: 108247.

DOI

[27]
Malakoff K L, Nolte C, 2023. Estimating the parcel-level impacts of agricultural conservation easements on farmland loss using satellite data in New England. Land Use Policy, 132: 106814.

DOI

[28]
Muruganantham P, Wibowo S, Grandhi S et al., 2022. A systematic literature review on crop yield prediction with deep learning and remote sensing. Remote Sensing, 14(9): 1990.

DOI

[29]
Qie L, Pu L J, Tang P F et al., 2023. Gains and losses of farmland associated with farmland protection policy and urbanization in China: An integrated perspective based on goal orientation. Land Use Policy, 129: 106643.

DOI

[30]
Seto K C, Ramankutty N, 2016. Hidden linkages between urbanization and food systems. Science, 352(6288): 943-945.

DOI PMID

[31]
Shen X Q, Wang L P, Wu C F et al., 2017. Local interests or centralized targets? How China’s local government implements the farmland policy of Requisition-Compensation Balance. Land Use Policy, 67: 716-724.

DOI

[32]
Shi W J, Tao F L, Liu J Y, 2013. Changes in quantity and quality of cropland and the implications for grain production in the Huang-Huai-Hai Plain of China. Food Security, 5(1): 69-82.

DOI

[33]
Skog K L, Steinnes M, 2016. How do centrality, population growth and urban sprawl impact farmland conversion in Norway? Land Use Policy, 59: 185-196.

DOI

[34]
Song W, Pijanowski B C, 2014. The effects of China’s cultivated land balance program on potential land productivity at a national scale. Applied Geography, 46: 158-170.

DOI

[35]
Song X Q, Ouyang Z, Li Y S et al., 2012. Cultivated land use change in China, 1999-2007: Policy development perspectives. Journal of Geographical Sciences, 22(6): 1061-1078.

[36]
Su M, Guo R Z, Hong W Y, 2019. Institutional transition and implementation path for cultivated land protection in highly urbanized regions: A case study of Shenzhen, China. Land Use Policy, 81: 493-501.

DOI

[37]
Sun R, Sun P, Wu J X et al., 2014. Effectiveness and limitations of cultivated land requisition-compensation balance policy in China. China Population, Resources and Environment, 24(3): 41-46. (in Chinese)

[38]
Tan M H, Li Y Y, 2019. Spatial and temporal variation of cropland at the global level from 1992 to 2015. Journal of Resources and Ecology, 10(3): 235.

DOI

[39]
Tan Y Z, Chen H, Lian K et al., 2020. Comprehensive evaluation of cultivated land quality at county scale: A case study of Shengzhou, Zhejiang province, China. International Journal of Environmental Research and Public Health, 17(4): 1169.

DOI

[40]
van Vliet J, 2019. Direct and indirect loss of natural area from urban expansion. Nature Sustainability, 2(8): 755-763.

DOI

[41]
Wang J, Lin Y F, Zhai T L et al., 2018. The role of human activity in decreasing ecologically sound land use in China. Land Degradation & Development, 29(3): 446-460.

DOI

[42]
Wang X M, Zhou D Y, Jiang G H et al., 2023. How can the sustainable goal of cultivated land use in the Qinghai-Tibet Plateau be realized? Based on a research framework of cultivated land use patterns. Frontiers in Environmental Science, 11: 1134136.

DOI

[43]
Wang Y F, Cheng L L, Zheng Y, 2023. An adjusted landscape ecological security of cultivated land evaluation method based on the interaction between cultivated land and surrounding land types. Land, 12(4): 833.

DOI

[44]
Wei X, Liu L M, Zhang D X et al., 2022. Performance evaluation on the policy of balancing paddy field occupation and reclamation in Hunan province. China Land Sciences, 36(1): 57-67. (in Chinese)

[45]
Yang H, Li X B, 2000. Cultivated land and food supply in China. Land Use Policy, 17(2): 73-88.

DOI

[46]
Yang J, Huang X, 2021. 30 m annual land cover and its dynamics in China from 1990 to 2019 (1.0.0) [Data set]. Zenodo.

[47]
Yang S L, Bai Y, Alatalo J M et al., 2022. Spatial-temporal pattern of cultivated land productivity based on net primary productivity and analysis of influencing factors in the Songhua River basin. Land Degradation & Development, 33(11): 1917-1932.

DOI

[48]
Ye S J, Ren S Y, Song C Q et al., 2022. Spatial patterns of county-level arable land productive-capacity and its coordination with land-use intensity in mainland of China. Agriculture, Ecosystems & Environment, 326: 107757.

[49]
Zhang B L, Sun P L, Jiang G H et al., 2019. Rural land use transition of mountainous areas and policy implications for land consolidation in China. Journal of Geographical Sciences, 29(10): 1713-1730.

DOI

[50]
Zhang M Y, Chen Q X, Zhang K W, 2021. Influence of the variation in rural population on farmland preservation in the rapid urbanization area of China. Journal of Geographical Sciences, 31(9): 1365-1380.

DOI

[51]
Zhao C, Zhou Y, Li X G et al., 2018. Assessment of cultivated land productivity and its spatial differentiation in Dongting Lake region: A case study of Yuanjiang city, Hunan province. Sustainability, 10(10): 3616.

DOI

[52]
Zheng W W, Li S M, Ke X L et al., 2022. The impacts of cropland balance policy on habitat quality in China: A multiscale administrative perspective. Journal of Environmental Management, 323: 116182.

DOI

[53]
Zhou X, Chen W, Wang Y N et al., 2019. Suitability evaluation of large-scale farmland transfer on the Loess Plateau of northern Shaanxi, China. Land Degradation & Development, 30(10): 1258-1269.

DOI

[54]
Zhou Y, Li X H, Liu Y S, 2021. Cultivated land protection and rational use in China. Land Use Policy, 106: 105454.

DOI

[55]
Zhu H Y, Li X B, 2003. Discussion on the index method of regional land use change. Journal of Geographical Sciences, 13(5): 643-650. (in Chinese)

[56]
Zhuang D F, Liu J Y, 1997. Study on the model of regional differentiation of land use degree in China. Journal of Natural Resources, 12(2): 10-16. (in Chinese)

Outlines

/