Research Articles

Comparing the driving mechanisms of different types of urban construction land expansion: A case study of the Beijing-Tianjin-Hebei region

  • KANG Lei , 1 ,
  • MA Li , 1, 2, * ,
  • LIU Yi 1, 2
Expand
  • 1. Key Laboratory of Regional Sustainable Development Modeling, Institute of Geographic Sciences and Natural Resources Research, CAS, Beijing 100101, China
  • 2. College of Resources and Environment, University of Chinese Academy of Sciences, Beijing 100049, China
* Ma Li, Associate Professor, specialized in industrial transforming and regional sustainable development. E-mail:

Kang Lei (1989-), Assistant Professor, specialized in urban human-land relationship and sustainable development. E-mail:

Received date: 2022-12-08

  Accepted date: 2023-11-21

  Online published: 2024-04-24

Supported by

National Natural Science Foundation of China(42071158)

National Natural Science Foundation of China(42130712)

National Natural Science Foundation of China(41801114)

Abstract

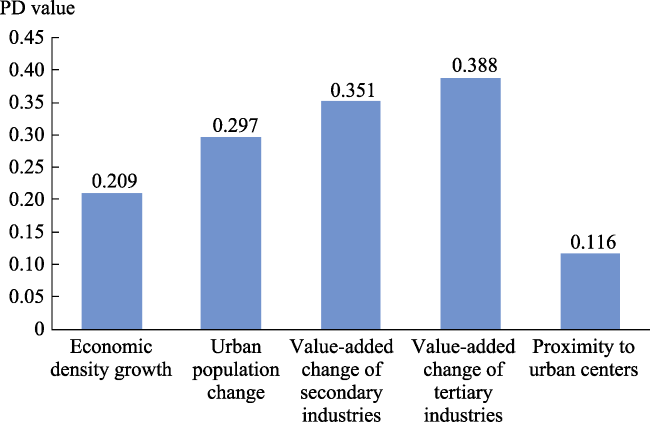
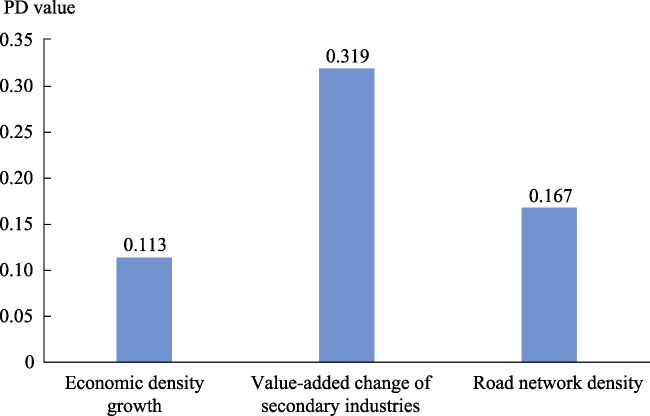
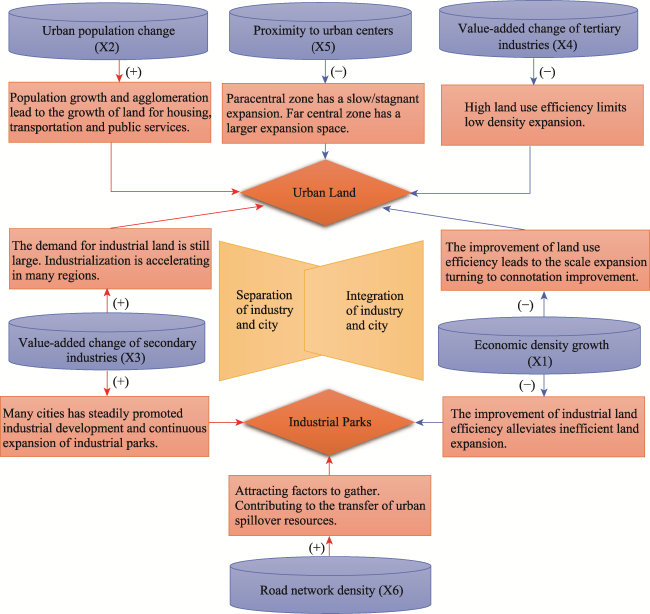
Different types of urban construction land are different in terms of driving factors for their expansion. Most existing studies on driving forces for urban construction land expansion have considered the construction urban land as a whole and have not examined and compared the differentiated driving forces for different types of construction land expansion. This study explored the differentiated driving mechanisms for two types of urban construction land expansion by selecting key driving factors and using spatial econometric regression and geographical detector models. The results show that there are significant differences in the driving forces for expansion between the two types of urban construction land. The driving factors of urban land expansion do not necessarily affect industrial parks. And the factors acting on expansion of both types are different in influence degree. For urban expansion, economic density growth, the value-added growth of tertiary industries, and proximity to urban centers have a negative effect. However, urbanization levels and value-added growth of secondary industries have a positive effect. The explanatory power of these factors is arranged in the following descending order: value-added growth of tertiary industries, value-added change of secondary industries, urban population growth, economic density growth, and proximity to urban centers; road network density has no significant effect. For industrial parks expansion, the value-added growth of secondary industries and road network density has a positive effect, while economic density growth has a negative effect. The explanatory power is arranged in the following descending order: value-added growth of secondary industries, road network density, and economic density growth. The findings can help implement differentiated and refined urban land use management policies.

Cite this article

KANG Lei , MA Li , LIU Yi . Comparing the driving mechanisms of different types of urban construction land expansion: A case study of the Beijing-Tianjin-Hebei region[J]. Journal of Geographical Sciences, 2024 , 34(4) : 722 -744 . DOI: 10.1007/s11442-023-2191-x

1 Introduction

Urban land is the material carrier of urban socioeconomic activities (Novotný et al., 2022), and its dynamic expansion reflects the spatial process and characteristics of urban development (Liu and Cao, 2010). According to the studies (Qiao et al., 2019; Liu et al., 2020), urban areas increased globally from 362,700 km2 to 653,400 km2 during 30 years from 1985 to 2015, with a net expansion rate of 80%, and an average of 9687 km2 non-urban land was transformed into urban land each year. The European Space Agency’s land cover dataset (1992 to 2015) revealed that since 1992, urban expansion had been chiefly attained at the expense of agricultural land, followed by grasslands and forests. Urbanization is depleting agricultural land at a significant rate of 61,567 km2 per decade, while grasslands and forests are, respectively, depleted at the rate of 10,246 km2 and 7624 km2 per decade. Further, continuous economic growth, rapid urbanization, and industrialization have led to large-scale concentrations of populations in cities. Moreover, the expansion of production scale and scope has intensified urban land expansion causing human-land tension and even inducing various conflicts (e.g., habitat destruction, ecological degradation, reduction of agricultural land, and land acquisition conflicts) (Güneralp et al., 2017; Chakraborty et al., 2021; Tu et al., 2021; Simkin et al., 2022). Consequently, significant pressure is exerted on regional resources, ecological environments, and social stability, posing a considerable challenge to sustainable regional development. In this context, urban land expansion has long been a shared global concern research subject (Angel et al., 2021; Chakraborty et al., 2022a).
Understanding the dynamic characteristics of urban land expansion is an essential basis for informing effective urban development policies. Therefore, monitoring and measuring the spatiotemporal characteristics of urban land expansion is essential (Luo and Wei, 2009; Gong et al., 2018; Gong et al., 2019; Yang et al., 2019; Güneralp et al., 2020; Chakraborty et al., 2022b; Liu et al., 2022; Zheng et al., 2022). Ascertaining the driving mechanisms for urban land expansion can guide well-targeted policies to alleviate various contradictions and problems caused by rapid urban land expansion (Brainoh and Onishi, 2007; Li et al., 2013; Li et al., 2016). Many researchers have theoretically and quantitatively elucidated the driving mechanisms for urban spatial expansion from different perspectives (e.g., capital, land, politics, and institutions) (Bhagyanagar et al., 2012; Li et al., 2016). Based on previous findings, Liu et al. (2002) summarized five categories of influencing mechanisms for urban spatial expansion—dynamic factors, natural mechanisms, market mechanisms, social value mechanisms, and political power mechanisms. In China, where the human-land contradiction is acute, the driving mechanisms for urban land expansion have received considerable attention from governments and academics. From large quantities of socio-economic statistics, researchers have selected many possible influencing indicators, including geographical conditions such as topography and elevation, economic development such as GDP, industrial structure, income levels, urbanization level, industrialization level, technological progress, economic globalization, population, and policies such as land use policies and urban development planning, in order to investigate the driving mechanisms for urban construction land expansion in different regions (Tian et al., 2005; Ma and Xu, 2010; Long et al., 2012; Li et al., 2013).
Urban construction land includes diverse types of construction land, which are different in terms of functions, the influencing factors of locational selection and developers, as well as the factors driving their expansion. Among various types of urban construction land, urban land serves as the primary driver of economic development, population growth, and various comprehensive service functions due to its well-established municipal public infrastructure. Numerous studies have focused on the driving forces behind urban land expansion, with almost unanimous consensus on the significant influence of population growth and economic development on urban land expansion (Li et al., 2018b; Wang et al., 2020b). Additionally, factors such as location conditions, industrial structure, administrative management, and development planning also exert a considerable impact on urban land expansion (Mou et al., 2007; Jia et al., 2020). Industrial land, another crucial component of urban construction land, plays a pivotal role in urban development. The emergence of industrial parks, tailored to the stages of industrialization, has been a prominent feature since the 1980s. The global rise of new technologies and substantial changes in industrial structures have driven developed and developing countries alike to establish industrial parks. The impetus for industrial park expansion stems from the demand for innovation, changes in industrial structure, technological advancements, and connectivity (Dursun et al., 2019; Wang et al., 2022; Zhuang and Ye, 2023). In China, various industrial parks at different administrative levels are continually being constructed and expanded, providing vital support for the spatial expansion of urbanization, industrial clustering, and population migration. Industrial parks, as special policy zones (Wong and Tang, 2005; Zhuang and Ye, 2020), have become significant economic growth hubs shaped by government policies. Industrial parks share a close relationship with cities and are typically located on the outskirts during their initial development stages (Gao and Wang, 2023). When a region is used to establish industrial parks, large quantities of factory buildings, staff dormitories, and infrastructure will be built to develop the economy and attract investment (Gao and Wang, 2023). Favorable locations and robust infrastructure serve as the foundation for the expansion of these development zones. Considering that the primary function of industrial parks is to host regional pillar industries and industrial clusters, the scale of industrial parks has been expanding continually with the continuous introduction and increase of industrial projects (Wei and Leung, 2005; Peng et al., 2017), which makes industrial parks also significant for optimizing the use of urban space (Sun et al., 2020). Therefore, the development and expansion of industrial parks are influenced by various social and economic factors, including location and industry. However, due to the distinct properties and functions of urban land and industrial parks, their land use requirements differ significantly, leading to substantial heterogeneity in the order and extent to which various factors influence their expansion. In other words, while both types of land expansion are influenced by some common factors, the driving mechanisms inevitably differ. This distinction necessitates differential management when controlling and optimizing these two types of land. Currently, there is limited research analyzing the disparities in driving forces between these two types of land. This gap in knowledge impedes the development of policies at the mechanistic level, the regulation of the orderly expansion of urban land and industrial parks, and the optimization of the urban-industrial pattern.
Most existing studies have considered urban construction land as a whole, implying that the same driving forces influence diverse types of urban construction land expansion. This precludes researchers from revealing the differentiating factors and mechanisms for urban land expansion. Research has also been carried out on the driving force of expansion of different subdivision types of construction land, but most of them focused on different functional land within the city. For example, Xiong et al. (2018) analyzed the differentiated driving forces for land expansion in commercial and industrial lands in Yiwu, Zhejiang, China. They concluded that both were influenced by the natural environment, socioeconomic location, neighborhood status, and spatial policies, but there were obvious internal differences. Huang et al. (2014) quantitatively analyzed the influencing factors for expanding four types of construction land (residential, industrial, mining, and commercial land) in Changping district, Beijing. However, internal urban studies mainly consider differences in factors within cities. However, when we expand our scope to a more open and regional scale, different spatial units in various cities are at different stages of development, with variations in economic development, population attractiveness, industrial structure, infrastructure development, and more. Therefore, it is necessary to consider the differences between cities when explaining the driving mechanism of these factors on different land expansion. Studying the differentiated driving factors for diverse types of urban land expansion from a regional perspective can uncover the driving mechanisms more accurately, and the findings can provide detailed and accurate information for city managers and policymakers, to achieve differentiated spatial control of the entire region. To some extent, it can help enrich and expand upon existing analyses of urban expansion driving forces.
Therefore, this study analyzed the spatiotemporal distribution patterns of different types of urban land expansion (including land expansion in urban areas and industrial parks) in the Beijing-Tianjin-Hebei region with remarkable park-economy characteristics from 2000 to 2020. Further, the spatial regression and geographic detector technology were adopted to measure and discuss their differentiated driving forces. This study, based on a more macro urban cluster regional scale, focused on critical subtypes of urban construction land, identifying and comparing the differentiation in driving forces for various subtypes of urban construction land expansion. The research findings aim to provide urban managers and decision-makers with more detailed and precise information to achieve differential spatial control across the entire region and propose more targeted land use optimization and regulation strategies.

2 Materials and methodology

2.1 Study area

The Beijing-Tianjin-Hebei region boasts high economic development and is the most fully-developed city cluster in northern China (Figure 1). It is a typical example of the rapid expansion of urban construction land. As an influential agglomeration, the rational use and allocation of its land are important to regional development (Fang et al., 2023). As the cluster’s coordinated development is a national strategy, the socioeconomic connection between Beijing, Tianjin, and Hebei are growing stronger, and the formation of large contiguous urbanized areas is an inevitable trend of regional development. The land is the carrier of population and industry, and regional cooperation in land resource utilization and development is important for integrated development (Li et al., 2018a). Today, industrial parks are extremely dense in Beijing, Tianjin, and Hebei, and their economic pull continues to increase; the industry-city relationship in industrial parks is complex and regional (Kang and Ma, 2021). Integration depends on the coordinated interaction of industry-city space, and the rational allocation of land resources and optimization of urban land use are vital to regional collaboration, competitiveness, and sustainable and healthy development. Ascertaining the driving mechanism for urban land expansion in the Beijing-Tianjin-Hebei region can provide a reference for the scientific positioning of urban functions and coordinated socioeconomic development in the region.
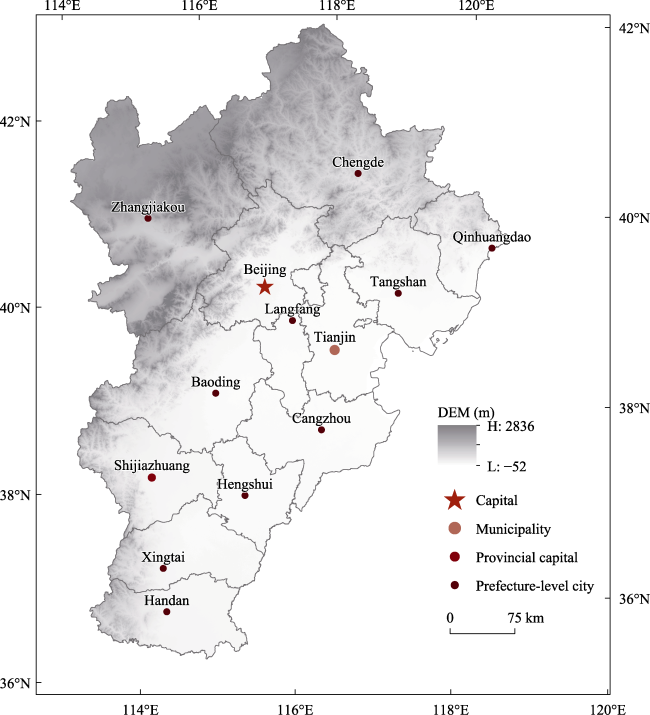
Figure 1 Location of the Beijing-Tianjin-Hebei region, China

2.2 Data resources and processing

In this study, the spatial distribution vector data of major industrial parks were generated mainly by the visual interpretation and vectorization of remote sensing images. According to the Review and Announcement Catalog of China Development Zones, we obtained a list of industrial parks at the provincial level or above in Beijing, Tianjin, and Hebei. We procured the latitude and longitude data of each industrial park administrative committee as the basis for determining the spatial locations of industrial parks. Using the United States Geological Survey (USGS), we collected Land-sat TM/ETM remote sensing image data with a resolution of 30 m for approximately Beijing, Tianjin, and 11 prefecture-level cities in Hebei in different periods (2000 and 2020). Based on the high-resolution Google Earth satellite images of the corresponding areas and non-remote-sensing data (e.g., planning maps) of some industrial parks, we used GIS and RS technologies to generate vector data of the spatial distribution of industrial parks in the Beijing-Tianjin-Hebei region in 2000 and 2020 through manual judgment and visual interpretation of computer screen information (Figure 2a). In this study, urban land data is derived from China’s land use remote sensing monitoring data from the Resource and Environment Science and Data Centre of the Chinese Academy of Sciences. We first selected “urban land” numbered 51 as the initial scope of urban land. Considering the fact that the urban land area contains some industrial parks, we cut out the containing industrial parks to obtain the actual urban land used in our study, which mainly comprises residential land, public facilities land, commercial and service land, as well as some industrial, mining, and storage land excluding the industrial parks, trying to more accurately uncover the differentiated driving forces for the two types of urban land expansion (Figure 2b).
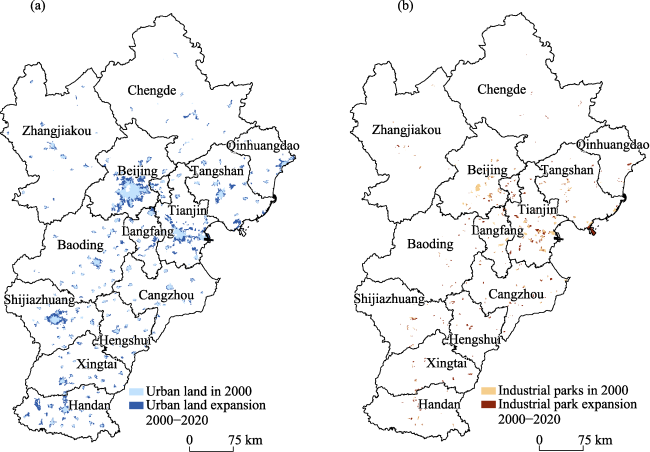
Figure 2 Distribution of expansion for urban land (a) and industrial parks (b) in the Beijing-Tianjin-Hebei region from 2000 to 2020
The socioeconomic data of counties in the Beijing-Tianjin-Hebei region were mainly cited from the statistical yearbooks of Beijing, Tianjin and cities of Hebei (2001 and 2021), supplemented by statistical bulletins of national economic and social development. The missing data for 2000 were acquired from statistical yearbooks and information such as the China City Statistical Yearbook and China Compendium of Statistics 1949-2008 Finally, the socioeconomic database of districts and counties in the Beijing-Tianjin-Hebei region for 2000 and 2020 was constructed.

2.3 Methodology

2.3.1 Selection of driving factors for urban expansion

Urban expansion is the evolution of land use landscape patterns under the strong interference of human activity (Liu et al., 2022). And many studies have shown that socio-economic factors lead to the spatial heterogeneity of urban landscape expansion (Yue et al., 2013; Chen et al., 2014; Wang and Lu, 2018; Rifat and Liu, 2019). Following existing studies, we selected influencing factors (social economy, urbanization development, industrial structure, locational conditions, and transportation infrastructure levels) based on data availability and quantifiability. Specifically, economic density indicates the efficiency of economic activities per unit land area. Areas with high economic density usually have highly efficient land utilization and controlled land development intensity and expansion. Urban population growth is the representative factor in urbanization, causing an increasing demand for living and public infrastructure land and consequent urban land expansion. Industrial development and the evolution of industrial structures can facilitate the optimization of urban functions and promote the orderly evolution of urban space. The proximity to urban centers (i.e., the distance from the center of a district/county-level unit to the center of an associated city-level unit) is the representative factor in locational conditions. The more proximate to the urban center, the stronger is the radiation effect of urban development and the higher the possibility of land expansion. Road network density reflects the transportation infrastructure level of a region. High road network density can increase the accessibility of the region, facilitate the concentration and spillover of various resources, and increase the possibility of spatial expansion. In summary, we selected the dependent variables, including the urban land expansion scale and industrial park expansion scale from 2000 to 2020. The driving factors, including the meanings and calculation methods, are shown in Table 1.
Table 1 Overview of driving factors index
Index Representative factor Calculation method
Social economy X1: Economic density growth The added value of GDP per unit land area in districts and counties from 2000 to 2020
Urbanization
development
X2: Urban population change Changes of urban population in districts and counties from 2000 to 2020
Industrial structure X3: Value-added change of secondary
industries
Changes of added value of secondary industries in districts and counties from 2000 to 2020
X4: Value-added change of tertiary
industries
Changes of added value of tertiary industries in districts and counties from 2000 to 2020
locational conditions X5: Proximity to urban centers The distance between the center of each district and the center of its city
Transportation
infrastructure levels
X6: Change of road network density The ratio of the total length of all provincial roads, highways and railways to the area of the region

2.3.2 Spatial regression models

Spatial econometrics analyzes the spatial distribution of variables and disturbance terms in the presence of spatial heterogeneity. The spatial lag model (SLMs) and spatial error models (SEMs) are often used to verify the spatial effects exhibited by spatial correlations (Wang and Xu, 2017). An SLM is expressed as follows:
$Y=\rho Wy+X\beta +\varepsilon $
where Y and X denote the dependent variable vector and the explanatory variable matrix, respectively. Further, W is the spatial weight matrix, Wy refers to the dependent variable of spatial lag, and ρ is the spatial regression coefficient, indicating the degree of diffusion or spillover between adjacent spatial units. Moreover, the parameter β reflects the influence of X on Y, Wy reflects the effect of spatial distance on spatial behaviors, and ε is the vector of the random error term. The SLM is mainly used to verify the spatial spillover effect of a dependent variable in a region and that the influencing factors of a dependent variable affect other regions through a spatial transmission mechanism.
Unlike the SLM, the SEM is used to analyze the spatial dependence in the disturbance error term and measure the degree of influence of the error in the dependent variable of an adjacent region on the dependent variable of the current region. An SEM is expressed as follows:
$\begin{align} & Y=X\beta +\varepsilon \\ & \varepsilon =\lambda W\varepsilon +\mu \\ \end{align}$
where Y and X denote the dependent variable vector and the explanatory variable matrix, respectively. W denotes the spatial weight matrix, ε is the vector of the random error term, λ is the spatial error coefficient of the dependent variable vector, and μ is the random error vector of normal distribution. The parameter β reflects the influence of the independent variable X on the dependent variable Y. The parameter λ reflects the degree of influence of the error in the dependent variable of an adjacent region on the dependent variable of the current region.

2.3.3 Geographical detector technique

The geographical detector technique detects the stratified spatial heterogeneity of elements and thus uncovers the driving forces (Wang et al., 2010). It examines the spatial heterogeneity of a single variable and can detect the possible causal relationship between two variables by examining the consistency of their spatial distribution. With only a few constraints, the geographical detector model effectively overcomes the limitations of traditional mathematical-statistical models in addressing such problems (Wang et al., 2010). The method is mainly used to identify the influencing factors of spatial heterogeneity and ascertain its action mechanism. The geographical detector model is expressed as follows:
${{P}_{D,E}}=1-\frac{1}{n{{\sigma }^{2}}_{E}}\sum\nolimits_{i=1}^{m}{{{n}_{D,i}}{{\sigma }^{2}}{}_{{{E}_{D.i}}}}$
where PD,E denotes the detection power indicator of driving factors of urban land expansion, nD,i the sample size of a sub-region, and n the sample size of the entire region. Further, m denotes the number of sub-regions, ${{\sigma }^{2}}_{E}$ the variance of urban land expansion of the entire region, and ${{\sigma }^{2}}{}_{{{E}_{D.i}}}$ the variance of urban land expansion of a sub-region. Assume that the model is valid when ${{\sigma }^{2}}{}_{{{E}_{D.i}}}\ne 0$. The value range of PD,E is [0,1]. When PD,E = 0, it indicates that urban land expansion is randomly distributed. The larger the PD,E value, the more significant is the driving effect of subregion factors on urban land expansion. In this study, we selected the driving factors identified by estimating the above spatial econometric model and passed the significance test. Moreover, we detected the degree of the effect of each driving factor on urban land expansion using the geographical detector model.

3 Results

3.1 Spatial patterns of land expansion in urban land and industrial parks

The Expansion Intensity Index (EI) refers to the proportion of expansion areas to the total land area within a study unit within a period (Wang et al., 2020a). In our study, the EI was used to describe the spatiotemporal patterns of land expansion in urban land and industrial parks in the Beijing-Tianjin-Hebei region.
Figure 3 illustrates the spatial distribution of expansion intensity for urban land and industrial parks in the Beijing-Tianjin-Hebei region. Looking at the urban land expansion pattern from 2000 to 2020, the entire Beijing-Tianjin-Hebei region experienced a positive expansion intensity, resulting in a continuous spatial expansion of urban land. High-value areas (in red) denote urban land expansion intensity exceeding 10%, primarily concentrated in Beijing, including the central city and adjacent districts such as Tongzhou, Daxing, Changping, and Shunyi. In Tianjin, these high-value areas are mainly found in Beichen, Dongli, Jinnan, and Xiqing outside the central city. Several other cities in Hebei, like Shijiazhuang, Tangshan, Handan, Baoding, and Zhangjiakou also exhibit urban land expansion intensities surpassing 10%. The areas with urban land expansion intensity ranging from 5% to 10% (in orange) are more scattered, mainly concentrated in the peripheral areas surrounding the high-value urban land expansion regions. The medium-value areas (in yellow) with an expansion intensity between 1% and 5% are distributed in the northernmost suburbs of Beijing, including districts of Yanqing, Huairou, Miyun, and Pinggu. Simultaneously, they are also widely distributed in the peripheral districts of central Tianjin, Tangshan, Shijiazhuang, Qinhuangdao, Hengshui, and other regions. The regions with expansion intensity less than 1% (in blue) are predominantly located in the northwest of the Beijing-Tianjin-Hebei region, encompassing most of the districts and counties in cities like Baoding, Zhangjiakou, Chengde, and others. Additionally, the majority of the districts and counties outside the central urban area of Cangzhou and the northern districts and counties of Hengshui also exhibit relatively lower urban land expansion intensity. Notably, there are no areas with a low-value urban land expansion intensity in Beijing, with only minor expansion intensity in Jixian, north of Tianjin.
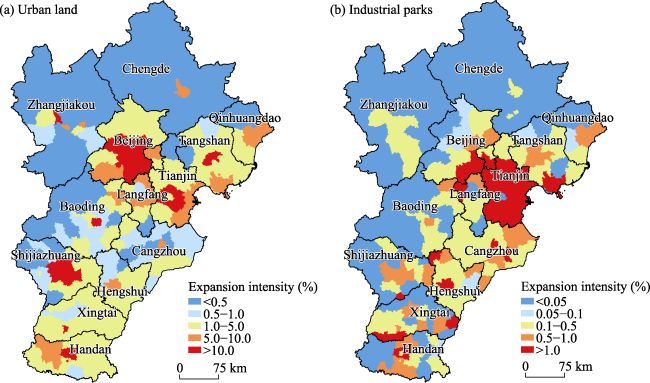
Figure 3 Spatial pattern of land expansion for urban land (a) and industrial parks (b) in the Beijing-Tianjin-Hebei region from 2000 to 2020
As for the expansion intensity of industrial park land, in comparison to urban land, the overall expansion is more concentrated in the eastern regions. The red areas indicate high-value zones with industrial park expansion intensity exceeding 1.0%. These areas are primarily located in the eastern and southern parts of Beijing, including Tongzhou and Daxing, along with various districts and counties in Tianjin (except the central city) and Jixian in the northernmost area. Surrounding regions such as Langfang, bordering Beijing, and the central cities of Cangzhou, Hengshui, and Handan, among others. Areas with medium and high value (represented in orange and yellow) exhibit expansion intensity ranging from 0.1% to 1.0%. These zones are mainly concentrated around the high-value areas and central urban regions of various cities. This includes the central urban area of Beijing, the northern districts of Shunyi and Pinggu, the southern region of Fangshan, Jixian in the north of Tianjin, and the central urban regions of Langfang, Tangshan, Cangzhou, Shijiazhuang, Zhangjiakou, and nearby districts and counties bordering the central urban area. Moreover, Hengshui, Xingtai, and Handan are primarily distributed within the Beijing-Tianjin-Tang region, with Shijiazhuang, Langfang, Qinhuangdao, Cangzhou, Hengshui, Xingtai, and other cities also having several districts and counties with industrial park expansion intensities exceeding 0.1%. Lastly, low-value areas (in blue) exhibit expansion intensities below 0.1% and are widely distributed across most of the northern and western parts of the Beijing-Tianjin-Hebei region. These areas include the western regions of Beijing, Chengde, and Zhangjiakou in Hebei Province, the western parts of Baoding and Shijiazhuang, the western and northern parts of Tangshan and Qinhuangdao, the western area of Shijiazhuang, and the peripheries of Xingtai and Handan in the south.

3.2 Analysis of driving forces for urban land expansion

In this study, the urban land and industrial park expansion scales from 2000 to 2020 were used as dependent variables, and spatial correlation was pre-tested on the dependent variables using the ArcGIS spatial data analysis module. We calculated the global Moran’s I, an index that measures spatial autocorrelation or spatial agglomeration. The global Moran’s I of the county-level built-up area and industrial park expansion scales were found to be 0.1315 and 0.2163, respectively (their normal statistic Z values were 6.2937 and 9.1922, respectively, greater than the critical value of 2.58 of the normal function at the 1% significance level and significant at a 95% confidence level via the randomization assumption). This result indicates a relatively strong, positive spatial correlation (as described in Table 2). The test results show that the expansion of the two types of urban land has a certain spatial effect. Therefore, it was scientifically necessary to analyze the influencing factors using a spatial regression model. We also conducted VIF tests on all independent variables, and the VIF values measured were all less than 10, which proved that there was no high correlation between the selected variables and they could all be included in the model.
Table 2 Spatial autocorrelation test results of diverse built-up land expansion from 2000 to 2020
Statistics Urban land Industrial parks
Moran’s I 0.1315 0.2163
z-value 6.2937 9.1922
p-value 0.0000 0.0000
In this study, parameter estimation of the spatial regression model was conducted using Geoda spatial econometric software. Based on the regression analysis of the driving factors of expansion of two types of urban land, the geographical detector method was further used to measure the influencing intensity of driving factors that passed the significance test in the regression estimation. Before the estimation, various factors were naturally clustered, graded, and partitioned using the geographical detector model. The whole region was divided into five sub-regions in geographical space according to its original value with high value, less high value, medium value, less low value, and low value, respectively. The distributions of the six factors are displayed in Figure 4.
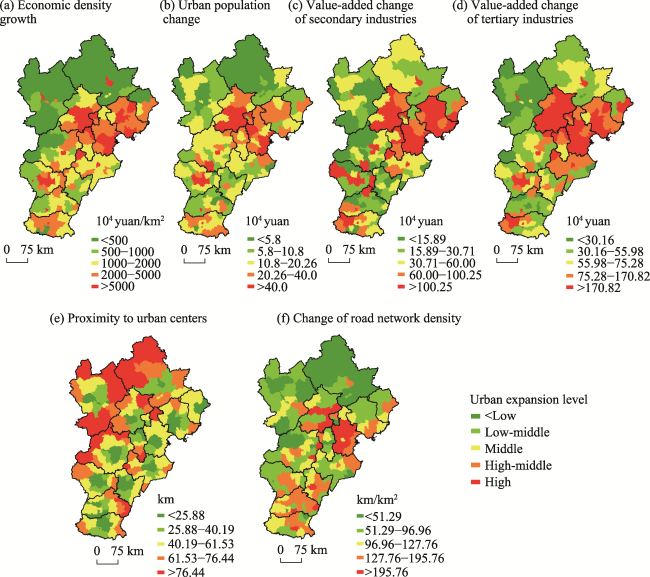
Figure 4 Driving factors of urban expansion for the Beijing-Tianjin-Hebei region

3.2.1 Influencing factors for urban land expansion

Based on the Robust Lagrange Multiplier (LM) test, The Robust LM-Error and Robust LM-lag statistics obtained both pass the significance test (p-value: 0.0000), indicating that both SEM and SLM can reflect spatial correlation, and both models can be used. In addition, their estimation results have a high degree of consistency, which shows that the model estimation results are reliable. The model test results show that both the SLM and SEMs test are valid, and their estimation results have a high degree of consistency. The results show that economic density growth, urbanization level, the value-added growth of secondary and tertiary industries, and proximity to urban centers have a significant effect on land expansion in main urban areas (Table 3). In particular, economic density growth, the value-added growth of tertiary industries, and proximity to urban centers have a negative effect on land expansion in urban land. However, high urbanization levels and the value-added growth of secondary industries have a positive effect on land expansion in built-up areas. The transportation infrastructure level has no significant influence on land expansion in urban land. Using the geographical detector technique, we further estimated the degree of influence of these five influencing factors, which can be ranked by the power of determinant (PD) value as follows (Figure 5): value-added change of tertiary industries (X4) (0.388) > value-added change of secondary industries (X3) (0.351) > urban population change (X2) (0.297) > economic density growth (X1) (0.201) > proximity to urban centers (X5) (0.116). This result shows that the value-added growth of tertiary industries can predominantly explain the urban land expansion, followed by the value-added growth of secondary industries and urban population growth, while proximity to urban centers was found to have a relatively weak influence.
Table 3 Estimation results of regressions for urban land expansion
Spatial lag model Estimate Standard error z-value Probability
X1 -0.001129* 0.0006342 -1.8179 0.0682
X2 1.02976*** 0.129310 8.1235 0.0000
X3 0.018215** 0.037831 2.39178 0.02127
X4 -0.029534*** 0.0069793 -4.2789 0.00069
X5 -0.001783** 8.29E-05 -3.8251 0.0153
X6 0.009033 0.03126 0.52565 0.83278
R-squared: 0.672369, Log likelihood: -767.379 for lag model; AIC: 1583.28;
Robust Lagrange multiplier test: 2.832 on 1 DF, p-value: 0.00000
Spatial error model Estimate Standard error z-value Probability
X1 -0.0011267** 0.00058342 -2.3139 0.03785
X2 1.23687*** 0.119217 7.90312 0.0000
X3 0.0088941** 0.0051289 2.79836 0.03551
X4 -0.020539*** 0.00490218 -3.34121 0.00026
X5 -0.00029788*** 8.56E-05 -3.8973 0.00702
X6 0.019718 0.03258 0.69895 0.5033
R-squared: 0.66766, Log likelihood: -771.312 for error model; AIC: 1599.12;
Robust Lagrange multiplier test: 1.458 on 1 DF, p-value: 0.00000

Note: *, **, and *** mean significant at 10%, 5%, and 1% levels, respectively.

Figure 5 The power of determinant for the five factors affecting the urban land expansion
Specifically, the value-added growth of tertiary industries has a negative and the most significant influence on the expansion of urban land. Compared with primary and secondary industries, tertiary industries are characterized by small land occupation and high benefits. This implies that the scale of land required per unit of economic output is small, and the intensiveness of land utilization is high, thus causing a significant slowdown in the expansion of urban land. For instance, in the central urban areas of Beijing and Tianjin, the urban land expansion rate remains below 100% from 2000 to 2020. These areas boast a well-developed tertiary industry, characterized by a significant presence of high public service land and efficient land output. In contrast, the tertiary industry in most cities in Hebei lags behind, with over 64% of districts and counties exhibiting a lower proportion of commercial service land in urban construction compared to the average value of Beijing-Tianjin-Hebei (Song et al., 2021). Consequently, these areas experience lower land use intensity. As a result, nearly all districts and counties witnessing an urban land expansion rate exceeding 200% from 2000 to 2020 are located in Hebei. But on the whole, as the industrial structure of the Beijing-Tianjin-Hebei region continues to improve in recent years, tertiary industries have become an important source of support for the region’s development. The continuous growth of modern service industries has a positive impact on land utilization. The value-added growth of secondary industries has a positive effect on urban land expansion. This is mainly because most areas in the Beijing-Tianjin-Hebei region are still at the stage of accelerated industrialization and thus have an increasing demand for secondary industry land, especially industrial land. The rise in urbanization level directly leads to the increase and gathering of urban populations, thus driving the expansion of urban space. Existing studies have indicated that the proportion of industrial and mining storage land in the urban areas of Beijing- Tianjin-Hebei remains substantial. Notably, Tangshan and Tianjin have industrial and mining storage land accounting for 43.39% and 32.51%, respectively, surpassing the threshold set by the “Urban Land Classification Planning and Construction Land Standard” for industrial and mining storage land (15%-30%). In the remaining 11 cities, industrial and mining storage land falls within the standard range but is close to the upper limit of the stipulated standard (Song et al., 2021). This observation precisely validates the significant demand for the secondary industry, particularly industrial development land, indicating a substantial driving force behind urban land expansion. In the Beijing-Tianjin-Hebei region, the newly-increased urban population is mainly concentrated in core urban areas, leading to limited urban land expansion. So, urban population growth has a weaker explanatory power compared with industrial development. Economic density growth has a negative influence on urban land expansion. Economic density growth enables less land to carry higher economic output. Therefore, it can partly curb the low-density and decentralized expansion of urban land. However, its explanatory power on urban land expansion was relatively weak. The results also show that the proximity to urban centers negatively influences urban land expansion. High proximity to urban centers implies that construction land is extremely limited, resulting in a slowdown and even stagnancy in land expansion. In areas far from central urban areas, there is abundant available land; therefore, the urban land is likely to expand further. Compared with other factors, the proximity to urban centers is far less closely related to urban land expansion.

3.2.2 Influencing factors for industrial parks expansion

The regression analysis of influencing factors of the expansion of industrial parks shows that both the SLM and SEM tests are valid, and the estimation results of the two models are consistent. However, the driving factors for expansion in industrial parks differ from those of urban land. Among the six driving factors, only economic density growth, the value-added growth of secondary industries, and transportation infrastructure levels significantly influence land expansion in industrial parks (Table 4). The regression results of the remaining three factors are not significant. The geographical detector model revealed the degree of influence and explanatory power of driving factors on land expansion in industrial parks (Figure 6): the value-added growth of secondary industries (X3) (0.319), road network density (X6) (0.167), and economic density growth (X1) (0.113).
Table 4 Estimation results of regressions for industrial parks expansion
Spatial lag model Estimate Standard error z-value Probability
X1 -0.00050198*** 0.000126872 -3.9248 0.00018
X2 -0.009346 0.0413219 -0.190992 0.8563
X3 0.00512585*** 0.00167966 3.46513 0.0033
X4 0.00127305 0.0018791 0.831262 0.4501
X5 -2.13E-05 3.19E-05 -0.852367 0.3236
X6 0.051706*** 0.00876089 6.21325 0.0000
R-squared: 0.357898, Log likelihood: -563.69 for lag model; AIC: 1158.71;
Robust Lagrange multiplier test: 2.361 on 1 DF, p-value: 0.00000
Spatial error model Estimate Standard error z-value Probability
X1 -0.000510216*** 0.000135802 -3.91256 0.0006
X2 -0.0079802 0.0503251 -0.316875 0.82351
X3 0.00523016*** 0.001679853 3.56137 0.00189
X4 0.00212331 0.00176802 0.88907 0.45058
X5 -2.09E-05 2.89E-05 -0.921336 0.35001
X6 0.0459817*** 0.00870961 5.97982 0.0000
R-squared: 0.346593, Log likelihood: -567.69 for error model; AIC: 1152.69;
Robust Lagrange multiplier test: 1.259 on 1 DF, p-value: 0.00000
Figure 6 The power of determinant for the three factors affecting the industrial parks expansion
Specifically, the value-added growth of secondary industries has a positive influence and is most closely related to land expansion in industrial parks, indicating that the continuous development of secondary industries remains an important driving force in the region. Between 2000 and 2020, over 60 districts and counties in Tianjin and Hebei have witnessed an industrial park scale expansion of more than fivefold. Beijing’s service, hi-tech, and cultural industries are highly developed, while Tianjin and Hebei still actively develop the manufacturing industry (especially the advanced manufacturing industry). Tianjin and Hebei are important hinterlands for receiving the transfer of industries from Beijing. Therefore, their industrial parks play an essential role in gathering various production factors and promoting the transformation and upgrading of traditional manufacturing industries, which are driven to expand continuously by secondary industries. Transportation infrastructure level has no significant influence on urban land expansion but is positively correlated with industrial parks expansion. The continuous improvement of transportation infrastructure increases travel convenience and can promote the spillover of high-quality industries from industrial parks, thus significantly promoting the expansion and development of industrial parks in surrounding cities. Using the national highway as an example, the author employed buffer analysis to quantitatively assess industrial park land expansion within a specified range on both sides of the national highway. The findings reveal a distinct spatial attraction effect of the national highway on major industrial parks in the Beijing-Tianjin-Hebei region. Industrial parks in regions with a high density of the national highway network exhibit pronounced expansion characteristics along the national highway. Illustratively, Beijing’s 101 National Highway, 102 National Highway, and 104 National Highway passing through Daxing district are focal points for industrial park construction and expansion. Tianjin’s national highway network demonstrates considerable density, contributing significantly to the expansion of major development zones along these highways. In Hebei, the construction of National Highway 102 and National Highway 307 has similarly propelled the development of surrounding zones. Enhanced traffic infrastructure not only alters regional dynamics but also facilitates industry and population concentration along the route. This, in turn, influences the selection of sites and spatial layout for industrial parks. Additionally, areas closer to the traffic road enjoy higher regional land space accessibility, making it easier to catalyze the development and redevelopment of land resources. Economic density growth negatively influences land expansion in industrial parks, but its degree of influence is weaker compared with the other two factors. The Beijing-Tianjin-Hebei region’s economic development still relies largely on industries’ development. In the large-scale development of industrial parks, efficiency is not yet the priority.

3.3 Comparative analysis of driving forces for two types of urban land expansion

Figure 7 briefly shows the differences in the driving factors of the two types of urban land expansion. First, both the urban and industrial parks fall under urban construction land, but different driving factors influence their expansion. For example, urban population growth, the value-added growth of tertiary industries, and proximity to urban centers significantly influence urban land expansion but not in industrial parks. Urban population growth and the development of tertiary industries spark increasing demands for infrastructure and public service. Compared with industrial parks, urban land belongs to the key carriers of various public facilities (e.g., livelihood, transportation, and commercial facilities). The increasing demand for public facilities inevitably entails more built-up space. Therefore, the two factors have a significant positive driving effect on expansion of urban land. Industrial parks essentially represent a spatial agglomeration pattern shaped by industrial production and transaction behaviors (Wang et al., 2021; Chen et al., 2022). Thus, expansion of industrial parks is not significantly driven by urban population growth and the development of tertiary industries. Additionally, the proximity to urban centers estimated by the regression model negatively influences land expansion in industrial parks, but such influence does not pass the significance test. The reason is easy to understand. On the one hand, industrial parks are usually located far from urban centers. On the other hand, along with socioeconomic development and the expansion of urban development radius, industrial parks attach increasing importance to integration with urban areas to alleviate the “industry-city separation”. The results of this study show that in the Beijing-Tianjin-Hebei region, the proximity to urban centers is not the main driving factor for land expansion in industrial parks and that industry-city integration has become a dominant principle. Likewise, some driving factors for industrial parks’ expansion does not necessarily have a significant influence on urban land. For example, high road network density has a certain influence on land expansion in industrial parks but not in urban land. Although the layout of transportation networks has a guiding effect on the whole urban area’s expansion (Wang et al., 2020b), the urban land is often historically continuous and follows the basic principle of contiguous development (Hu et al., 2008), which is not closely related to the increase in road network density.
Figure 7 Frame diagram for comparative analysis of driving forces for two types of built-up land expansion
Second, there are certain differences in the relative importance between driving factors that can influence the expansion of both types land. In this study, the value-added growth of secondary industries can drive both types of land expansion. However, the value-added growth of secondary industries is the dominant driving force for land expansion in industrial parks but not in urban land. This is closely related to the key functional attributes of urban land and industrial parks. In the Beijing-Tianjin-Hebei region, the manufacturing and heavy chemical industries account for the vast majority of secondary industries, and industrial parks are the main carriers of such dominant industries. To promote the integrated development of the region, most cities have attempted to expand and strengthen industrial parks but not the urban land. Therefore, the development of secondary industries is the common driving force for both types of land expansion, but its relative importance is different for each. Additionally, economic density growth has a negative influence on both types of land expansion, but its influence in urban land is more significant than in industrial parks. Land in most cities tends to be exhausted, and land efficiency for economic density growth more significantly promotes the transformation of land expansion in urban land areas. Currently, industrial parks are still actively developed in the Beijing-Tianjin-Hebei region as an important platform for industrial transformation, and economic density growth plays a limited role in its expansion.

4 Discussion

4.1 Evolution of different urban construction land is affected by urbanization and industrialization, but the impact is different

The evolution of urban space is driven by urbanization and industrialization. As the most core part of urban area, urban land area carries the core functions of urban development. It is often a comprehensive agglomeration area of population, material, energy, information and other factors. Its spatial expansion is one of the most intuitive manifestations of the urbanization process. Urbanization is undoubtedly the key driving force for the expansion of urban land areas. At the same time, the advancement of industrialization has brought about the evolution of various types of productive land, including industrial land. As the main spatial carrier of regional productivity agglomeration and industrial layout, the development and expansion of industrial parks are bound to be affected by the industrialization process. Urbanization and industrialization influence each other and complement each other, so the evolution of urban land use and industrial parks will be driven by these two processes. As mentioned above, due to the different functions of the two types of land, urbanization and industrialization will inevitably have different impacts on their expansions. Exploring the differences of the driving factors derived from urbanization and industrialization in their spatial evolution is of certain significance for grasping the dynamic development of industry-city relationship and promoting their coordinated development.

4.2 Policy implications

According to the above analysis, it is necessary to implement differentiated land utilization policies for the two types of urban construction land to ensure scientific and orderly land utilization, and promote the optimization of productivity layout in the Beijing-Tianjin-Hebei region.
For utilization in urban land areas, it is necessary to coordinate the allocation of regional land resources according to the needs of urban positioning, urban functions, structural adjustment, and industrial transfers. Beijing should actively tap the land potential of existing resource-intensive and labor-intensive industries in built-up areas, use such land for the development of high-grade, precision, and advanced industries and attain the “negative growth” of the total utilized land in built-up areas. Tianjin should reasonably control the scale of central urban areas, refocus urban functions on headquarter business, culture and tourism, technological innovations, and advanced manufacturing, strengthen efforts in “withdrawing from secondary industries and encouraging tertiary industries” in urban areas, optimize industrial structures, and promote the transformation of economic growth patterns. Hebei should adjust the layout of land utilization between cities to form an efficient urban system, and build an urban development pattern with a reasonable layout and moderate scale. Overall, it is necessary to improve the intensiveness of land utilization, exert the guiding effect of economic and industrial restructuring on land supply, curb the inefficient expansion of built-up areas, and develop an intensive and connotative urban development mode.
In the context of the transformation of development modes, Beijing should encourage industrial upgrading, revitalize idle or inefficient land in industrial parks, introduce high-grade, precision, and advanced industries, improve the quality and efficiency of the stock of land, and boost the quality of industrial park development. Moreover, it is necessary to accelerate the reduction and withdrawal of scattered and inefficient industrial warehouse land outside the boundaries of urban development, promote the agglomeration and intensive utilization of industrial land, and fully utilize space resources to satisfy the needs of industrial transformation and upgrades. Tianjin should strengthen its efforts to “withdraw from secondary industries and encourage tertiary industries” in industrial parks and main urban areas. Tianjin should further promote the efficient and economical utilization of land in industrial parks, reduce the cost of land, and encourage enterprises to invest more in business activities (e.g., R&D and production). Hebei should strengthen industrial matchmaking and cooperation, reserve sufficient land for industrial transfers, fully consider the scale of industrial development, guarantee land supply for industrial projects, and increase the carrying capacity of industrial parks. Furthermore, it is necessary to upgrade industrial levels, and improve the economic output of land.
It is necessary to strengthen the interconnection of transportation infrastructure across the Beijing-Tianjin-Hebei region, increase the traffic accessibility of industrial parks around core cities to receive industrial transfers, and direct industrial parks to develop and expand in an orderly manner. Additionally, it is necessary to build high-quality industrial parks, encourage population migration to industrial parks and new districts, and improve the aggregation capacity and land efficiency of industrial parks.

4.3 Strengths and limitations

In the late stage of China’s rapid urbanization, with the increasingly prominent scarcity of land resources, the urban expansion will be limited to a large extent. How to promote urban expansion in an orderly manner and realize the efficient and intensive use of land resources has always been a concern. In particular, differentiated management and precise control strategies of diversified urban land expansion have become important issues. One of the preconditions to solve this problem is to clarify the driving mechanism of various types of urban land. Many studies have shown that economic development, population growth, urbanization, industrial development, transportation, and location are the main drivers of urban expansion (Mou et al., 2007; Chen et al., 2012; Li et al., 2018a; Huang et al., 2021). However, few studies have comparatively discussed the differentiated driving forces of the expansion of different types of typical urban land. As two important spatial carriers in urban development, urban land and industrial parks have different development processes and functional attributes. For example, with the enhancement of regional development maturity, the potential of urban extension expansion is relatively small, and spatial expansion pays more and more attention to improving economic benefits. As the main carrier of the production function of urban development, industrial parks have a strong demand for urban space resources due to industrial development. Along with the increasingly diversified functions of the parks, many urban factors besides production activities are also clustered within the park, which will lead to diversifying driving factors for its expansion. With the integration of industry and city increasingly becoming an important driving force for sustainable urbanization development, industrial parks gradually become the new growth pole of the city, which is increasingly closely connected with the main urban area from all aspects. The correlation or heterogeneity of driving forces for their expansion will become increasingly significant.
To analyze the differentiated driving forces for diverse types of urban land expansion comparatively, we selected several representative indicators (e.g., economic level, population, industry, and spatial location). Many studies have considered physical geographic factors (e.g., altitude and slope), which form the foundation for regional development and create certain boundaries for the layout of socioeconomic factors. However, some studies hold that the influence of physical geographic factors on urban land expansion is diminishing as technologies continue to advance (Li et al., 2018b). This study examined urban land change and its driving factors in the Beijing-Tianjin-Hebei city cluster from 2000 to 2020. During the study period, the evolutionary patterns of related spatial factors existed within the pre-defined range of diverse natural factors, and spatial regression estimation was conducted on two natural factors including elevation and slope. The results show that the effect of natural factors on urban land expansion is extremely nonsignificant. Therefore, this study concluded that natural factors do not constitute a major driving force for the expansion and evolution of urban construction land in the study area; hence, natural factors were not ultimately introduced in the spatial regression model. Nevertheless, policy factors (e.g., regional and industrial policies and planning) have a remarkable effect on urban land changes. To ensure the applicability of measuring methods, we did not select unquantifiable indicators such as policy factors. Subsequent studies may further improve the selection of driving indicators and explore the differentiated role of policy factors in guiding and regulating diverse types of construction land expansion.

5 Conclusions

Using spatial econometric regression and geographical detector models, this study identified the driving factors for two types of urban land expansion (main urban areas and industrial parks) in the Beijing-Tianjin-Hebei region and preliminarily explored their differentiated driving mechanisms. The results show that significant differences in the driving forces between the two types of urban land expansion in terms of the types of driving factors and degree of influence. Overall, the development of industries and the evolution of industrial structures have a significant effect on both types of urban land expansion. However, land expansion in urban land is more significantly influenced by the development of tertiary industries, while land expansion in industrial parks is more significantly influenced by the development of secondary industries. The optimization of industrial structures has a guiding effect on the orderly expansion of urban land. Urban population growth can spur the spatial expansion of main urban areas but has no significant effect on industrial parks. To promote industry-city integration, it is necessary to encourage population migration moderately to new urban areas and cities. This study discussed the differentiated driving forces for diverse types of typical urban land expansion. Our study quantitatively analyzed the direction of influence and explanatory power of related driving factors, and enriched and extended existing studies on the driving forces of urban expansion to some extent.
[1]
Angel S, Lamson-Hall P, Blei A et al., 2021. Densify and expand: A global analysis of recent urban growth. Sustainability, 13(7): 3835.

DOI

[2]
Bhagyanagar R, Kawal B M, Dwarakish G S et al., 2012. Land use/land cover change and urban expansion during 1983-2008 in the coastal area of Dakshina Kannada district, South India. Journal of Applied Remote Sensing, 6(1): 063576.

[3]
Braimoh A K, Onishi T, 2007. Spatial determinants of urban land use change in Lagos, Nigeria. Land Use Policy, 24(2): 502-515.

DOI

[4]
Chakraborty S, Dadashpoor H, Novotný J et al., 2022a. In pursuit of sustainability-spatio-temporal pathways of urban growth patterns in the world’s largest megacities. Cities, 131: 103919.

DOI

[5]
Chakraborty S, Maity I, Dadashpoor H et al., 2022b. Building in or out? Examining urban expansion patterns and land use efficiency across the global sample of 466 cities with million+ inhabitants. Habitat International, 120: 102503.

DOI

[6]
Chakraborty S, Maity I, Patel P P et al., 2021. Spatio-temporal patterns of urbanization in the Kolkata urban agglomeration: A dynamic spatial territory-based approach. Sustainable Cities and Society, 67: 102715.

DOI

[7]
Chen J, Chang K, Karacsonyi D et al., 2014. Comparing urban land expansion and its driving factors in Shenzhen and Dongguan, China. Habitat International, 43: 61-71.

DOI

[8]
Chen W, Su Z, Wang Y et al., 2022. Do the rank difference of industrial development zones affect land use efficiency? A regional analysis in China. Socio-Economic Planning Sciences, 80: 101168.

DOI

[9]
Chen Y F, Xie Q H, Liu Y S, 2012. Construction land area changes and their influencing factors of China. Progress in Geography, 31(8): 1050-1054. (in Chinese)

DOI

[10]
Dursun M, Goker N, Tulek B D, 2019. Efficiency analysis of organized industrial zones in Eastern Black Sea Region of Turkey. Socio-Economic Planning Sciences, 68: 100659.

DOI

[11]
Fang X, Su D, Wu Q et al., 2023. Dynamic changes in urban land spatial inequality under the core-periphery structure in urban agglomerations. Journal of Geographical Sciences, 33(4): 760-778.

DOI

[12]
Gao S, Wang S, 2023. Do development zones increase urban land use intensity? Empirical analysis from 235 cities in China. Applied Geography, 156: 103001.

DOI

[13]
Gong J, Hu Z, Chen W et al., 2018. Urban expansion dynamics and modes in metropolitan Guangzhou, China. Land Use Policy, 72: 100-109.

DOI

[14]
Gong P, Li X, Zhang W, 2019. 40-year (1978-2017) human settlement changes in China reflected by impervious surfaces from satellite remote sensing. Science Bulletin, 64: 756-763.

DOI PMID

[15]
Güneralp B, Lwasa S, Masundire H et al., 2017. Urbanization in Africa: Challenges and opportunities for conservation. Environmental Research Letters, 13(1): 015002.

DOI

[16]
Güneralp B, Reba M, Hales B U et al., 2020. Trends in urban land expansion, density, and land transitions from 1970 to 2010: A global synthesis. Environmental Research Letters, 15(4): 044015.

DOI

[17]
Hu Y, Wu Z, Xiong W et al., 2008. Study on the method of defining urban built-up area: A case study of Wuhan City. Planning Review, 32(4): 88-91. (in Chinese)

[18]
Huang C, Zhuang Q, Meng X et al., 2021. An improved nightlight threshold method for revealing the spatiotemporal dynamics and driving forces of urban expansion in China. Journal of Environmental Management, 289: 112574.

DOI

[19]
Huang D, Jin H, Zhao X, 2014. Determinants of land conversion to urban uses in Changping district, Beijing. Resources Science, 36(3): 454-462. (in Chinese)

[20]
Jia M, Liu Y, Lieske S N et al., 2020. Public policy change and its impact on urban expansion: An evaluation of 265 cities in China. Land Use Policy, 97: 104754.

DOI

[21]
Josef N, Saurav C, Indranil M, 2022. Urban expansion of the 43 worlds’ largest megacities: A search for unified macro-patterns. Habitat International, 129: 102676.

DOI

[22]
Kang L, Ma L, 2021. Expansion of industrial parks in the Beijing-Tianjin-Hebei Urban Agglomeration: A spatial analysis. Land, 10: 1118.

DOI

[23]
Li C, Zhao J, Xu Y, 2016. Examining spatiotemporally varying effects of urban expansion and the underlying driving factors. Sustainable Cities and Society, 28: 307-320.

DOI

[24]
Li G, Sun S A, Fang C L, 2018a. The varying driving forces of urban expansion in China: Insights from a spatial-temporal analysis. Landscape and Urban Planning, 174: 63-77.

DOI

[25]
Li J, Liu Y, Yang Y et al., 2018b. Spatial-temporal characteristics and driving factors of urban construction land in Beijing-Tianjin-Hebei region during 1985-2015. Geographical Research, 37(1): 37-52. (in Chinese)

[26]
Li X, Zhou W, Ouyang Z, 2013. Forty years of urban expansion in Beijing: What is the relative importance of physical, socioeconomic, and neighborhood factors? Applied Geography, 38(1): 1-10.

DOI

[27]
Liu J, Xu Q, Yi J et al., 2022. Analysis of the heterogeneity of urban expansion landscape patterns and driving factors based on a combined Multi-Order Adjacency Index and Geodetector model. Ecological Indicators, 136: 108665.

DOI

[28]
Liu S, He S, 2002. A spatial analysis model for measuring the rate of land use change. Journal of Natural Resources, 17(5): 533-540. (in Chinese)

DOI

[29]
Liu T, Cao G, 2010. Progress in urban land expansion and its driving forces. Progress in Geography, 29(8): 927-934. (in Chinese)

DOI

[30]
Liu X, Huang Y, Xu X et al., 2020. High-spatiotemporal-resolution mapping of global urban change from 1985 to 2015. Nature Sustainability, doi: 10.1038/s41893-020-0521-x.

[31]
Long Y, Gu Y, Han H, 2012. Spatiotemporal heterogeneity of urban planning implementation effectiveness: Evidence from five urban master plans of Beijing. Landscape and Urban Planning, 108: 103-111.

DOI

[32]
Luo J, Wei Y, 2009. Modeling spatial variations of urban growth patterns in Chinese cities: The case of Nanjing. Landscape and Urban Planning, 91: 51-64.

DOI

[33]
Ma Y, Xu R, 2010. Remote sensing monitoring and driving force analysis of urban expansion in Guangzhou city, China. Habitat International, 34(2): 228-235.

DOI

[34]
Mou F, Zhang Z, Chi Y et al., 2007. Dynamic monitoring of built-up area in Beijing during 1973-2005 based on multi-original remote sensed images. Journal of Remote Sensing, 11(2): 257-268. (in Chinese)

[35]
Osman T, Divigalpitiya P, Arima T, 2016. Driving factors of urban sprawl in Giza Governorate of Greater Cairo Metropolitan Region using AHP method. Land Use Policy, 58: 21-31.

DOI

[36]
Qiao W, Gao J, Guo Y et al., 2019. Multi-dimensional expansion of urban space through the lens of land use: The case study of Nanjing city, China. Journal of Geographical Sciences, 29(5): 749-761.

DOI

[37]
Ramachandra T V, Aithal B H, Sanna D D, 2012. Insights to urban dynamics through landscape spatial pattern analysis. International Journal of Applied Earth Observation and Geoinformation, 18(114): 329-343.

DOI

[38]
Rifat S A A, Liu W, 2019. Quantifying Spatiotemporal patterns and major explanatory factors of urban expansion in Miami metropolitan area during 1992-2016. Remote Sensing, 11(21): 2493.

DOI

[39]
Simkin R, Seto K. C, McDonald R I et al., 2022. Biodiversity impacts and conservation implications of urban land expansion projected to 2050. Proceedings of the National Academy of Sciences, 119(12): e2117297119.

DOI

[40]
Song Y, Yeung G, Zhu D et al., 2021. Spatial-temporal patterns and driving factors of urban land use efficiency at county level in Beijing-Tianjin-Hebei Urban Agglomeration. China Land Science, 35(3): 69-78. (in Chinese)

[41]
Sun Y, Ma A, Su H et al., 2020. Does the establishment of development zones really improve industrial land use efficiency? Implications for China’s high-quality development policy. Land Use Policy, 90: 104265.

DOI

[42]
Tian G J, Liu J, Xie Y et al., 2005. Analysis of spatio-temporal dynamic pattern and driving forces of urban land in China in 1990s using TM images and GIS. Cities, 22(6): 400-410.

DOI

[43]
Tu Y, Chen B, Yu L et al., 2021. How does urban expansion interact with cropland loss? A comparison of 14 Chinese cities from 1980 to 2015. Landscape Ecology, 36(1): 243-263.

DOI

[44]
Wang H, Zhang B, Liu Y et al., 2020a. Urban expansion patterns and their driving forces based on the center of gravity-GTWR model: A case study of the Beijing-Tianjin-Hebei urban agglomeration. Journal of Geographical Sciences, 30(2): 297-318.

DOI

[45]
Wang J, Li X, Christakos G et al., 2010. Geographical detectors-based health risk assessment and its application in the neural tube defects study of the Heshun region, China. International Journal of Geographical Information Science, 24: 107-127.

DOI

[46]
Wang J, Xu C, 2017. Geodetector: Principle and prospective. Acta Geographica Sinica, 72(1): 116-134. (in Chinese)

DOI

[47]
Wang L, Wang K, Zhang J et al., 2020b. Multiple objective-oriented land supply for sustainable transportation: A perspective from industrial dependence, dominance and restrictions of 127 cities in the Yangtze River Economic Belt of China. Land Use Policy, 99: 105069.

DOI

[48]
Wang T, Zhang M, Springer C et al., 2021. How to promote industrial park recycling transformation in China:An analytic framework based on critical material flow. Environmental Impact Assessment Review, 87: 106550.

[49]
Wang Z, Kong X, Cheng P et al., 2022. Spatiotemporal evolution of national development zones and their impact on urban land growth in China. Journal of Geographical Sciences, 32(8): 1451-1470.

DOI

[50]
Wang Z, Lu C, 2018. Urban land expansion and its driving factors of mountain cities in China during 1990-2015. Journal of Geographical Sciences, 28(8): 1152-1166.

DOI

[51]
Wei Y, Leung C, 2005. Development zones, foreign investment, and global city formation in Shanghai. Growth and Change, 36: 16-40.

DOI

[52]
Wong S, Tang B, 2005. Challenges to the sustainability of ‘development zones’: A case study of Guangzhou Development District, China. Cities, 22(4): 303-316.

DOI

[53]
Xiong C, Tan R, Yue W, 2018. Discussion on different driving factors of diversified construction land expansion in rapid urbanization area: A case study of Yiwu city. Journal of Natural Resources, 33(12): 2124-2135. (in Chinese)

DOI

[54]
Yang C, Li Q, Hu Z et al., 2019. Spatiotemporal evolution of urban agglomerations in four major bay areas of US, China and Japan from 1987 to 2017: Evidence from remote sensing images. Science of the Total Environment, 671: 232-247.

[55]
Yue W, Liu Y, Fan P, 2013. Measuring urban sprawl and its drivers in large Chinese cities: The case of Hangzhou. Land Use Policy, 31: 358-370.

DOI

[56]
Zhao C, Jensen J, Zhan B, 2017. A comparison of urban growth and their influencing factors of two border cities: Laredo in the US and Nuevo Laredo in Mexico. Applied Geography, 79: 223-234.

[57]
Zheng Y, He Y, Zhou Q et al., 2022. Quantitative evaluation of urban expansion using NPP-VIIRS nighttime light and Landsat spectral data. Sustainable Cities and Society, 76: 103338.

DOI

[58]
Zhuang L, Ye C, 2020. Changing imbalance: Spatial production of national high-tech industrial development zones in China (1988-2018). Land Use Policy, 94: 104512.

DOI

[59]
Zhuang L, Ye C, 2023. More sprawl than agglomeration: The multi-scale spatial patterns and industrial characteristics of varied development zones in China. Cities, 140: 104406.

DOI

Outlines

/