
Journal of Geographical Sciences >
Uphill cropland and stability assessment of gained cropland in China over the preceding 30 years
|
He Tingting (1986-), PhD, specialized in remote sensing of cropland. E-mail: tthe@zju.edu.cn |
Received date: 2023-03-13
Accepted date: 2023-11-09
Online published: 2024-04-24
Supported by
Zhejiang Provincial Philosophy and Social Science Planning Project(24JCXK04YB)
Natural Science Foundation of Zhejiang Province(Q22D018818)
Zhejiang Provincial Postdoctoral Research Foundation(ZJ2023051)
In recent years, cropland development in high-slope regions in China has alleviated the contradiction between total cropland balance and insufficient development space. However, this change in cropland slope brings risks to sustainable resource utilization. This study explored the slope characteristics of cropland in China from 1990 to 2020 and assessed the gained cropland stability. The results showed that (1) From 1990 to 2020, the lost cropland area was greater than the gained area, and the distribution showed an uphill trend. (2) The areas with a significant upslope change in cropland were mainly concentrated in the southern plain, containing the central grain-producing regions at its core and other well-developed eastern coastal areas. (3) The areas with distinct downslope cropland changes were mainly concentrated in the upper reaches of the Yangtze and Yellow rivers and the ecologically fragile areas of Inner Mongolia and the Loess Plateau. (4) The gained cropland stability was unsatisfactory; about one-third of the gained cropland was unstable, which had the highest abandonment rate within 5 years, and the gained cropland stability decreased with the slope. In addition, this study explored cropland conversion types at different slopes in different regions and discussed the reasons for slope cropland changes and gained cropland instability in different regions. Finally, optimization policies were proposed to protect and control newly gained cropland.
Key words: cropland conversion; uphill; slope; stability; China
HE Tingting , LI Jianhua , ZHANG Maoxin , ZHAI Ge , LU Youpeng , WANG Yanlin , GUO Andong , WU Cifang . Uphill cropland and stability assessment of gained cropland in China over the preceding 30 years[J]. Journal of Geographical Sciences, 2024 , 34(4) : 699 -721 . DOI: 10.1007/s11442-024-2224-0
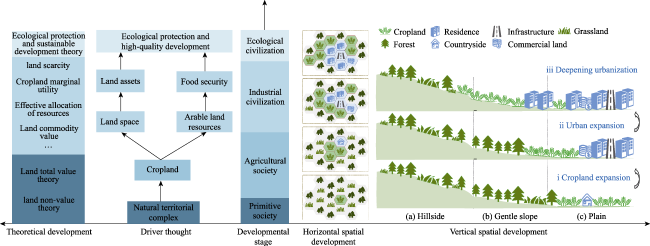
Figure 1 Theoretical analysis of cropland up the hill |
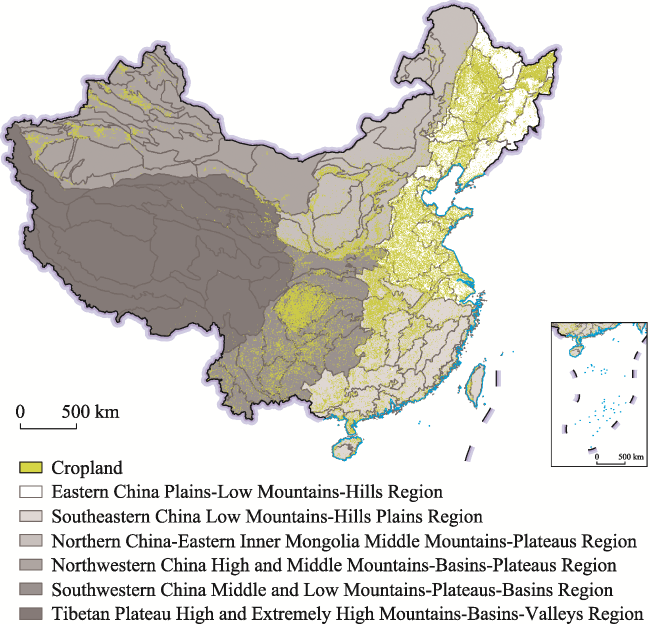
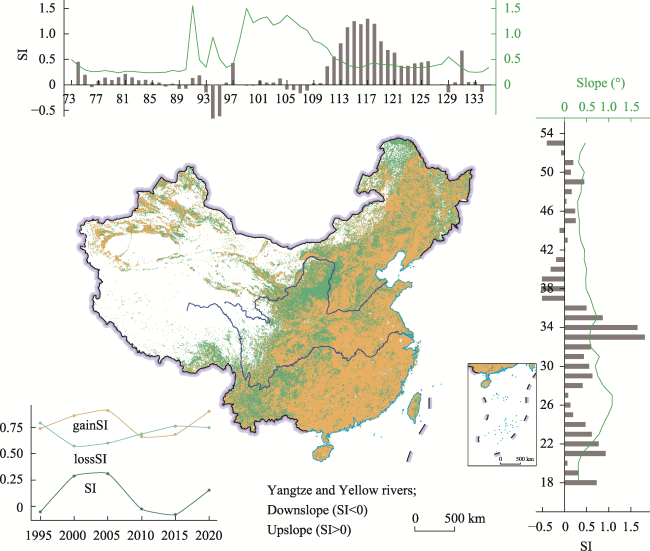
Figure 2 Cropland distribution in China (2020) |
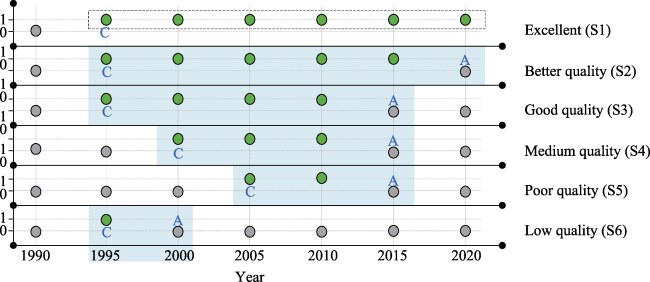
Figure 3 Stability assessment process and grading |
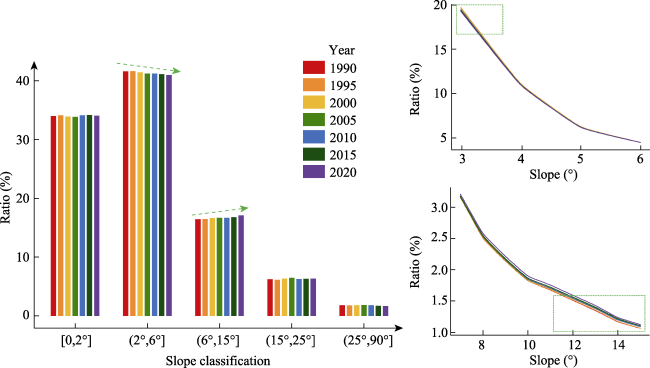
Figure 4 Proportion of cropland distributed on different slopes in China (1990-2020) |
Table 1 The gain and loss of cropland on different slopes |
| Slope | The change of cropland area (km2) | The gain | The loss | ||
|---|---|---|---|---|---|
| Area (km2) | Ratio (%) | Area (km2) | Ratio (%) | ||
| [0°, 2°] | -28,580.01 | 68,251.43 | 22.87 | 96,831.44 | 25.11 |
| (2°, 6°] | -48,387.86 | 86,835.97 | 29.10 | 135,223.82 | 35.07 |
| (6°, 15°] | -2312.25 | 81,538.20 | 27.32 | 83,850.46 | 21.75 |
| (15°, 25°] | -3539.20 | 46,006.60 | 15.42 | 49,545.80 | 12.85 |
| (25°, 90°] | -4366.02 | 15,778.66 | 5.29 | 20,144.68 | 5.22 |
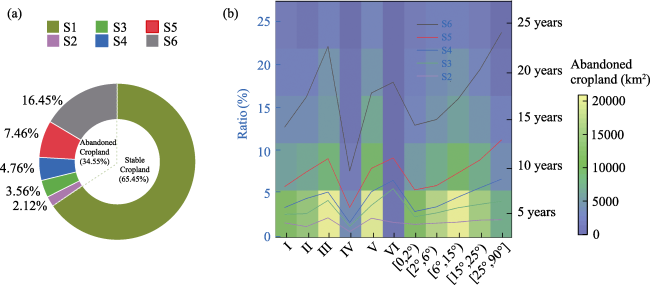
Figure 5 Slope fluctuation of gained and lost cropland from 1990 to 2020, and the average slope of cropland at each degree |
Table 2 Area and proportional of cropland in different landscape regions (1990-2020) |
| Region | 1990 | 1995 | 2000 | 2005 | 2010 | 2015 | 2020 | ||||||||
|---|---|---|---|---|---|---|---|---|---|---|---|---|---|---|---|
| Area (104 km2) | Ratio (%) | Area (104 km2) | Ratio (%) | Area (104 km2) | Ratio (%) | Area (104 km2) | Ratio (%) | Area (104 km2) | Ratio (%) | Area (104 km2) | Ratio (%) | Area (104 km2) | Ratio (%) | ||
| I | 88.06 | 44.61 | 88.08 | 44.83 | 86.83 | 44.51 | 84.76 | 44.12 | 83.51 | 44.11 | 83.47 | 43.91 | 82.52 | 43.74 | |
| II | 38.49 | 19.50 | 37.73 | 19.20 | 37.25 | 19.10 | 37.21 | 19.37 | 36.02 | 19.03 | 36.08 | 18.98 | 36.63 | 19.42 | |
| III | 25.96 | 13.15 | 25.68 | 13.07 | 25.50 | 13.07 | 24.12 | 12.56 | 23.33 | 12.32 | 22.99 | 12.10 | 22.86 | 12.12 | |
| IV | 6.53 | 3.31 | 6.69 | 3.41 | 7.07 | 3.63 | 7.64 | 3.98 | 8.76 | 4.63 | 9.85 | 5.18 | 9.82 | 5.21 | |
| V | 36.92 | 18.70 | 36.93 | 18.79 | 37.01 | 18.97 | 37.02 | 19.27 | 36.34 | 19.19 | 36.38 | 19.14 | 35.55 | 18.84 | |
| VI | 1.43 | 0.72 | 1.36 | 0.69 | 1.43 | 0.73 | 1.35 | 0.70 | 1.36 | 0.72 | 1.31 | 0.69 | 1.29 | 0.68 | |
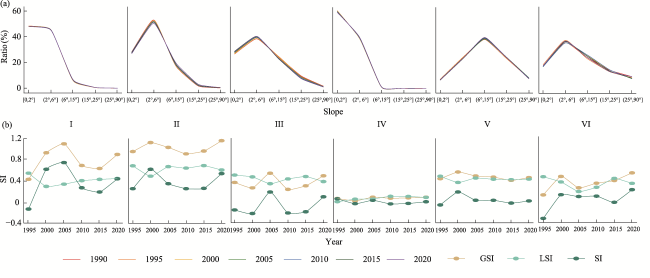
Figure 6 Slope characterisios of cropland distribution in iffrent rgions and slope fluctuation charaterisis of onvered copland(a.Pacenage of copand ara on difiratslopes;b.The fluctuation of cropland in different stages) |
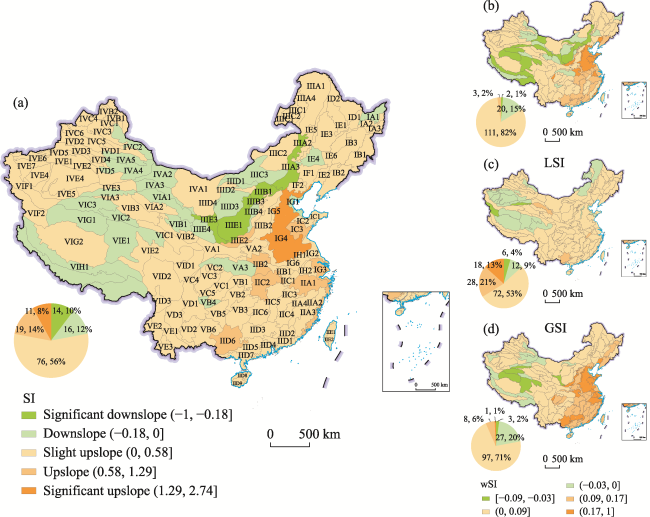
Figure 7 Extent of spatial variation in slope change of cropland in China (1990-2020) |
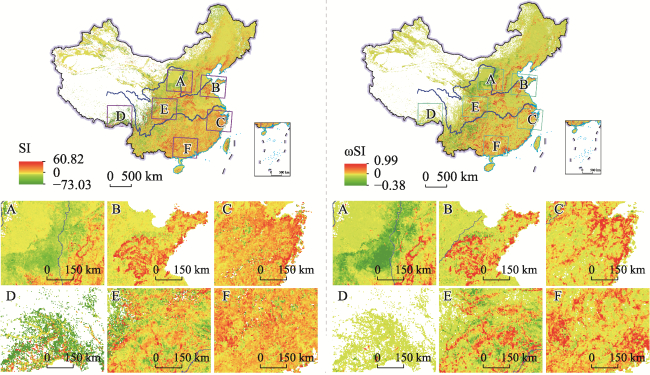
Figure 8 Spatial disturbance of SI (left) and ωSI (right) in China from 1990 to 2020. The cropland change areas were summarised as 5 km × 5 km grid. |
Figure 9 The stability levels and abandoned ratio of gained cropland on different slopes (a. The national scale; b. Region and slope-based perspective) |
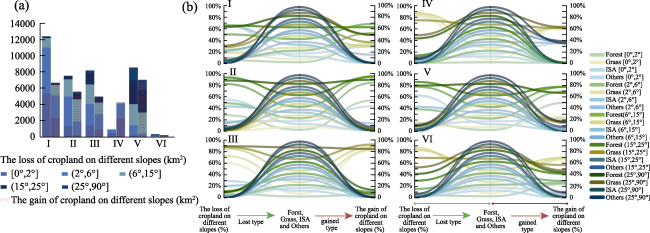
Figure 10 Conversion between the gain and loss of cropland with other land types (a. The gain and loss of cropland areas in different regions, respectively; b. Proportion of conversion types from lost and gain of cropland on different slopes) |
| [1] |
|
| [2] |
|
| [3] |
|
| [4] |
|
| [5] |
|
| [6] |
|
| [7] |
|
| [8] |
|
| [9] |
|
| [10] |
|
| [11] |
|
| [12] |
|
| [13] |
|
| [14] |
|
| [15] |
|
| [16] |
|
| [17] |
|
| [18] |
|
| [19] |
|
| [20] |
|
| [21] |
|
| [22] |
|
| [23] |
|
| [24] |
|
| [25] |
|
| [26] |
|
| [27] |
|
| [28] |
|
| [29] |
|
| [30] |
|
| [31] |
|
| [32] |
|
| [33] |
|
| [34] |
|
| [35] |
|
| [36] |
|
| [37] |
|
| [38] |
|
| [39] |
|
| [40] |
|
| [41] |
|
| [42] |
|
| [43] |
|
| [44] |
|
| [45] |
|
| [46] |
|
| [47] |
|
| [48] |
|
| [49] |
|
| [50] |
|
| [51] |
|
| [52] |
|
| [53] |
|
| [54] |
|
| [55] |
|
| [56] |
|
| [57] |
|
| [58] |
|
| [59] |
|
| [60] |
|
| [61] |
|
| [62] |
|
| [63] |
|
| [64] |
|
| [65] |
|
| [66] |
|
| [67] |
|
/
| 〈 |
|
〉 |