Research Articles

Spatiotemporal evolution of population exposure to multi-scenario rainstorms in the Yangtze River Delta urban agglomeration

  • ZHANG Yaru , 1, 2 ,
  • YAO Rui 1, 2, 3 ,
  • ZHU Zhizhou 1, 2 ,
  • JIN Hengxu 1, 2 ,
  • ZHANG Shuliang , 1, 2, *
Expand
  • 1. Key Laboratory of VGE of Ministry of Education, Nanjing Normal University, Nanjing 210023, China
  • 2. Jiangsu Center for Collaborative Innovation in Geographical Information Resource Development and Application, Nanjing 210023, China
  • 3. School of Geography and Tourism, Anhui Normal University, Wuhu 241002, Anhui, China
* Zhang Shuliang (1974-), PhD and Professor, specialized in urban flood modelling and simulation, flooding forecasting and application of GIS. E-mail:

Zhang Yaru (1998-), Master, specialized in urban flood simulation and flood risk assessment. E-mail:

Received date: 2023-05-22

  Accepted date: 2024-01-05

  Online published: 2024-04-24

Supported by

National Natural Science Foundation of China(42071364)

National Natural Science Foundation of China(42271483)

The Postgraduate Research & Practice Innovation Program of Jiangsu Province(KYCX22_1585)

Abstract

Population exposure is a dominant representation of rainstorm hazard risks. However, the refined precipitation data in temporal resolution and the comparison of exposure to different rainstorm events remain relatively unexplored. Hourly precipitation data from 165 meteorological stations w used to investigate the spatiotemporal evolution of population exposure to different rainstorm scenarios in the prefecture-level cities for different periods and age groups. The Geographical Detector was adopted to quantitatively analyze the influencing factors and contribution rates to changes in population exposure during each period. The results revealed that population exposure to persistent rainstorms and abrupt rainstorms was low in the center and high in the surrounding areas, and the high exposure value decreased significantly in the 2010s. Additionally, as the duration of rainstorm events increased, the center of the high-value area of population exposure shifted southward. The distribution of population exposure was closely related to the age structure, demonstrating strong consistency with the distribution of different age groups. Except for abrupt rainstorms, the contribution rates of the average land GDP and urbanization rate to the exposure of all rainstorm scenarios increased significantly. This implies that the main factors influencing population exposure have shifted from meteorological to socioeconomic factors.

Cite this article

ZHANG Yaru , YAO Rui , ZHU Zhizhou , JIN Hengxu , ZHANG Shuliang . Spatiotemporal evolution of population exposure to multi-scenario rainstorms in the Yangtze River Delta urban agglomeration[J]. Journal of Geographical Sciences, 2024 , 34(4) : 654 -680 . DOI: 10.1007/s11442-024-2222-2

1 Introduction

In recent years, global warming has triggered a series of extreme weather events, among which rainstorms have become one of the most widespread and catastrophic events, posing a significant threat to human survival and sustainable development (Liu et al., 2019). From June to July 2020, rainfall in the Yangtze River Basin surged, far exceeding the average precipitation over the previous stages. The rainstorms and the secondary floods caused 141 deaths, 28,000 flattened homes, and 3.53 million hectares of destroyed crops, with a direct socioeconomic loss of 11.76 billion US dollars (Takaya et al., 2020; Zhou et al., 2021). Therefore, an effective response to the adverse impacts of extreme rainstorms has become essential for disaster prevention, mitigation, and disaster risk management in China (Li et al., 2020).
Exposure is defined as what is adversely affected and destroyed during rainstorms, including people, livelihoods, resources, infrastructure, and economic, social, and cultural assets (Zheng et al., 2012). The assessment of rainstorm hazard risk is affected by the intensity, frequency and duration, and extent of rainstorm events as well as the exposure of the hazard-bearing body (Shen et al., 2022). The analysis of rainstorm hazard risk with the population as a hazard-bearing body has been a current research hotspot. Population exposure is usually represented by indicators, such as the number of affected populations or population density in the study area (Christenson et al., 2014; Jones et al., 2015). Furthermore, the impact range of disaster factors was introduced to narrow down the population exposed to extreme precipitation so that the indicator could be measured as disaster factors multiplied by the total population (Ta et al., 2022). In recent years, some studies have calculated the exposure by multiplying the disaster rate by the total population (Boussad et al., 2022; Li et al., 2022b). However, population exposure is related to several factors (Chen et al., 2020). Meteorological factors (including precipitation, atmospheric circulation, and air humidity), geographical factors (including terrain, slope, and underlying surface), human activities, and socioeconomic development have significant impacts on population exposure (Hauer et al., 2021; Li et al., 2021). Therefore, the interactions among disaster environments, disaster-bearing bodies, and disaster factors should be considered when defining population exposure (Jing et al., 2020; Hu et al., 2021; Li et al., 2022a). Jing et al. (2020) constructed a model of disaster rate using rainfall intensity and gross domestic product (GDP), and revealed the distribution pattern of population exposure to extreme precipitation events in Hubei province during different periods. This provided a new perspective for the accurate description of population exposure.
Previous literature has focused on investigating the spatiotemporal characteristics of population exposure and the influencing indicators. The study of the spatiotemporal characteristic change of population exposure aimed at analyzing the features of the exposed population in historical disaster events to determine the spatial and temporal variation patterns (Chen and Sun, 2019; Jiang et al., 2020; Zhang et al., 2020; Ma et al., 2022). For example, Zhang et al. (2018), based on CMIP51(1 Abbreviations: Coupled Model Intercomparison Project Phase 5 (CMIP5)) multi-model projections, found that the 0.5℃ reduction in warming would decrease areal and population exposures to once-in-20-year extreme precipitation events in the global monsoon region. In the rainstorm hazard assessments, different spatial scales have revealed specific distribution characteristics of population exposure with an overall trend of gradual refinement (Smith et al., 2019). The spatial and temporal distribution of population exposure changed dynamically, depending on the natural environment and climate factors such as degree of warming (Liao et al., 2019), extreme precipitation (Liao et al., 2022; Qin et al., 2023), and landcover types (Lin et al., 2020). Moreover, given the rapid development of society and the economy, many studies found that population density is the main factor affecting exposure (Mouri et al., 2013; Liao et al., 2019; Shen et al., 2022) and that the population exposure trend has been further exacerbated by increased urbanization, population growth, and accumulated wealth (Jongman et al., 2015). However, most of these studies on exposure assessment have been limited at the global, national, and coastal scales, and the relationship between rainstorms and population at the regional scale has not been discussed in depth. Especially in recent years, China has vigorously promoted the high-quality development of urban agglomerations (Chen et al., 2023). Thus, researches gradually converted to bridging the gap between the large global scale and the small urban scale, which studied the spatiotemporal distribution and the regional differences of population exposure to rainstorms in urban agglomerations.
The Yangtze River Delta urban agglomeration (YRDUA) is a typical rainstorm-prone area and a highly developed socioeconomic and densely populated region in China. Improving the capacity of the YRDUA to cope with rainstorm disasters is an important guarantee for enhancing the resilience of cities in the region and achieving regional integration and sustainable development. Understanding the population exposure and related influencing factors in each city in the region is the first step. Therefore, many scholars paid more attention to studying the population exposure to rainstorms in the YRDUA (Tang et al., 2023; Zhang et al., 2023). For example, Shen et al. (2022) investigated the spatiotemporal characteristics of daily, daytime, and nighttime population exposure to extreme precipitation events in the Yangtze River Delta and concluded that the significant increase in total exposure was mainly influenced by rapid population growth.
Most previous studies have concentrated on monthly and daily precipitation data to investigate exposure (Afuecheta and Omar, 2021; Qin et al., 2022; Shen et al., 2022), whereas hourly data have received less attention. Historical data show that most rainfall events occur only in one or several periods of the day, and rainstorm and flood disasters are often caused by extremely heavy rainfall over a short period. In the context of climate warming, the increase rate of short-term heavy rainstorms on an hourly scale may be greater than that of daily heavy rainstorms (Yin et al., 2011). Previous studies have found a good correspondence between rainstorm disasters and the temporal and spatial distribution of heavy hourly rainfall (Hitchens et al., 2013). The temporal resolution of precipitation data should be refined to provide a detailed description of the dynamic changes and process simulation for the exposed population during rainstorms. Meanwhile, little attention has been paid to investigating population exposure by considering multi-scenario rainstorms (Şen et al., 2017), especially the variation in the duration and intensity of rainstorms, which are important signals for the occurrence of severe population exposure. It should be noted that population exposure is not necessarily high in areas with high rainstorm intensity but is associated with rainstorm duration. The lack of multiple scenarios leads to weak applicability to different rainstorms, which fails to establish accurate and reliable rainstorm risk assessments and decisions. In addition to the more refined precipitation data and the multi-scenario rainstorms, it is simultaneously crucial to select appropriate influencing indicators to quantify the contribution rates according to regional characteristics. However, there are currently few studies that can quantify the contribution of each factor and provide the dynamic changes of exposure at the urban agglomeration scale. It is necessary to select appropriate indicators for quantitative analysis in order to highlight the factors that affect population exposure.
In this paper, based on the hourly precipitation data of the YRDUA from 1980 to 2020, this study explored the spatiotemporal evolution of population exposure to rainstorm events of different durations and discussed the exposure patterns in prefecture-level cities for different periods and age groups. We then used the Geodetector to quantitatively analyze the influencing factors and contribution rates to changes in population exposure during each period. This study provides a scientific and theoretical basis for urban management and rainstorm risk prevention.

2 Materials and methods

2.1 Study area and data sources

The YRDUA is located in the eastern coastal region of China, with a total area of 358,000 square kilometers, consisting of all cities in “three provinces (Jiangsu, Zhejiang, and Anhui) and one municipality (Shanghai).” The topography of the region is mainly plains, with a few hills in the western and southern parts (Xiao et al., 2022). It is densely covered with rivers and lakes and rich in water resources, as shown in Figure 1. The study area has an annual average temperature of 14-18℃ and precipitation of 1000-1500 mm (Wang et al., 2020b). The climate is typically subtropical featured with humidity and rain. The YRDUA is a rainstorm-prone and rainstorm-intensive Chinese region owing to subtropical monsoons and typhoons. In addition, it is the most economically developed and rapidly urbanizing city cluster with a particularly dense population. According to the National Bureau of Statistics of China (2020), the region has a GDP of 23.72 trillion yuan and 227 million permanent residents, accounting for nearly a quarter of the total economy and 16% of total population in China, respectively, which makes the region highly vulnerable to hydrometeorological disasters (Wu et al., 2016). Exposure research in the YRDUA will be helpful in strengthening the awareness of affected human risks in rainstorm hazards, so as to provide a reference for coastal urban agglomerations in rainstorm disaster prevention and reduction.
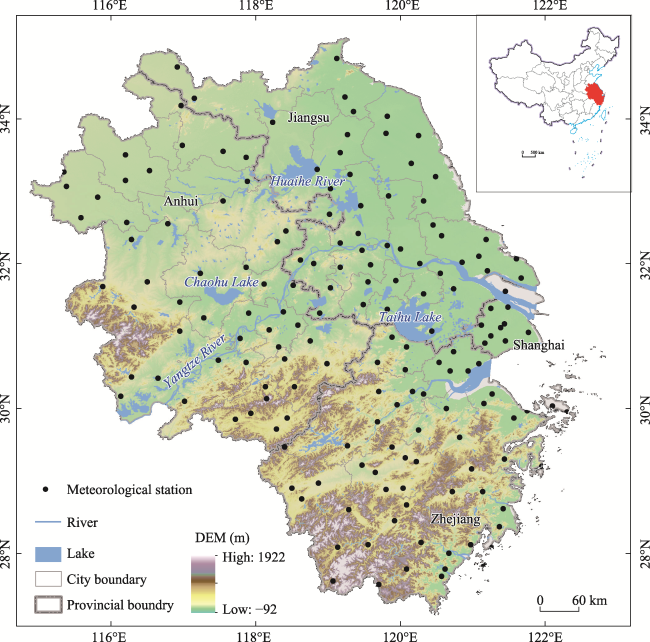
Figure 1 Location of the Yangtze River Delta urban agglomeration (YRDUA) and distribution of the 165 meteorological stations
The study collected hourly precipitation, socioeconomic, and elevation data from 1980 to 2020; detailed information is shown in Table 1.
Table 1 Description of the data used in the study
Category Data Source Description
Precipitation
data
Hourly
precipitation
China Meteorological
Administration
Hourly precipitation from 165 stations
Socio-economic
data
Population National demographic
yearbook and statistical
yearbook of provinces
Population at prefecture level, containing the total
permanent, at different age, and non-agricultural
population
GDP GDP per square kilometer of land at prefecture level
Urbanization rate Urbanization rate at prefecture level
Elevation data DEM The Unites States
Geological Survey
DEM data at a spatial resolution of 30 m based on
SRTM1
(1) Hourly precipitation data were obtained from the National Meteorological Information Centre of the China Meteorological Administration. To avoid missing data, the measurement rate was calculated for each station during the flood season (May to September). First, the time required that there be no missing testing years, and the hourly records in a year should not be less than 98% of the total hours in that year. Otherwise, the meteorological station would be eliminated, even though the data were complete at other times. Years with a missing test rate greater than 2% were defined as missing test years, and the stations with more than 1 missing test year were removed. The critical value for judging whether precipitation occurred was 0.1 mm, that is, the times when the hourly accumulated precipitation was greater than or equal to 0.1 mm were defined as precipitation times, otherwise no precipitation. Finally, hourly precipitation data from 165 stations during 1980-2020 across the YRDUA were selected for this study.
(2) The socioeconomic data contained the population, GDP, and urbanization rate, which were derived from the National Demographic Yearbook and the Shanghai, Jiangsu, Zhejiang, and Anhui statistical yearbooks. Prefecture-level cities were selected as the statistical units. Population data included indicators such as the number of permanent residents and the number and proportion of the population in different age groups and non-agricultural populations. The GDP per square kilometer of land was used in this study, which was calculated as the ratio of total regional GDP to land area. The urbanization rate was defined as the proportion of the non-agricultural population in prefecture cities.
(3) A digital elevation model (DEM) with a spatial resolution of 30 m based on SRTM12(2 Abbreviations: Shuttle Radar Topography Mission 1 (SRTM1)) was downloaded from the United States Geological Survey (https://earthexplorer.usgs.gov/). The DEM of the YREUA was dealt with by mosaicking and clipping according to the administrative boundaries (Shanghai, Jiangsu, Zhejiang, and Anhui).

2.2 Methods

2.2.1 Definition of multi-scenario rainstorms

In this study, two types of rainstorm events were calculated: the rainfall amount and duration. Population exposure under different continuous rainstorm events was then analyzed to identify the evolution rule of population exposure. The threshold value determining precipitation was set as 0.1 mm, and an hourly accumulation of rainfall more than or equal to 0.1 mm was defined as the precipitation time, otherwise, it was defined as no precipitation (Yu et al., 2013). The China Meteorological Administration defines a rainstorm event as an hourly rainfall of more than 16 mm or a 24-hour rainfall of more than 50 mm. The study thus defined daily rainstorm events (DR) at each station as precipitation greater than or equal to 50 mm in 24 hours.
We define persistent rainstorm events (PR) according to He et al. (2018) and Yao et al. (2022). The interval between two precipitation events is based on the criterion that no precipitation has occurred for five consecutive hours after precipitation time. There may be discontinuous no-precipitation periods during the precipitation events. A rainstorm was defined as a precipitation event of more than 16,990 mm of precipitation within one hour. The duration of a rainstorm event refers to the total number of hours between the start and end of precipitation. Using the method proposed by Yu et al. (2013) to determine the threshold value of rainstorms of different durations., this study defines short-duration (SDR [precipitation duration ≤6 h]), long-duration (LDR [precipitation duration 7-12 h]), and ultra- long-duration (UDR [precipitation duration ≥13 h]) rainstorm events. Abrupt rainstorm events (AR) were defined as periods of rainfall ≥ 50 mm within three consecutive hours and at least one hour of rainfall ≥ 20 mm (Chen et al., 2021). Definitions of the six rainstorm scenarios are presented in Table 2.
Table 2 Definition of rainstorm scenarios
Indices Name Definition
PR Persistent rainstorm events (mm) 1-hr PA > 16 mm
AR Abrupt rainstorm events (mm) 3-hr PA ≥ 50 mm and 1-hr PA ≥ 20 mm
DR Daily rainstorm events (mm) 24-hr PA ≥ 50 mm
SDR Short-duration rainstorm events (mm) 1-hr PA > 16 mm; PD ≤ 6 h
LDR Long-duration rainstorm events (mm) 1-hr PA > 16 mm; 7 h ≤ PD ≤ 12 h
UDR Ultra-long-duration rainstorm events (mm) 1-hr PA > 16 mm; PD ≥ 13 h

Note: PA (mm) and PD (h) represent the precipitation amount and precipitation duration, respectively.

2.2.2 Analysis of trend and correlation

The Modified Mann-Kendall method (Yue et al., 2002; Daufresne et al., 2009) was adopted to analyze the trend in the annual variation of the average rainstorm amounts, sum of rainstorm days, and population across the YRDUA. Trends were measured using Sen’s slope method, with positive and negative slope values indicating increasing and decreasing trends, respectively (Hofmann and Balakrishnan, 2006).

2.2.3 Population exposure to rainstorms

In conjunction with existing research, population exposure can be expressed as the number of people in the area where the hazard event occurred combined with the hazard event itself (Shen et al., 2022). We then defined the population exposure to multi-scenario rainstorms as follows: the rainstorm risk per unit multiplied by the total population in the unit; the expression is:
${{\text{E}}_{pop}}=\text{R}\times \text{POP}$
where Epop was the population exposure (person•mm•a–1) per unit (1 km$\times$1 km); R was the average annual rainstorm amount per unit (mm•a–1); and POP (person) referred to the number of permanent residents in the unit during the rainstorm hazard events. The calculated exposure results were then normalized, and the final exposure was considered to be in the range [0,1]. To better understand the distribution of exposure risks in the YRDUA, the natural breaks (Jenks) classification method to classify the exposure results and display them visually on the map. The natural breaks classification method (Cynthia and Linda, 2003) is a technique for dividing numerical data into different categories. It first sorts all values from small to large, and then finds natural discontinuities by calculating the average between each value and its adjacent value, thereby dividing the data into different groups with as little variation within each group as possible, while making the changes between different groups as large as possible. This method can be applied in many different fields and is widely used in risk assessment of natural disasters such as drought, rainstorms and floods (Huang et al., 2020). According to this, the population exposure levels were classified into five categories: extremely low exposure (I), low exposure (II), medium exposure (III), high exposure (IV), and extremely high exposure (V), which indicated the severity of population exposure to multi-scenario rainstorms (Man et al., 2014).

2.2.4 Rate of contribution to the exposure change

Geographical detector (Geodetector) (Wang et al., 2010; Wang et al., 2016) is a new spatial statistical method based on factor, ecological, interaction, and risk detectors to detect the influence of factors on the spatial variability of the target and reveal their drivers, which can be used to detect the determinants of dependent variables and the relative importance between factors. It is widely used to study the correlations between meteorological and geographic environmental factors. This study used the Geodetector to analyze the determinant drivers of population exposure to rainstorms in the YRDUA and quantify their respective contribution rates to assess the influence of each factor on exposure.
The Geodetector method is as follows: First, the raster layers of population exposure were analyzed by overlaying them with the raster layers of each driver variable. Different spatial categories of each variable were classified, and significance tests of the differences in the mean values of each factor were conducted to detect the influence of each driver variable on the spatial distribution and variation in population exposure. The q-Statistic model, which measures a spatial stratified heterogeneity and the contributions of each driver variable to the population exposure to rainstorms, is represented as follows:
$\text{q}=1-\frac{1}{N{{\sigma }^{2}}}\underset{h=1}{\overset{L}{\mathop \sum }}\,{{N}_{h}}\sigma _{h}^{2}$
where N denoted all municipal cells in the YRDUA; σ2 was the discrete variance of the whole region; L was the number of categories of drivers affecting the spatiotemporal distribution pattern of population exposure (h = 1, 2, …, L); q varied due to different discretization schemes for the drivers. Nh was the cell number of the population exposure grid affected by the h_th factor, and $\sigma _{h}^{2}$ was the cell variance of the population exposure grid affected by the h_th factor. The range of q values was [0,1]. The larger the q value, the stronger the influence of the driver on the distribution and variation in exposure. When q=1, the spatial distribution of the population exposure was completely controlled by the driver; when q=0, the driver had no influence on the spatial distribution of the population exposure.

3 Results

3.1 Changes of rainstorms and population

3.1.1 Rainstorms and multiple rainstorm scenarios

The rainstorm amount and the rainstorm days were selected as two measures to demonstrate the characteristics of rainstorms. Figure 2 shows the spatial distribution and sequence changes of rainstorms during 1980-2020 in the YRDUA.
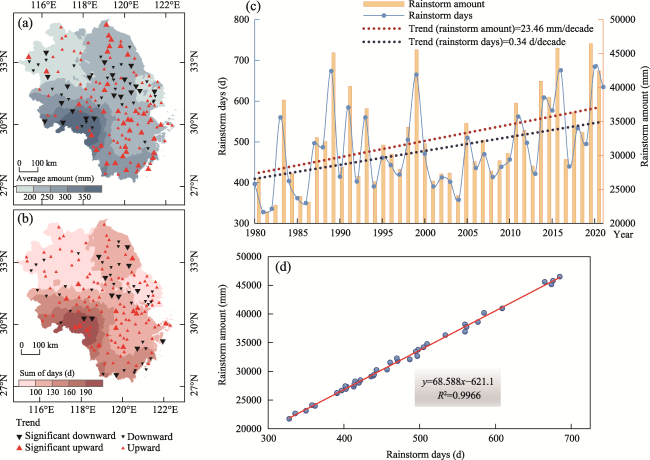
Figure 2 Spatial distribution of the average rainstorm amount (a) and the sum of rainstorm days (b) from 1980 to 2020 in the Yangtze River Delta urban agglomeration, where color bars refer to the sum of amount and days during the 40 years, respectively. Positive trends are represented by the red and upward triangles, while negative trends are represented by the black and downward triangles, and the size donates significance level; (c) Temporal variation in the rainstorm amount and rainstorm days of total of 165 stations during 1980-2020 and their respective trends per decade; (d) Correlation between rainstorm days and rainstorm amount.
The spatial pattern of the average rainstorm amount (Figure 2a) exhibited an obvious spatial heterogeneity. The high-value area of the rainstorm amount (> 250 mm) was mainly distributed in the southwest region, extending and decreasing in the northeast direction, which initially formed a spatial distribution pattern of decreasing along the southwest-northeast line layer-by-layer and decreasing from the middle to the two ends layer-by-layer in the north-south direction. The average rainstorm amount ranges from 150 mm to 400 mm, with the highest value located at the border between southern Anhui and northern Zhejiang, and the lowest value located in northern Anhui and a few areas in northern and southern Jiangsu. At the same time, an analysis on the trend of rainstorm variation at 165 stations in the region showed that stations with increasing trends were distributed in an interval with stations with a decreasing trend. Most of the stations followed an increasing trend, and from the significance level, 116 stations (71.6%) showed an increase in rainstorm amount, of which 38 stations (23.46%) showed a significant increase, mainly in the eastern part of Jiangsu and most of Zhejiang. The remaining 28.4% of the stations showed a decreasing trend, mainly in the central Jiangsu and southwestern Anhui. In the time series (Figure 2c), the rainstorm amount of a total of 165 stations indicated an overall increasing trend from 1980 to 2020, with a mean rainstorm amount of 320 mm over the 40-year period and an increase rate of 21.5 mm/decade. The peak of the rainstorm amount occurred in three years—1989, 1999, and 2017.
The sum of rainstorm days, shown in Figure 2b, ranges from 70 to 210 days in this region. The spatial pattern was consistent with the average rainstorm amount, with similar distributions of high and low values. Most stations also showed an increasing trend, with 118 stations showing an increase in the sum of rainstorm days and 47 stations showing a decrease in terms of the significance level. The rate of increase was 0.31 days/decade and the mean number of rainstorm days over the 40-year period was 475 days (Figure 2c). Further correlation analysis was conducted for the rainstorm amount and rainstorm days, and it was found that both presented a strong linear positive correlation, with a correlation coefficient of 0.998 (Figure 2d), indicating that high rainstorm frequency and high rainstorm intensity occurred at the meantime.
The rainstorm events were classified into six different scenarios to explore the characteristics of population exposure to multi-scenario rainstorms, including PR, AR, DR, SDR, LDR, and UDR, as shown in Table 2. Meanwhile, to study inter-annual variations, the 40 years during 1980-2020 were divided into four periods: the 1980s (1980-1990), 1990s (1991-2000), 2000s (2000-2010), and 2010s (2011-2020). The spatial distribution and time-series variation of the average rainfall per decade in the multi-scenario rainstorms were obtained by spatial interpolation using the Geostatistical Kriging method (Figures 3 and 4).
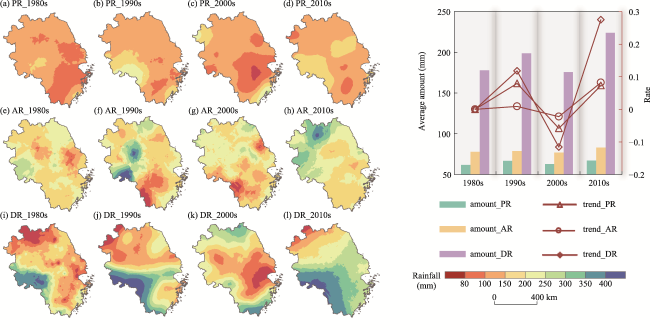
Figure 3 Spatial characteristics of PR (a-d), AR(e-h), DR(H-l)in four decades in the Yangtze River Delta urban agglomeration. The color bat representsthe mean rainallamountper periot;(m)Average ranallamourt of PR, AR, DR in four decades and their temporal change rate, where bar plots denote the amount and lineplots denote the trend.
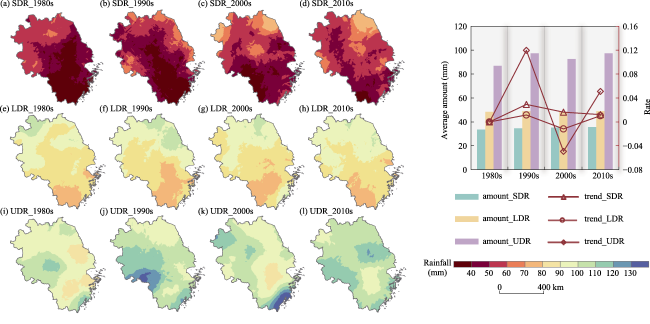
Figure 4 Same as Figure 3, but for SDR, LDR, and UDR scenarios
The distribution of average rainfall in the PR and DR had a similar spatial pattern, with a spatially decreasing distribution along the southwest-northeast in the 1980s, 1990s, and the 2010s, whereas rainfall in the DR had an apparent hierarchical phenomenon. The rainfall distribution in the 2000s was different from that in other decades, in which high-value areas were in the southeast of the region and gradually decreased in the northern and western regions. The distribution of the average rainfall in AR was more random. From the 1980s to the 1990s, the rainfall in the high-value areas located in the southwestern region increased significantly, resulting in the continuous expansion of high-value areas. By the 2010s, rainfall was higher in the north-central region, and high-value areas gradually transitioned to the northeast. In terms of time series changes (Figure 3m), the average rainfall amount in PR, AR, and DR all showed an overall increasing trend, with generational changes of “N”- shaped distribution: first increasing, then decreasing, and then increasing. The smallest inter-annual variation occurred in AR, followed by PR, while the largest was in DR.
The distribution of the average amount in SDR and LDR was mainly in the northern part, showing a gradual decrease from north to south; however, the spatial heterogeneity in LDR was more obvious (Figure 4). The average amount in the UDR was distributed in the southern part, similar to the spatial pattern of the DR, which can be described as a gradual decrease from southwest to northeast. These three rainstorm scenarios were consistent with the rainstorm scenarios in the time series (Figure 4m). The largest inter-annual variation in average rainfall was observed in the UDR, followed by the LDR, and finally, the SDR.
We calculated the average rainstorm amount per decade for the six rainstorm scenarios and the change rate relative to the previous decade (Table 3). The highest average rainfall amount was recorded in the DR and the lowest in the SDR. The total annual average rainfall in all six scenarios reached a peak in the 1990s and the 2010s, corresponding to positive values for the change rate of R1990s-1980s and R2010s-2000s. The inter-annual change rate was largest in DR, with change rates of 11.8%, -11.6%, and 27.5% for the R1990s-1980s, R2000s-1990s, and R2010s-2000s, respectively, while SDR and LDR had smaller change rates.
Table 3 The average rainstorm amount and change rate of 6 rainstorm scenarios in different periods during 1980-2020
Average rainstorm amount (mm) Rate (%)
1980s 1990s 2000s 2010s R1990s-1980s R2000s-1990s R2010s-2000s
PR 61.68 66.58 62.71 67.29 7.9 -5.8 7.3
SR 77.90 78.59 76.83 83.15 0.9 -2.2 8.2
DR 177.81 198.72 175.66 223.97 11.8 -11.6 27.5
SDR 33.67 34.66 35.23 35.66 2.9 1.6 1.2
LDR 48.45 49.01 48.43 48.93 1.2 -1.1 1.0
UDR 86.98 97.41 92.61 97.33 12.0 -4.9 5.1
Based on hourly precipitation data, this paper analyzed various rainstorm events with different amounts and durations. The results found that the amount and duration of rainstorms showed an overall increasing trend, which was consistent with previous studies on monthly-scale or daily-scale precipitation (Afuecheta and Omar, 2021; Qin et al., 2022; Shen et al., 2022). However, the data with the refined time resolution in this paper innovatively reflected that the YRDUA was characterized by short-persistent and sudden-persistent precipitation, and the proportion of long-duration precipitation to total precipitation continued to decrease (He and Zhai, 2018; Zhao et al., 2022), which cannot be presented by the monthly or daily precipitation data. Therefore, this paper strived to the deeper understanding and analysis of the different persistence structures of rainstorms, while also grasping the spatial and temporal distribution patterns of rainstorms under different scenarios in order to subdivide the population exposure risk under multiple scenarios and lay the foundation for disaster mitigation and future prediction.

3.1.2 Population

The distribution pattern of the resident population in YRDUA over the four decades of 1980-2020 is presented in Figures 5a-5d. The densely populated areas were in the southeastern part, mainly in coastal and riverine cities, provincial capitals, and major municipal districts, such as Shanghai, Hangzhou, Ningbo, Suzhou, Wenzhou, and Nanjing. In 2020, the resident population of Shanghai exceeded 24 million, accounting for 21.39% of the total population of the YRDUA. In contrast, inland cities, such as southern Anhui and central Jiangsu, had smaller populations. Although its population has expanded over the 40 years, there are striking regional and chronological differences. Regions such as Nantong, Yangzhou, Taizhou, and Luan experienced a decline in their resident populations. At the same time, there were significant differences in the growth rates. Population growth in Shanghai and its surrounding cities has experienced a significant increasing trend. The population growth rate was relatively low in other regions.
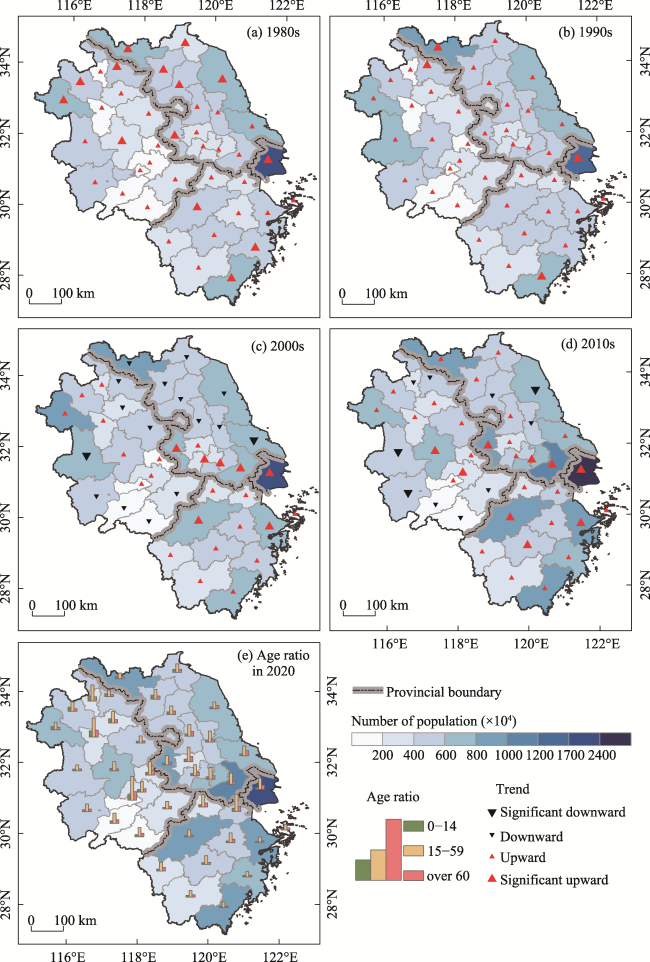
Figure 5 Spatial characteristics and trends of the population in the Yangtze River Delta urban agglomeration in four decades during 1980-2020 at the prefecture level (a-d). The color bar shows the number of population (×104). Positive trends are represented by the red and upward triangles, while negative trends are represented by the black and downward triangles, and the size donates significance level. (e) Spatial distribution of the age of population and the ratio of different age groups (0-14, 15-59, over 60, respectively) in prefecture-level cities in 2020.
The age distribution of the population in the YRDUA in 2020 was studied based on the 7th Census data (Figure 5e). The age structure of the population in different cities was extremely uneven. The population of different ages was divided into three groups: 0-14, 15-59, and 60 years old. The areas with a higher proportion of young children and adolescents in the 0-14 age group were mainly located in the north. Cities with a higher proportion of older people (over 60) were in central-eastern Jiangsu, southern Anhui, and some cities in western Zhejiang, whereas adults (15-59) were mainly distributed in Shanghai and the surrounding metropolitan areas. The age structure of the resident population also reflects the economic and industrial structures and employment situation in the YRDUA.

3.2 Spatiotemporal evolution of population exposure

The spatiotemporal characteristics of the population exposure to multi-scenario rainstorms and the temporal changes in areas of different exposure levels were obtained by combining the average rainfall per decade with population data, as shown in Figures 6 and 7.
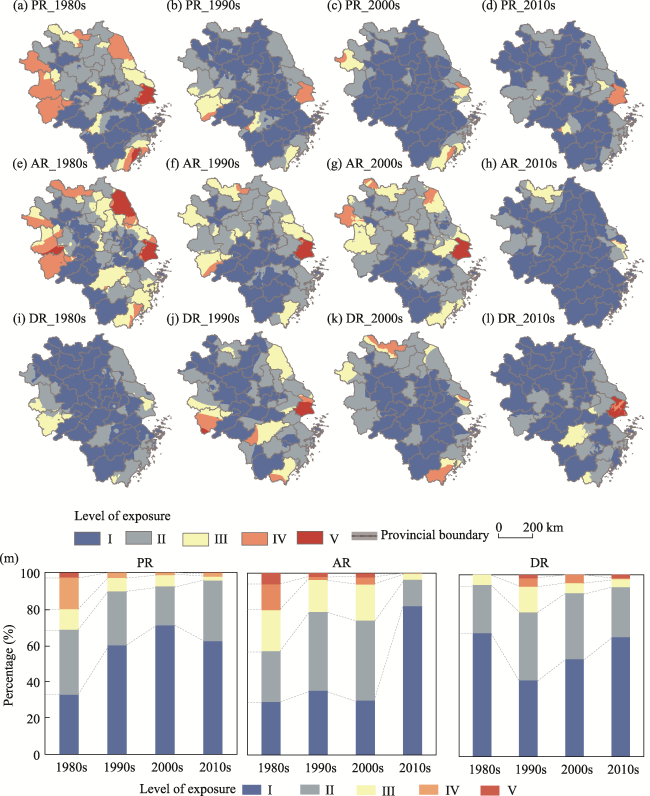
Figure 6 Spatial characteristics of the population exposure to PR scenario (a-d), AR scenario (e-h), and DR scenario (i-l) in the Yangtze River Delta urban agglomeration in four periods during 1980-2020. Color reflects the level of the population exposure; (m) Percentage of different exposure levels in the region in four periods to PR, AR, and DR scenarios.
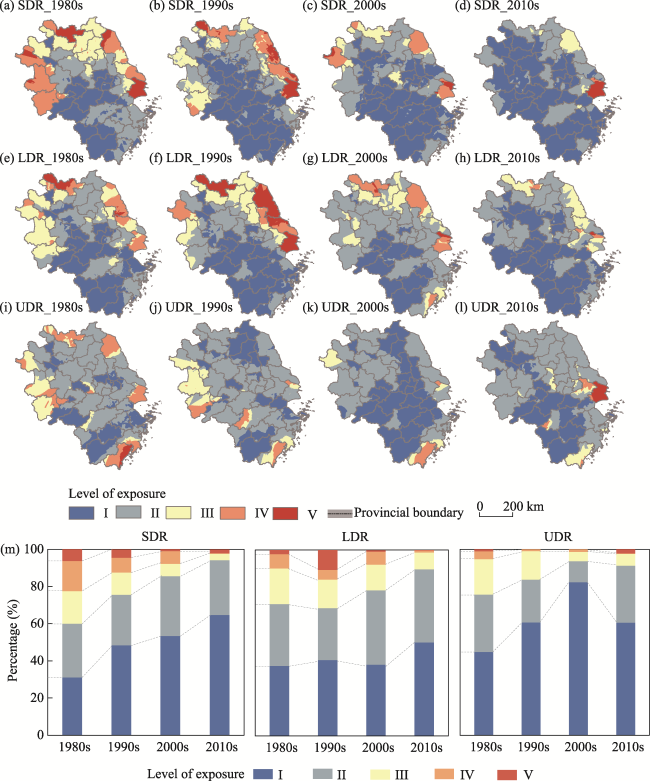
Figure 7 Same as Figure 6, but for SDR, LDR, and UDR scenarios in the Yangtze River Delta urban agglomeration
The population exposure to PR and AR had a resembling spatial distribution pattern, and high-value zones of population exposure were located on Shanghai, southeastern cities, and northwestern cities. The population exposure zones in level V were in and around Shanghai, with severe rainstorms, developed economies, and a large population. Compared with the PR scenarios, the population exposure to AR was more extensive and had a higher exposure risk level, indicating that exposure to PR and AR was more influenced by rainstorm dangers. Furthermore, population exposure to PR and AR was most severe in the 1980s, and the exposure areas at levels IV and V decreased significantly. Except for Shanghai, the entire region was largely converted to exposure areas in levels I and II in the 2010s. The corresponding area of each exposure level (Figure 6m) suggested that the areas of levels IV and V in the PR scenarios gradually decreased from the 1980s to the 2000s but showed a slight increase in the 2010s. However, those under the AR scenario continued to decrease. In addition, there was no distinct geographical distribution of the population exposure to DR (Figure 6i-6l). The higher population exposure was in Shanghai, Wenzhou, Hangzhou, and Anqing. The temporal differences per decade were more evident, with higher exposure areas in the 1990s and the 2010s, which was consistent with the spatial distribution of the average annual rainstorm amount in the DR scenarios.
Figure 7 shows the distribution of population exposure to the SDR, LDR, and UDR in the four periods from 1980 to 2020. It was concluded that the risk and extent of population exposure decreased as the rainstorm duration increased, and the high-value zones gradually shifted to the southern part of YRDUA. The high-value zones of population exposure to SDR and LDR were generally located in the northern part, whereas the population exposure in the southern part of the region was relatively lower. The spatial distribution of the population exposure to UDR changed; the population exposure in the coastal cities decreased and even gradually became low-value zones, while Wenzhou and Taizhou in the south of the region became high-value zones. Temporally, the exposure areas at level V to SDR, LDR, and UDR showed an overall decreasing trend; furthermore, the temporal variations were not exactly the same. The high exposure area to SDR decreased continuously from the 1980s to the 2000s, but rebounded in the 2010s, mainly resulting from the increased exposure risks in Shanghai. The area with high exposure to LDR first increased and then decreased, with the greatest exposure risks in the 1990s, developing to the point where no high-exposure-risk areas existed in the 2010s. The exposure area of the high-value zones to the UDR showed a trend of first decreasing and then increasing (contrary to the LDR), with the lowest exposure risks in the 2000s. However, the exposure risk increased again in the 2010s, converting Shanghai to a population exposure zone in level V.
The proportions of different population exposure levels under the six rainstorm scenarios in each province (municipality) during 1980-2020 were further calculated, as shown in Table 4. In Shanghai, the proportion of exposure level V accounted for a large rate of 69.72% and 76.56% under the AR and SDR scenarios, respectively. This far exceeded the other provinces (Jiangsu, Zhejiang, and Anhui), indicating that Shanghai was more susceptible to abrupt and short-term heavy rainstorms. However, under the other scenarios, high exposure levels in Shanghai still accounted for a relatively large fraction, although the proportion values were not as high as those in the AR and SDR scenarios. In Zhejiang and Anhui, the proportion of exposure level V under all six rainstorm scenarios were less than 1%, demonstrating that the two provinces were not the main zones of population exposure during the past 40 years. The exposure level in Jiangsu was medium and gradually shifted to high levels under the DR and LDR scenarios.
Table 4 Proportion of different population exposure levels for each province (municipality) during 1980-2020
Exposure level Jiangsu (%) Zhejiang (%) Anhui (%) Shanghai (%)
PR V 0.02 0.56 0 22.89
IV 3.91 2.10 7.80 53.47
III 7.11 7.39 5.44 15.49
II 46.13 17.65 28.79 7.66
I 42.83 72.30 57.97 0.49
AR V 2.93 0.02 0.51 69.72
IV 5.73 1.00 7.37 5.38
III 24.26 14.80 10.83 8.20
II 39.90 23.85 34.54 14.64
I 27.18 60.27 46.75 2.07
DR V 0.03 0.02 0.16 37.85
IV 1.79 3.46 1.44 13.87
III 6.38 9.64 6.07 15.67
II 42.93 32.43 23.93 24.10
I 48.87 54.45 68.41 8.52
SDR V 4.93 0.02 0.77 76.56
IV 13.13 0.01 8.83 20.68
III 19.42 0.34 10. 1.69
II 42.56 25.53 24.53 0.80
I 19.96 74.10 55.27 0.27
LDR V 9.40 0.01 0.02 31.63
IV 11.61 0.25 2.51 39.44
III 24.83 2.34 15.18 21.53
II 43.70 24.90 37.95 6.98
I 10.47 72.51 44.35 0.42
UDR V 0.02 0.96 0 22.90
IV 1.06 3.67 0.28 10.81
III 7.13 10.52 14.18 27.64
II 30.88 16.35 23.86 37.08
I 60.91 68.50 61.68 1.58
As shown in Figure 8, the spatial pattern of population exposure to multi-scenario rainstorms was closely related to the age structure and showed strong consistency with the distribution of different age groups in the YRDUA. Among the different age groups, higher exposure risk zones for young children and adolescents (0-14) were mainly located in the northern part of the region, including Lianyungang, Xuzhou, Suzhou, Bozhou, Fuyang, and Luan. In different rainstorm scenarios, the exposure risk in the 0-14 age group to LDR and AR was higher, with the lowest exposure risk to DR. Residents aged 15-59 were more likely to be exposed in the central and southern parts of the region because of their work and life—mostly in highly developed economic cities along the coast and provincial capitals, such as Shanghai, Suzhou, Wuxi, Nanjing, and Hefei. Because the group (15-59) were cognitive with a certain level of awareness and preparedness for heavy rainfall risk and possessed an active “protective” behavior (Reis et al., 2018). According to the Protective Action Decision Model presented by Michael and Seong (2008), people, especially adults aged 15-59 with cognitive ability, can perceive the risks they will encounter when faced with natural disasters, such as rainstorms, and then choose to avoid or mitigate risks. This basic response chain is closely related to gender, age, income and other variables. The population exposure age 15-59 was lower to AR and SDR scenarios, while the highest to DR. High exposure zones for older people (>60 years) included Yancheng, Nantong, Huangshan and Quzhou, which had a large proportion of older people. The older age groups, same as the 15-59 age group, had a low exposure risk to AR owing to their “risk aversion” behavior (Saqib, 2016). However, older people were inherently more vulnerable to disasters and had higher exposure risks in the remaining five rainstorm scenarios. In a cross-sectional comparison of the different rainstorm scenarios, the AR posed the greatest exposure risk to the 0-14 age group, but lower to the 15-59 age group and over 60 age group due to the “protection” and “avoidance” of rainstorm risks. In the DR scenario, the exposure risk was the lowest for the 0-14 age group but higher for the other two age groups, which was related to the living habits and work nature of the population.
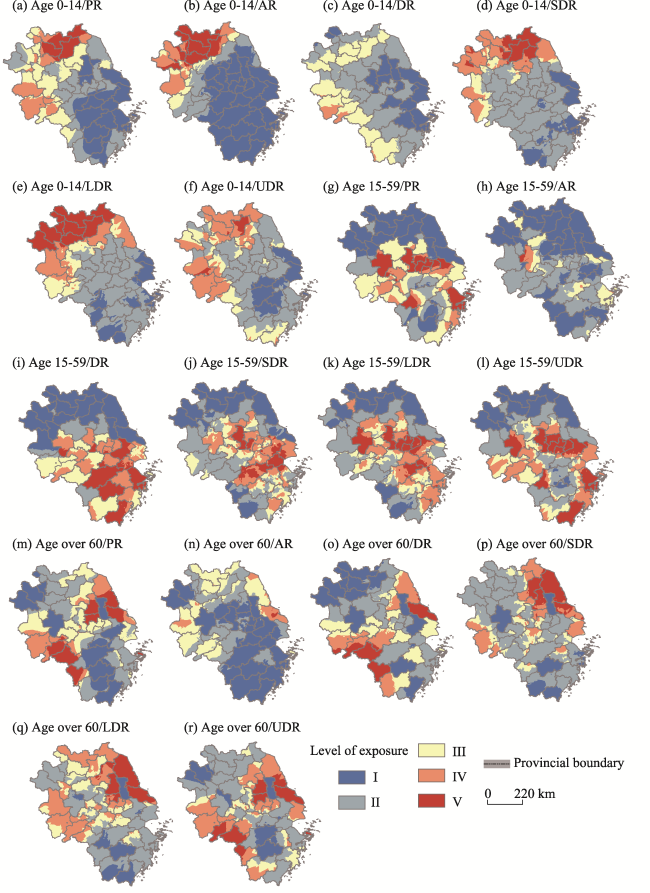
Figure 8 Spatial characteristics of population exposure to multi-scenario rainstorms (PR, AR, DR, SDR, LDR, UDR) at different age groups (0-14, 15-59, over 60, respectively) in the Yangtze River Delta urban agglomeration
The results of population exposure presented here support some important findings from previous studies. Regarding population exposure to daily rainstorms, we found that high exposure zones were in coastal cities and western parts, with the highest exposure occurring in Shanghai, while the annual exposure showed an increasing trend, corroborating the results of Shen et al. (2022). Moreover, the spatial pattern of population exposure to rainstorms was very similar for the four periods and the change in total exposure was mainly due to population change, which is consistent with Liao et al. (2019). Despite the similar research results, the previous works only considered daily-scale or sub-daily-scale extreme precipitation, and did not involve rainstorm exposure in more scenarios, resulting in insufficient analysis and discussion of the exposure results. It is worth pointing out that with the exploration and analysis of the population exposure to multi-scenario rainstorms, we provided a detailed description of the dynamic changes and process simulation for the exposed population during rainstorms, which improved preventive measures for population exposure risks under different scenarios.

3.3 Contribution factors of exposure disparities

In contrast to the distribution of rainstorms and populations, the spatial pattern of population exposure was not entirely consistent with the two factors mentioned above. For example, the exposure risk in some prefecture-level cities in the north of the region was higher than that in the densely populated and rainstorm-prone areas in the southeast. In addition, it has been difficult to generalize the distribution characteristics and changes in population exposure to different rainstorm scenarios for decades using a single influencing factor. There have been limitations in considering the three components (climate effect, population effect, and their nonlinear interaction effect) to evaluate the drivers of exposure changes (Huang et al., 2018; Liao et al., 2019; Shen et al., 2022; Wang et al., 2023). The frequency of rainstorms and severity of population exposure are associated with the amount and intensity of rainfall (Soneja et al., 2016), geophysical indicators such as topography (Popp et al., 2017), and social factors such as population density and socioeconomic development (Liang et al., 2017; Winsemius et al., 2018; Shi et al., 2021). Therefore, we used the Geodetector method to evaluate the influencing factors and measure the contribution rate of each factor to the spatiotemporal pattern of population exposure to multi-scenario rainstorms. According to the correlation analysis between the different factors and population exposure (Figure 9), five independent variables were selected: mean elevation (ME), average annual precipitation (AP), population density (PD), average land GDP (LGDP), and urbanization rate (UR) (refers to the proportion of non-agricultural population), whose contribution rates and significance on the exposure to multi-scenario rainstorms in four decades are shown in Figure 10. The result indicated that the five indicators selected in this study had significant differences in their impact on the exposure in the YRDUA. AP, PD, LGDP and UR were positively correlated with exposure, while ME was negatively correlated with exposure.
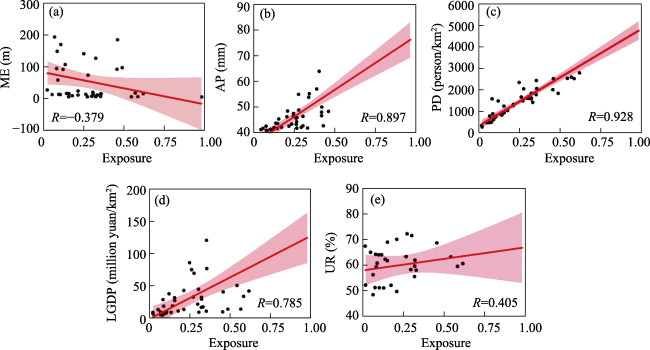
Figure 9 Correlation between 5 independent variables and average population exposure during 1980-2020
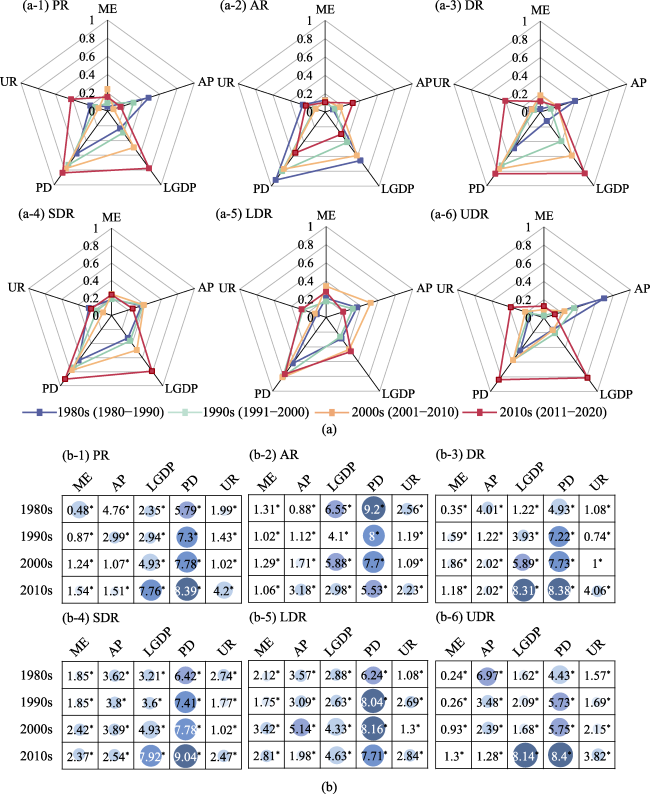
Figure 10 Contribution factors analysis on population exposure to multi-scenario rainstorms in different periods (1980s, 1990s, 2000s, 2010s). (a) Radar diagram of the contributions of five variables. (Note: ME: mean elevation; AP: average annual precipitation; LGDP: average land GDP; PD: population density; UR: urbanization rate). (b) Percentage of contributions of five influencing factors to exposure and their significance (%).
The contribution rate of each factor to population exposure varied in different rainstorm scenarios and periods; however, PD was the dominant driver of the distribution and variation in population exposure under all rainstorm scenarios and periods. The distribution and changes in exposure were related to population characteristics, which generational differences manifest in the absence of a homogeneous population growth trend in different periods (Wang et al., 2020a; Xu et al., 2021; Cao et al., 2023). Regional topography also had a significant impact on population exposure, as social wealth and population were mainly concentrated at lower elevations. However, the ME variable in this study devoted little to exposure in all rainstorm scenarios over time, with low contribution rates. This may be because the study area was highly developed, densely populated, and prone to rainstorms, making the influence of topography less prominent. In the different scenarios, the trends of the influencing factors in population exposure in the AR scenario were significantly different from those in the other five scenarios. Except for the AR scenario, the LGDP and UR variables in the populations exposed to the PR, DR, SDR, LDR, and UDR scenarios increased dramatically during the period 1980-2020. In the 1980s and the 1990s, the factors influencing exposure to the PR and DR scenarios were ranked in descending order as follows: PD > AP > LGDP > UR > ME. However, after the 2000s, they gradually became PD > LGDP > UR > ME > AP, indicating that the influence of rainstorms was decreasing and socioeconomic factors gradually began to control exposure changes. The ranking changes of the influencing factors in population exposure further suggested that socioeconomic development and urbanization in the YRDUA led to a higher risk of population exposure, while society’s ability to cope with and defend against rainstorms (PR and DR) can be monitored and prevented (Merkens et al., 2018). In contrast to the AR scenario, the influencing factors in the 1980s and the 1990s were in the order of PD > LGDP > UR > ME > AP, indicating that PD and LGDP dominated the distribution of population exposure during these two decades. By the 2010s, PD remained the dominant influencing factor, whereas its contribution rate declined sharply, and AP became the second main influencing factor due to the increase in extreme rainstorms caused by global climate change in recent years. It was more difficult to prevent such abrupt and rapid rainstorms; therefore, the AP variable posed a more serious risk of population exposure. The main influencing factors and changes in exposure to SDR, LDR, and UDR were similar to those in the PR scenario. However, as the rainstorm duration increased, the contribution rate of the AP variable decreased greatly, and the significance gradually converted from meteorological factors to socio-economic factors.

4 Discussion and conclusions

The population data used in this study were prefecture-level data, based on statistical yearbooks and censuses, with low precision and spatial resolution. To fit the calculation unit of the exposure, the prefecture-level data were downscaled to 1 km resolution results, and the errors in this downscaling process mainly came from the data itself. Moreover, the population, as one of the most active elements in the geographical environment, exhibits typical spatial variability and temporal dynamics in its distribution. The average values within administrative districts were used to represent the spatial distribution of population density, which cannot reflect the spatial variability of the population at a finer scale, and the administrative units did not coincide with the natural units in rainstorm hazard studies. Meanwhile, human activities, such as commuting and mobility, are ignored, making it difficult to express the spatiotemporal dynamics of population exposure. The assessment and management of the population exposure requires a more accurate understanding of the spatial and temporal distribution of people at rainstorm risk areas, and this is a direction that needs to be addressed in subsequent studies.
Using hourly precipitation and population data, we analyzed the spatial distribution patterns and temporal trends of rainstorms, population, and population exposure to multi-scenario rainstorms. The Geodetector method was then adopted to quantitatively assess the contribution rates and significance of five independent variables (ME, AP, PD, LGDP, and UR) to population exposure to multi-scenario rainstorms over different periods. The following conclusions were drawn.
(1) During 1980-2020, the rainstorm amount and rainstorm days showed clear spatial heterogeneity, with a decreasing trend from southwest to northeast. and a significant increase in the amount and days of rainstorms at most stations in the region. The temporal characteristics of rainstorm amount and number of days showed an overall increasing trend. Rainstorms were further divided into six scenarios: PR, AR, DR, SDR, LDR, and UDR, whose spatial patterns varied among the different rainstorm scenarios. The average rainfall per decade in six rainstorm scenarios showed an increasing, then decreasing, and finally increasing “N”-shaped distribution in time series. The change of rainfall in the DR was the largest, and it was relatively low in the SDR and LDR.
(2) The population of permanent residents of the YRDUA was mainly concentrated in coastal and riverine cities, provincial capitals, and major municipal districts in the south-east, and the population continued to expand over the past 40 years, with obvious differences in regional distribution and temporal changes per decade. The population in the core city of Shanghai has grown rapidly, whereas that in the surrounding cities has grown at a relatively low rate, with some cities experiencing negative growth. The temporal trend in population growth was not uniform across generations. At the same time, the age structure of the population was extremely uneven, which also reflects the economic and industrial structure and employment situation in the YRDUA.
(3) The spatial patterns of population exposure varied for the different rainstorm scenarios over the four decades. Population exposure to the PR and AR scenarios was similar in spatial distribution, forming a pattern of gradually increasing exposure from the regional center to the surrounding zones. Exposure to PR and AR was most severe in the 1980s, and the exposure areas with high values decreased substantially by the 2010s. Population exposure to DR was higher in Shanghai, Wenzhou, Hangzhou, and Anqing, with an apparent temporal variation per decade. In terms of rainstorm duration in the SDR, LDR, and UDR, population exposure gradually shifted southward spatially as the duration increased. In addition, the distribution of population exposure was closely related to the age structure, demonstrating strong consistency with the distribution of different age groups.
(4) PD was the dominant driver of the population exposure to all rainstorm scenarios across different generations during 1980-2020. Under the PR, DR, SDR, LDR, and UDR scenarios, the contribution rates of the LGDP and UR variables increased significantly, while the AP variable decreased from 1980 to 2020. Additionally, the influence and significance increasingly shifted from meteorological to socioeconomic factors. It can be concluded that the ability of a society to cope with and defend against rainstorms (PR and DR) can be monitored and prevented. However, the main influencing factors in exposure to AR showed the opposite trend, and by the 2010s, although PD remained the dominant influencing factor, its contribution rate declined considerably, with AP becoming the second most influential factor after PD.
In conclusion, this study considers fine-scale precipitation data and multi-scenario rainstorms under different time series and explores the spatiotemporal characteristics of population exposure during different periods, providing a scientific basis for the risk mitigation of population exposure under different rainstorm scenarios. Resources for rainstorm hazard prevention and relief can be allocated rationally based on the spatial distribution of population exposure in different age groups, aiming at optimizing resource deployment and maximizing human safety to improve human well-being and promote the over resilience of cities to climate and extreme rainstorm events.
[1]
Afuecheta E, Omar M H, 2021. Characterization of variability and trends in daily precipitation and temperature extremes in the Horn of Africa. Climate Risk Management, 32: 100295.

DOI

[2]
Boussad Y, Chen X, Legout A et al., 2022. Longitudinal study of exposure to radio frequencies at population scale. Environment International, 162: 107144.

DOI

[3]
Cao Y, Hua Z, Chen T et al., 2023. Understanding population movement and the evolution of urban spatial patterns: An empirical study on social network fusion data. Land Use Policy, 125: 106454.

DOI

[4]
Chen H, Sun J, 2019. Increased population exposure to precipitation extremes in China under global warming scenarios. Atmospheric and Oceanic Science Letters, 13(1): 63-70.

DOI

[5]
Chen J, Li Q, Wang H et al., 2020. A machine learning ensemble approach based on random forest and radial basis function neural network for risk evaluation of regional flood disaster: A case study of the Yangtze River Delta, China. International Journal of Environmental Research and Public Health, 17(1): 19.

DOI

[6]
Chen W, Wang G, Zeng J, 2023. Impact of urbanization on ecosystem health in Chinese urban agglomerations. Environmental Impact Assessment Review, 98: 106964.

DOI

[7]
Chen Y, Wang X, Huang L et al., 2021. Spatial and temporal characteristics of abrupt heavy rainfall events over Southwest China during 1981-2017. International Journal of Climatology, 41(5): 3286-3299.

DOI

[8]
Christenson E, Elliott M, Banerjee O et al., 2014. Climate-related hazards: A method for global assessment of urban and rural population exposure to cyclones, droughts, and floods. International Journal of Environmental Research and Public Health, 11(2): 2169-2192.

DOI PMID

[9]
Cynthia A B, Linda P, 2003. Evaluation of methods for classifying epidemiological data on choropleth maps in series. Annals of the Association of American Geographers, 92(4): 662-681.

DOI

[10]
Daufresne M, Lengfellner K, Sommer U, 2009. Global warming benefits the small in aquatic ecosystems. Proceedings of the National Academy of Sciences, 106(31): 12788-12793.

DOI

[11]
Hauer M E, Hardy D, Kulp S A et al., 2021. Assessing population exposure to coastal flooding due to sea level rise. Nature Communications, 12: 6900.

DOI PMID

[12]
He B, Zhai P, 2018. Changes in persistent and non-persistent extreme precipitation in China from 1961 to 2016. Advances in Climate Change Research, 9(3): 177-184.

DOI

[13]
Hitchens N M, Brooks H E, Schumacher R S, 2013. Spatial and temporal characteristics of heavy hourly rainfall in the United States. Monthly Weather Review, 141(12): 4564-4575.

DOI

[14]
Hofmann G, Balakrishnan N, 2006. A nonparametric test for trend based on initial ranks. Journal of Statistical Computation and Simulation, 76(9): 829-837.

DOI

[15]
Hu P, Chen B, Shi P, 2021. Spatiotemporal patterns and influencing factors of rainstorm-induced flood disasters in China. Acta Geographica Sinica, 76(5): 1148-1162. (in Chinese)

DOI

[16]
Huang D, Zhang L, Gao G et al., 2018. Projected changes in population exposure to extreme heat in China under a RCP8.5 scenario. Journal of Geographical Sciences, 28(10): 1371-1384.

DOI

[17]
Huang G, Luo H, Lu X et al., 2020. Study on risk analysis and zoning method of urban flood disaster. Water Resources Protection, 36(6): 1-6, 17. (in Chinese)

[18]
Jiang T, Su B, Huang J et al., 2020. Each 0.5°C of warming increases annual flood losses in China by more than US$60 billion. Bulletin of the American Meteorological Society, 101(8): E1464-E1474.

DOI

[19]
Jing Y, Fang J, Shi P, 2020. Analysis of population exposure to extreme precipitation in Hubei province under the climate change scenarios. Journal of Beijing Normal University (Natural Science), 56(5): 700-709. (in Chinese)

[20]
Jones B, O'Neill B C, McDaniel L et al., 2015. Future population exposure to US heat extremes. Nature Climate Change, 5(7): 652-655.

[21]
Jongman B, Winsemius H C, Aerts J C J H et al., 2015. Declining vulnerability to river floods and the global benefits of adaptation. Proceedings of the National Academy of Sciences, 112(18): E2271-E2280.

[22]
Li C, Dash J, Asamoah M et al., 2022a. Increased flooded area and exposure in the White Volta river basin in Western Africa, identified from multi-source remote sensing data. Scientific Reports, 12(1): 3701.

DOI

[23]
Li J, Guo P, Sun Y et al., 2022b. Population exposure changes to one heat wave and the influencing factors using mobile phone data: A case study of Zhuhai city, China. Sustainability, 14(2): 997.

DOI

[24]
Li Y, Gong S, Zhang Z et al., 2021. Vulnerability evaluation of rainstorm disaster based on ESA conceptual framework: A case study of Liaoning province, China. Sustainable Cities and Society, 64: 102540.

DOI

[25]
Li Y, Zhang Z, Gong S et al., 2020. Risk assessment of rainstorm disasters under different return periods: A case study of Bohai Rim, China. Ocean & Coastal Management, 187: 105107.

[26]
Liang P, Xu W, Ma Y et al., 2017. Increase of elderly population in the rainstorm hazard areas of China. International Journal of Environmental Research and Public Health, 14(9): 963.

DOI

[27]
Liao X, Xu W, Zhang J et al., 2019. Global exposure to rainstorms and the contribution rates of climate change and population change. Science of the Total Environment, 663: 644-653.

DOI

[28]
Liao X, Xu W, Zhang J et al., 2022. Analysis of affected population vulnerability to rainstorms and its induced floods at county level: A case study of Zhejiang province, China. International Journal of Disaster Risk Reduction, 75: 102976.

DOI

[29]
Lin W, Sun Y, Nijhuis S et al., 2020. Scenario-based flood risk assessment for urbanizing deltas using future land-use simulation (FLUS): Guangzhou Metropolitan Area as a case study. Science of the Total Environment, 739: 139899.

DOI

[30]
Liu Y, Li L, Zhang W et al., 2019. Rapid identification of rainstorm disaster risks based on an artificial intelligence technology using the 2DPCA method. Atmospheric Research, 227: 157-164.

DOI

[31]
Ma Z, Sun P, Zhang Q et al., 2022. The characteristics and evaluation of future droughts across China through the CMIP6 multi-model ensemble. Remote Sensing, 14(5): 1097.

DOI

[32]
Man H de, Berg H H J L van den, Leenen E J T M et al., 2014. Quantitative assessment of infection risk from exposure to waterborne pathogens in urban floodwater. Water Research, 48: 90-99.

DOI PMID

[33]
Merkens J, Lincke D, Hinkel J et al., 2018. Regionalisation of population growth projections in coastal exposure analysis. Climatic Change, 151: 413-426.

DOI

[34]
Michael K L, Seong N H, 2008. Households’ perceived personal risk and responses in a multihazard environment. Risk Analysis, 28(2): 539-556.

DOI PMID

[35]
Mouri G, Minoshima D, Golosov V et al., 2013. Probability assessment of flood and sediment disasters in Japan using the Total Runoff-Integrating Pathways model. International Journal of Disaster Risk Reduction, 3: 31-43.

DOI

[36]
National Bureau of Statistics of China, 2020. China Statistical Yearbook 2020. China Statistics Press, Beijing, Beijing. http://www.stats.gov.cn/english.

[37]
Popp A, Calvin K, Fujimori S et al., 2017. Land-use futures in the shared socio-economic pathways. Global Environmental Change, 42: 331-345.

DOI

[38]
Qin P, 2022. More than six billion people encountering more exposure to extremes with 1.5 degrees ℃ and 2.0 degrees ℃ warming. Atmospheric Research, 273: 106165.

DOI

[39]
Qin X, Wu Y, Lin T et al., 2023. Urban flood dynamic risk assessment based on typhoon rainfall process: A case study of typhoon “Lupit” (2109) in Fuzhou, China. Remote Sensing, 15: 3116.

DOI

[40]
Reis S, Liška T, Vieno M et al., 2018. The influence of residential and workday population mobility on exposure to air pollution in the UK. Environment International, 121: 803-813.

DOI PMID

[41]
Saqib S, Ahmad M M, Panezai S et al., 2016. Factors influencing farmers’ adoption of agricultural credit as a risk management strategy: The case of Pakistan. International Journal of Disaster Risk Reduction, 17: 67-76.

DOI

[42]
Şen Z, 2017. Innovative trend significance test and applications. Theoretical and Applied Climatology, 127(3/4): 939-947.

DOI

[43]
Shen L, Wen J, Zhang Y et al., 2022. Changes in population exposure to extreme precipitation in the Yangtze River Delta, China. Climate Service, 27: 100317.

DOI

[44]
Shi X, Chen J, Gu L et al., 2021. Impacts and socioeconomic exposures of global extreme precipitation events in 1.5 and 2.0 °C warmer climates. Science of The Total Environment, 766: 142665.

DOI

[45]
Smith A, Bates P D, Wing O et al., 2019. New estimates of flood exposure in developing countries using high-resolution population data. Nature Communications, 10(1): 1814.

DOI PMID

[46]
Soneja S, Jiang C, Fisher J et al., 2016. Exposure to extreme heat and precipitation events associated with increased risk of hospitalization for asthma in Maryland, U.S.A. Environmental Health, 15(1): 57.

DOI

[47]
Ta Z, Li K, Han H et al., 2022. Population and GDP exposure to extreme precipitation events on Loess Plateau under the 1.5 degrees ℃ global warming level. Atmosphere, 13(9): 1423.

DOI

[48]
Takaya Y, Ishikawa I, Kobayashi C et al., 2020. Enhanced Meiyu-Baiu rainfall in early summer 2020: Aftermath of the 2019 Super IOD Event. Geophysical Research Letters, 47(22): e2020G-e90671G.

[49]
Tang R, Dai Z, Mei X et al., 2023. Joint impacts of dams and floodplain on the rainfall-induced extreme flood in the Changjiang (Yangtze) River. Journal of Hydrology, 627: 130428.

DOI

[50]
Wang A, Tao H, Ding G et al., 2023. Global cropland exposure to extreme compound drought heatwave events under future climate change. Weather and Climate Extremes, 40: 100559.

DOI

[51]
Wang J, Li X, Christakos G et al., 2010. Geographical Detectors-based health risk assessment and its application in the neural tube defects study of the Heshun region, China. International Journal of Geographical Information Science, 24(1): 107-127.

DOI

[52]
Wang J, Zhang T, Fu B, 2016. A measure of spatial stratified heterogeneity. Ecological Indicators, 67: 250-256.

DOI

[53]
Wang X, Ding S, Cao W et al., 2020a. Research on network patterns and influencing factors of population flow and migration in the Yangtze River Delta urban agglomeration, China. Suatainability, 12(17): 6803.

[54]
Wang Y, Xu Y, Tabari H et al., 2020b. Innovative trend analysis of annual and seasonal rainfall in the Yangtze River Delta, eastern China. Atmospheric Research, 231: 104673.

DOI

[55]
Winsemius H C, Jongman B, Veldkamp T I E et al., 2018. Disaster risk, climate change, and poverty: Assessing the global exposure of poor people to floods and droughts. Environment and Development Economics, 23(3): 328-348.

DOI

[56]
Wu Y, Wu S, Wen J et al., 2016. Future changes in mean and extreme monsoon precipitation in the middle and lower Yangtze River Basin, China, in the CMIP5 Models. Journal of Hydrometeorology, 17(11): 2785-2797.

DOI

[57]
Xiao R, Cao W, Liu Y et al., 2022. The impacts of landscape patterns spatio-temporal changes on land surface temperature from a multi-scale perspective: A case study of the Yangtze River Delta. Science of The Total Environment, 821: 153381.

DOI

[58]
Xu Z, Yin Y, 2021. Regional development quality of Yangtze River Delta: from the perspective of urban population agglomeration and ecological efficiency coordination. Sustainability, 13(22): 12818.

DOI

[59]
Yao R, Zhang S, Sun P et al., 2022. Diurnal variations in different precipitation duration events over the Yangtze River Delta urban agglomeration. Remote Sensing, 14(20): 5244.

DOI

[60]
Yin S, Gao G, Li W et al., 2011. Long-term precipitation change by hourly data in Haihe River Basin during 1961-2004. Science China Earth Sciences, 54: 1576-1585.

[61]
Yu R, Yuan W, Li J, 2013. The asymmetry of rainfall process. Chinese Science Bulletin, 58(16): 1850-1856.

DOI

[62]
Yue S, Pilon P, Phinney B et al., 2002. The influence of autocorrelation on the ability to detect trend in hydrological series. Hydrological Processes, 16(9): 1807-1829.

DOI

[63]
Zhang J, Yuan J, Wang Y, 2023. Spatio-temporal evolution and influencing factors of coupling coordination between urban resilience and high-quality development in Yangtze River Delta area, China. Frontiers in Environmental Science, 11: 1174875.

DOI

[64]
Zhang W, Zhou T, 2020. Increasing impacts from extreme precipitation on population over China with global warming. Science Bulletin, 65(3): 243-252.

DOI PMID

[65]
Zhang W, Zhou T, Zou L et al., 2018. Reduced exposure to extreme precipitation from 0.5°C less warming in global land monsoon regions. Nature Communications, 9(1): 3153.

DOI

[66]
Zhao Y, Zhou T, Zhang W et al., 2022. Change in precipitation over the Tibetan Plateau projected by Weighted CMIP6 Models. Advances in Atmospheric Sciences, 39: 1133-1150.

DOI

[67]
Zheng F, Sun C, Li J, 2012. Climate change: New dimension in disaster risk, exposure, vulnerability, and resilience. Climate Change Research, 8(2): 79-83. (in Chinese)

[68]
Zhou Z, Xie S, Zhang R, 2021. Historic Yangtze flooding of 2020 tied to extreme Indian Ocean conditions. Proceedings of the National Academy of Sciences, 118(12): e2022255118.

DOI

Outlines

/