Research Articles

Effects of precipitation on vegetation and surface water in the Yellow River Basin during 2000-2021

  • SHI Xiaorui , 1 ,
  • YANG Peng , 1, 2, * ,
  • XIA Jun 3 ,
  • ZHANG Yongyong 4 ,
  • HUANG Heqing 1 ,
  • ZHU Yanchao 1
Expand
  • 1. Hubei Key Laboratory of Regional Ecology and Environmental Change, School of Geography and Information Engineering, China University of Geosciences, Wuhan 430074, China
  • 2. National Engineering Research Center for Geographic Information System, China University of Geosciences, Wuhan 430074, China
  • 3. State Key Laboratory of Water Resources and Hydropower Engineering Science, Wuhan University, Wuhan 430072, China
  • 4. Key Laboratory of Water Cycle and Related Land Surface Processes, Institute of Geographic Sciences and Natural Resources Research, CAS, Beijing 100101, China
* Yang Peng (1989‒), PhD and Associate Professor, specialized in water cycle and hydrological processes modeling. E-mail:

Shi Xiaorui (1999‒), Master Candidate, specialized in remote sensing of hydrology and food water security. E-mail:

Received date: 2023-06-13

  Accepted date: 2024-01-04

  Online published: 2024-04-24

Supported by

The National Key Research and Development Program of China(2021YFC3201102)

National Natural Science Foundation of China(42207078)

Joint Open Research Fund Program of State Key Laboratory of Hydroscience and Engineering and Tsinghua-Ningxia Yinchuan Joint Institute of Internet of Waters on Digital Water Governance(sklhse-2022-Iow04)

Abstract

The Yellow River Basin (YRB) is a vital ecological zone in China owing to its sensitive and fragile environment. Under the long-term influence of climate changes and artificial factors, the relationship between precipitation, vegetation, and surface water in the YRB has changed drastically, ultimately affecting the water resources and environmental management. Therefore, we applied multivariate statistical analysis to investigate the precipitation, normalized difference vegetation index (NDVI), and surface water changes in the YRB from 2000 to 2021. Furthermore, we attempted to clarify the ecological effects of precipitation by explaining the relationship between precipitation and vegetation in terms of the time-lag relationship using the Integrated Multi-satellite Retrievals for Global Precipitation Measurement algorithm, Moderate Resolution Imaging Spectroradiometer, and hydrological databases. Precipitation, vegetation, and area of surface water in the YRB showed increasing trends from 2000-2021 (e.g., 7.215 mm/yr, 0.004 NDVI/yr, and 0.932 km2/yr, respectively). The water level in the upper reaches of the YRB showed a downward trend, whereas that in the middle and lower reaches exhibited an upward trend. Changes in precipitation had a positive effect on vegetation and surface water in the YRB, with correlation coefficients of 0.63 and 0.51, respectively. The responses of NDVI and surface water elevation to precipitation were heterogeneous and delayed, with the majority showing a lag time of approximately ≤ 16 days. Moreover, the lag times of Longyangxia Lake and Ngoring-Co Lake were 0 and 8 days, respectively. We showed that precipitation variability can effectively explain vegetation improvement and increases in surface water elevation, while providing a proven scenario for predicting the surface water and vegetation productivity under the influence of climate change.

Cite this article

SHI Xiaorui , YANG Peng , XIA Jun , ZHANG Yongyong , HUANG Heqing , ZHU Yanchao . Effects of precipitation on vegetation and surface water in the Yellow River Basin during 2000-2021[J]. Journal of Geographical Sciences, 2024 , 34(4) : 633 -653 . DOI: 10.1007/s11442-024-2221-3

1 Introduction

Understanding large-scale precipitation changes under climate warming is critical for regional water resource management and ecological sustainability (Alexander et al., 2006; Kusangaya et al., 2014; Liu et al., 2021b). Changes in surface water and the natural recovery of vegetation are critical indicators for scheduling water allocation and green development (Matchaya et al., 2019; Li et al., 2021). However, significant changes in China’s vegetation and hydrological processes have occurred owing to the climate change and human intervention (Wu et al., 2017; Liu et al., 2021a; Liu et al., 2023). Moreover, the characteristics of changes in precipitation, vegetation, and surface water under climate change over long periods and their inter-relationships can help understand the adaptation and resilience of regions sensitive to precipitation (Nijssen et al., 2001), which is critical for the regional ecosystem and social environment (van der Pol et al., 2015).
The impact of climate change on socio-environmental and anthropogenic activities has rendered the spatial and temporal variability of precipitation in various regions of the world crucial for studying ecosystems and hydrological processes (Chen et al., 2015). The normalized difference vegetation index (NDVI), a crucial metric for crop growth and nutritional information, is largely influenced by the magnitude, frequency, and intensity of precipitation (Herrmann et al., 2005; Fensholt et al., 2009; Liu et al., 2018). Moreover, vegetation changes and contemporaneous rainwater usage can be integrated into NDVI to investigate regional landscape characteristics (Holm et al., 2003; Wessels et al., 2007). The reduction in precipitation has caused changes in hydrological processes in the lakes, which is essentially dominated by precipitation (Morgan et al., 2020; Gbetkom et al., 2023). NDVI typically increases with precipitation until it reaches a “saturation” state (Nicholson and Farrar, 1994; Meng et al., 2023). The optimum period for vegetation nutrient uptake typically occurs following precipitation, with the lag time varying according to the environment and vegetation type (Wang et al., 2001; Wang et al., 2003; Wu et al., 2015). However, surface water and precipitation show a strong positive correlation, with only few exceptions (van Dijk et al., 2015; Gupta et al., 2016; Miao et al., 2020). Thus, vegetation and surface water dynamics can be affected by changes in precipitation (Gu et al., 2018; Gbetkom et al., 2023). Despite decades of observations of the effects of precipitation on vegetation and surface water, systematic research on the spatio-temporal evolution of vegetation and precipitation and the response to climate change at 16-day or even one-day intervals is lacking.
The Yellow River Basin (YRB) is in arid, semi-arid, and semi-humid regions of China, with a delicate ecological balance. The vegetation cover and surface water of the basin have changed owing to climate change and anthropogenic activities (Feng et al., 2016; Liu et al., 2019). Many scholars have investigated the spatio-temporal evolution of precipitation, vegetation, and surface water (Chuai et al., 2013). Spatial heterogeneity exists in precipitation-vegetation-surface water; however, only a few studies have comprehensively characterized diverse watersheds. Additionally, the driving role of climate variability toward vegetation and surface water has previously been analyzed (Cui and Shi, 2010). Two approaches were used to attribute impacts of climate variability. One focused on trends in the variables or dependencies based on correlation coefficients (Chang et al., 2007; Zheng et al., 2009; Hao et al., 2012; Zhang et al., 2020). For example, Zheng et al. (2009) observed a positive correlation between the dryness of the headwater catchment of the YRB and the sensitivity of surface water to precipitation. Hao et al. (2012) revealed that annual precipitation is highly correlated with NDVI in the upper reaches of the YRB. The other approach focused on the time-lag analysis for determining when surface factors respond dramatically in the period following climate change as the effects of precipitation on vegetation and surface water are generally delayed in most cases (Kong et al., 2020; Yuan et al., 2020). However, the study of the relationships between the characteristic elements in YRB has mostly been conducted using one of the aforementioned approaches, which is unimodal. Moreover, previous studies concentrated on the monthly scale analysis lags (Wang et al., 2018; Zhan et al., 2022), causing the assessment results to be rough. Furthermore, the previous study is slightly outdated (Jiang et al., 2015). Research on this topic is limited and lacks the analyses of spatial and temporal characteristics and time-lag effects at fine time and multi-spatial scales. Therefore, we applied the statistical analyses and time-lag effects in an integrated manner to explore the coupled behavior of precipitation, vegetation, and surface water.
Here, we aimed to: (1) examine the spatial and temporal characteristics of the environmental parameters including precipitation, vegetation cover, and surface water in the entire YRB on an annual and seasonal basis under recent climatic conditions; (2) determine the correlation and lag time between precipitation and vegetation cover on a per-image basis to explore the effect of precipitation fluctuations on changes in vegetation; and (3) investigate the correlation and lag time between precipitation and surface water based on the location. We effectively assessed the impact of precipitation fluctuations on vegetation and surface water in the YRB under recent climate change conditions and provided a feasible prognosis for ecological restoration and water resource scheduling.

2 Study region and data

2.1 Study region

The YRB (32°-42°N, 96°-119°E) is in northern China, with relatively scarce water resources and a fragile ecosystem, originating in the northern foothills of Bayankara Mountains in Qinghai province, flowing through nine provincial-level regions, including Qinghai, Sichuan, Gansu, Ningxia, Inner Mongolia, Shaanxi, Shanxi, Henan, and Shandong. It comprises eight sub-basins: above Longyangxia Lake (LYX), LYX to Lanzhou, Lanzhou to Hekou, the inner flow area, Hekou to Longmen, Longmen to Sanmenxia, Sanmenxia to Huayuankou, and below Huayuankou (Lv et al., 2022). The total length of the main river is approximately 5,464 km, with a watershed area of approximately 795,000 km2, representing approximately 8.3% of Chinese territory (Zhang et al., 2021). The terrain is generally high in the west and low in the east, spanning four geomorphological units: the Tibetan Plateau, Loop Plain, Loess Plateau, and Huang-Huai-Hai Plain (Wang et al., 2021). The watershed is a typical climate-sensitive area, with average annual precipitation and evaporation values of 470 and 1000 mm, respectively; rainstorms account for more than 60% of the annual precipitation (Chen et al., 2016).
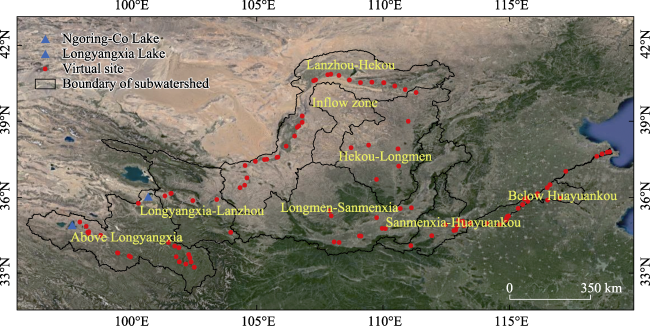
Figure 1 Distribution of Yellow River Basin boundaries and associated hydrological monitoring points

2.2 Data

2.2.1 Precipitation data

The global precipitation measurements (GPM) used in this study were obtained from the National Aeronautics and Space Administration (NASA) website (https://gpm.nasa.gov/data). The accuracy of the Integrated Multi-satellitE Retrievals for GPM (IMERG) precipitation products have been demonstrated globally since the release (Anjum et al., 2018; Shi et al., 2020). The most recent iteration of the IMERG; IMERG V06 (IMERG-f), was used to select daily statistics with an image resolution of 0.1°, encompassing the available data. Additionally, the IMERG-f product was chosen due to its high accuracy compared with IMERG-e (early) and IMERG-l (late) owing to calibration against ground precipitation stations. The data covering the period from June 1, 2000 to September 30, 2021 were calibrated, merged, interpolated, and fused (Tan et al., 2019). To ensure the entirety of the annual precipitation data for the years 2000-2021, data from January 1 to May 31, 2001 and October 1 to December 31, 2020 from the IMERG-f product were used to replace the missing data for the first five months of 2000 and last four months of 2021, respectively. The precipitation data over the YRB needed to be integrated over a period of 16 days to ensure consistency with the Moderate Resolution Imaging Spectroradiometer (MODIS).

2.2.2 Vegetation cover data

NDVI was used to assess the spatial and temporal variation in vegetation cover and was derived from the MODIS vegetation index (MOD13Q1) version 6 data obtained by the Terra satellite with a spatial resolution of 250 m and generated every 16 days (Ma et al., 2023). The continuum index of the NDVI was derived from the MOD13Q1 product of the National Oceanic and Atmospheric Administration Advanced Very High-Resolution Radiometer. NDVI data of 2000-2021 were downloaded from the United States Geological Survey (https://www.usgs.gov/) and processed by removing invalid values, multiplying by a scale factor, and cropping using Python script. Moreover, due to the timing of the satellite product release, NDVI for the year 2000 only became available since the 49th day; therefore, data for the first 48 days of 2001 were used as a supplement.

2.2.3 The HYDROWEB water level

The HYDROWEB data center (available at: https://hydroweb.theia-land.fr/), which was set up in collaboration with laboratories in Toulouse, France and the National Institute of Hydrology of the Russian Academy of Sciences, provided us free access to information on the water level and area for more than 150 lakes worldwide (Cretaux et al., 2011). The water level and area information of the period ranging from 2000 to 2021 were obtained and fused with diverse satellite sensor data, such as MODIS, advanced synthetic aperture radar China-Brazil Earth Resources Satellite (ASAR CBERS), and Landsat, as well as from a variety of satellite radar altimetry data. The data of most lakes and rivers are available since 1992 and are updated almost instantly, although the time sampling frequency is sporadic. However, only two lakes, namely, Ngoring-Co (NL) and LYX, and 107 sounding stations are within the YRB.

3 Methodology

3.1 Trend analysis

Trend analysis can be used to determine the seasonal characteristics of precipitation in the specific scheme of removing the median of the same month in the time series from the original monthly values of 2000-2021 and dividing by the maximum deviation to obtain the time series of precipitation anomalies. Details of the calculation help to quantify the deviation of precipitation relative to typical values, and analyze long-term precipitation trends. The deviation is expressed as follows:
$\begin{matrix} anomaly=\frac{raw~monthly\ p\text{recipitation}-median\ monthly\ p\text{recipitation}}{maximum~monthly\ p\text{recipitation}-median\ monthly\ p\text{recipitation}} \\\end{matrix}$

3.2 Spatio-temporal analysis of precipitation and vegetation

Multivariate statistical analysis using empirical orthogonal functions (EOF) was conducted to determine the spatial and temporal variability of vegetation cover and precipitation during 2000-2021. EOF is widely used in meteorology and oceanography as a powerful tool for data compression and dimensionality reduction to efficiently analyze long time series of remote sensing or direct-measurement datasets (Beckers and Rixen, 2003). The basic principle is the decomposition of the field of physical quantities into space and time vectors, such that the covariance matrix is transformed into a diagonal array, forming a new orthogonal coordinate system. Each orthogonally decomposed mode has associated two-dimensional spatial and temporal coefficients and provides the percentage of variance contribution (Wallace et al., 1993). The more original the information contributed by a mode is, the higher is the variance value (Kim and Wu, 1999; Kim et al., 2015). Therefore, MODIS and IMERG remote sensing images comprising millions of pixels are suitable for investigation using the EOF method, which analyzes spatial evolution characteristics at different time scales by distinguishing between seasonal and interannual signals. The raw data from MOD13Q1 and IMERG were collated to regularize their resolution. A temporal resolution of 16 days defined seasonal and intra-seasonal features, whereas EOF analysis with a temporal resolution of 1 year defined the interannual features. The EOF analysis method is expressed as follows:
$\begin{matrix} CV=VE \\ \end{matrix}$
$\begin{matrix} E=~\left[ \begin{matrix} {{\lambda }_{1}} & 0 &... & 0 \\ 0 & {{\lambda }_{2}} &... & 0 \\ \vdots & \vdots &... & \vdots \\ 0 & 0 &... & {{\lambda }_{m}} \\ \end{matrix} \right] \\ \end{matrix}$
$\begin{matrix} PC={{V}^{T}}X \\ \end{matrix}$
$\begin{matrix} S=\frac{{{\lambda }_{k}}}{\mathop{\sum }_{i=1}^{m}{{\lambda }_{i}}}\times 100\% \\ \end{matrix}$
where X, C, E, V, PC, and S denote the variable distance level value, covariance matrix, eigenvalue diagonal matrix, eigenvector, time coefficient, and variance contribution rate, respectively.

3.3 Lag Time analysis

The relationships between precipitation, NDVI, and surface water were determined using correlation analysis. Time-lag effects were analyzed to determine whether changes in vegetation growth or surface water were significantly influenced by precipitation conditions, based on the correlation of the time series of the two sets of study variables (Clark and Bjornstad, 2004). IMERG data were integrated over a period of 16 days and correlated with MODIS data for the same period; subsequently, the correlations and lag times were calculated for each grid cell, from which the location and pattern of sensitivity of vegetation to precipitation response could be determined. The response between precipitation and surface water was calculated station-wise based on a gridded precipitation dataset obtained by interpolating the inverse distance weights for 107 hydrological soundings and two lakes. Surface water elevations and areas were averaged in increments of 16 days and matched to the precipitation time series, which also yielded correlations and time delay values. The equation is as follows:
$\begin{matrix} {{R}_{{{X}_{t}}{{Y}_{t+n}}}}=\frac{\mathop{\sum }^{}\left( {{X}_{t}}-{{{\bar{X}}}_{t}} \right)\left( {{Y}_{t+n}}-{{{\bar{Y}}}_{t+n}} \right)}{\sqrt{\mathop{\sum }^{}{{\left( {{X}_{t}}-{{{\bar{X}}}_{t}} \right)}^{2}}\mathop{\sum }^{}{{\left( {{Y}_{t+n}}-{{{\bar{Y}}}_{t+n}} \right)}^{2}}}} \\ \end{matrix}$
where R is the correlation coefficient of time series X and Y at time t+n, and ${{\bar{X}}_{t}}$ and ${{\bar{Y}}_{t+n}}$ are the corresponding mean values.

4 Results

4.1 Spatio-temporal characteristics of precipitation in the YRB

Figure 2 shows the intra-seasonal spatial distribution of precipitation in the YRB over the past 20 years. The spatial distribution of seasonal and intra-seasonal precipitation varied significantly, exhibiting the characteristics of dry winters and springs and concentrated precipitation in summer and autumn. In most areas, a maximum of four consecutive months of precipitation occurred from June to September, with the highest precipitation being experienced in July and August, whereas heavy autumn rain was only observed in western China.
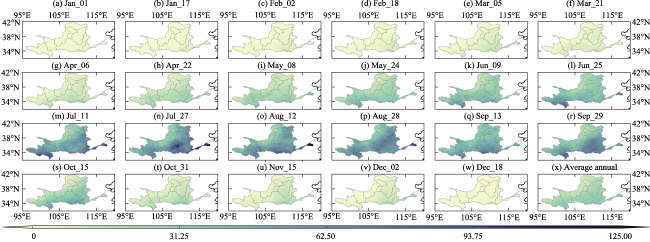
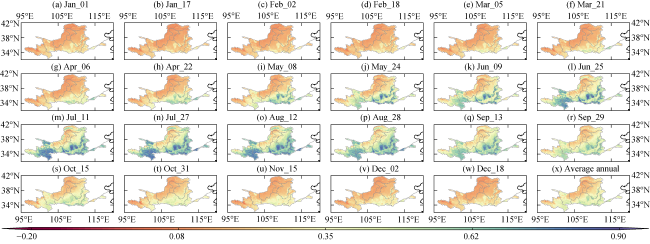
Figure 2 Spatial distribution of precipitation in the Yellow River Basin at 16-day intervals and annual averages
Figure 3 shows the results of the EOF analysis of seasonal and intra-seasonal precipitation variability in the YRB. The first orthogonal model (EOF1) contributed 93.10% of the overall variability between and within the precipitation seasons (Figure 3a). As the seasonality of the YRB and intra-seasonal precipitation trends were generally consistent (i.e., all EOF1 variance contributions were positive), the significance of this seasonal variability can be understood by the spatial pattern of EOF1. Seasonal variations in precipitation were evident across the basin (EOF1 > 0.88), whereas EOF1 values fluctuated between 0.02 and 0.10 at the sub-basin scale wherein the most pronounced variations were observed above LYX and below Huayuankou. The seasonal characteristics of the LYX from Lanzhou and Longmen to Sanmenxia (EOF1 of > 0.98) were highly significant and sensitive to precipitation, resulting in the most prominent variation in precipitation throughout the year. However, relatively insensitive isolated blocks (EOF1 < 0.92) were observed above the LYX, below Huayuankou, and in the inland flow zone. Moreover, PC1 showed a “single-peaked function” curve variation, with positive phases being concentrated from May to October. The asymmetric curve led to a skewed distribution of PC1, with peak precipitation on July 27 (PC1 > 1) and minimum precipitation on December 18 (PC1 < -1) (Figure 3b).
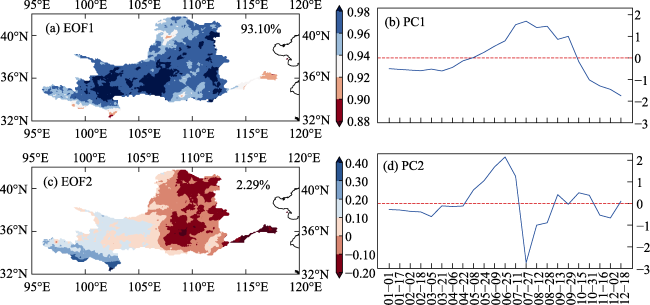
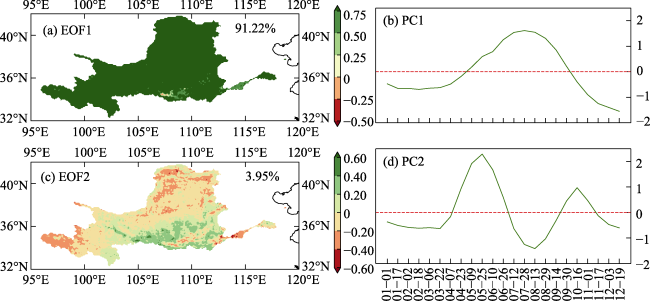
Figure 3 Intra-seasonal EOF characteristics of precipitation in the Yellow River Basin (EOF1 and EOF2 denote the first and second modes of EOF analysis, respectively, while PC1 and PC2 are the temporal weight changes corresponding to the variance.)
The second model (EOF2) contributed only 2.29% of the variance and had positive and negative variances compared with EOF1, corresponding to the western and central-eastern parts of the YRB, respectively (Figure 3c). In the west, a period of precipitation was observed, but the lowest single peak was observed in late July according to the positive variation. Therefore, the sinusoidal curve in PC2 was only relevant for the negative variance of the central-eastern region (Figure 3d). The occurrence of precipitation is important in the context of its physical significance, with a bimodal precipitation cycle and the formation of a reversal with July 27 as the node, and an increase in values in July.
Figure 4 shows the results of the EOF analysis of the interannual precipitation variability in the YRB. Compared with the seasonal characteristics, the interannual EOF characteristics exhibited less spatial consistency, owing to the dispersion of the variance interpretation, wherein the variance contributions of the first and second models were 43.42 and 19.68%, respectively. Although the dominance of the variance explained by the first model declined, it was vital in explaining the main precipitation changes in the YRB from 2000 to 2021.
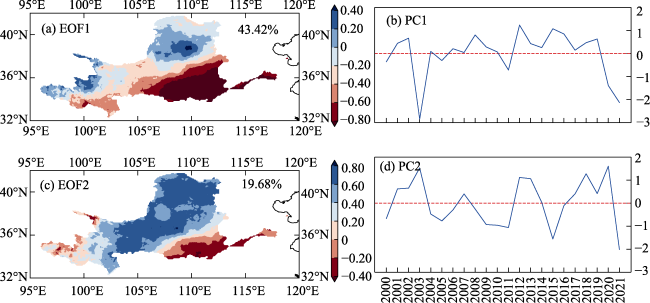
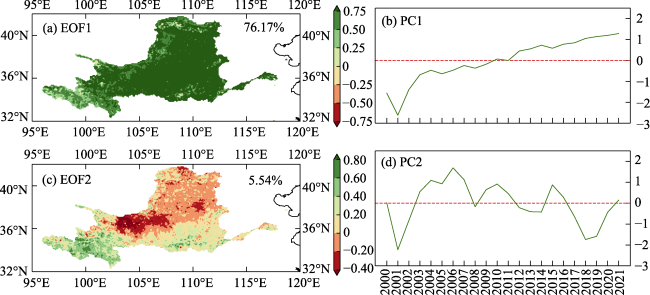
Figure 4 Interannual EOF characteristics of precipitation in the Yellow River Basin (ab and cd denote the results of the first and second modes, respectively.)
The distribution of the first mode was heterogeneous throughout the basin, showing the general trend of precipitation from 2000 to 2021 (Figures 4a and 4b). The average annual precipitation in the YRB showed a stepwise change from northwest to southeast, with mean, maximum, and minimum annual precipitation values of 496.79, 653.81, and 420.40 mm, respectively (Table 1). Significant differences were observed in the precipitation trends between the basins, with the average annual precipitation in each basin being highest downstream, followed by midstream and upstream, as the corresponding proportion of negative EOF1 decreases and negative PC1 dominates. In terms of subsections, the minimum value of the negative variance was observed from Sanmenxia to Huayuankou and below Huayuankou, whereas the maximum value of the positive variance was observed above LYX and from Hekou to Longmen. The fluctuating upward trend in annual precipitation was attributed to the fact that both the absolute value of the negative variance and the percentage of basin area for EOF1 were greater than those of the positive variance, such that the YRB had an opposite cycle to PC1. The inference based on the variation in PC1 is that precipitation increased significantly in 2003 and 2020 and decreased significantly in 2004, with a general upward trend in annual precipitation. The second mode showed a “negative-positive- negative” trend from west to east that emphasized the spatial heterogeneity of interannual precipitation variability. When the central region was dry or wet, the other regions behaved in the opposite manner (Figures 4c and 4d).
Table 1 Annual precipitation in the Yellow River Basin during 2000-2021
Year Precipitation (mm) Year Precipitation (mm)
2000 420.40 2011 498.11
2001 422.45 2012 504.67
2002 429.20 2013 499.57
2003 592.00 2014 512.29
2004 446.11 2015 436.55
2005 442.05 2016 514.40
2006 434.28 2017 540.50
2007 499.06 2018 577.97
2008 450.40 2019 536.91
2009 458.94 2020 653.81
2010 463.14 2021 596.56
Figure 5 shows the raw cumulative and anomalous values of monthly precipitation, demonstrating the extent and duration of the fluctuations in precipitation. Most of the precipitation in the YRB occurred between May and October, varying between 79 and 185 mm (Figure 5a). During this period, the precipitation intensity in July was the highest, accounting for 20% of the annual precipitation, and is an important climate indicator. The monthly precipitation varied between 50 and 190 mm, with lower values in 2002, 2013, and 2015 and higher values in 2003, and 2020 (Figure 5c).
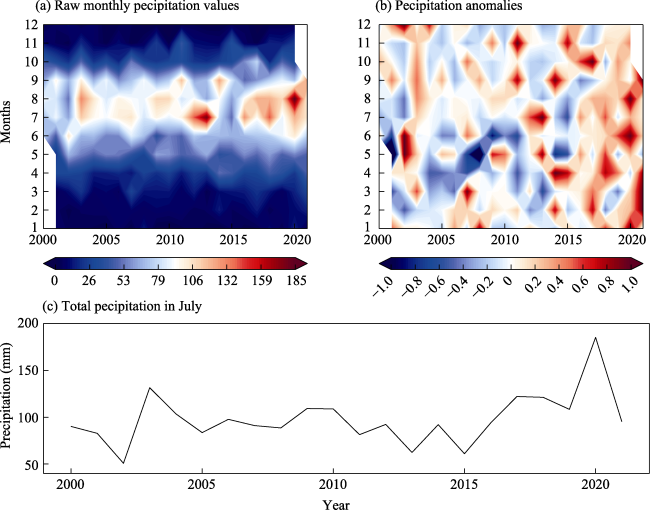
Figure 5 Monthly precipitation in the Yellow River Basin from 2000 to 2021 (a and b show raw and anomaly monthly precipitation respectively, whlie c shows temporal variation in the month of maximum precipitation.)
The precipitation anomaly map illustrates annual precipitation dynamics, with a general increasing trend; however, the trend was not consistent throughout the study period (Figure 5b). Sudden changes in precipitation occurred in 2003, 2007, and 2015, as indicated by marked differences in the characteristics of the temporal anomalies compared with those of the adjacent years, resulting in high precipitation in 2003 and 2007 and low precipitation in 2015. In years with less precipitation, negative anomalies of longer duration were recorded in January-March and July-November of 2002, and May-August of 2015. Contrarily, a positive anomaly of 1 year was recorded in 2003, which explained the lowest negative variability in precipitation in 2003 (Figure 4b). Additionally, all months in 2020, except April, had positive anomalies that were generally larger than those in 2003, which corresponded to a larger volume of precipitation in 2020. Positive and negative anomalies were evident for a comparable period from 2011-2014, indicating that precipitation fluctuated less during that interval. Conversely, positive anomalies were dominant and tended to increase after 2015, signaling an upward trend in precipitation during that period.

4.2 Spatio-temporal characteristics of vegetation cover in YRB

Figure 6 shows the intra-seasonal spatial distribution of NDVI in the YRB over the past 20 years. The distribution of vegetation showed strong spatial variation, with a general zonal distribution from southeast to northwest, with differences related to physical geography and hydrological conditions. The low-value area of NDVI was from Lanzhou to Hekou and the inland flow area, which included the Mu Us Sandy Land and Inner Mongolia in the north. The low vegetation cover in the southwestern river source areas of the basin and the Qinghai Plateau were closely related to climate and precipitation. The high-value NDVI areas were mainly distributed in the southern part of the basin, including LYX to Lanzhou, Longmen to Sanmenxia, and Sanmenxia to Huayuankou, owing to the flat terrain, good water and heat conditions, and a large farmland area.
Figure 6 Spatial distribution of NDVI at 16-day intervals and annual averages in the Yellow River Basin
Figure 7 shows the results of the EOF analysis of the seasonal and intra-seasonal variability of NDVI in the YRB. The cumulative variance contribution of the first two empirical orthogonal models for the seasonal and intra-seasonal variations in vegetation cover was 95.17% (Figures 7a and 7c). The first model showed a variance of 91.22%, wherein seasonal variations in vegetation were consistent with those in precipitation and were significant throughout the YRB (typically, EOF1 > 0.75). More pronounced seasonal vegetation characteristics were observed in the remaining sub-basins, except for those from Sanmenxia to Huayuankou and below Huayuankou. The positive phase of the unimodal PC1 showed that with a gradual increase in precipitation, vegetation became active in May, peaked in July and August, and subsequently became dormant at the end of the rainy season in October. However, the second model (EOF2) explains only 3.95% of the variance. For significant negative variance, this seasonal cycle was reversed, wherein the most considerable vegetation cover was observed between July and September, culminating in August.
Figure 7 Intra-seasonal EOF characteristics of vegetation cover in the Yellow River Basin (ab and cd denote the results of the first and second modes, respectively.)
Figure 8 displays the changes in vegetation cover in the YRB during 2000-2021, generated from the findings of the EOF study based on the annual NDVI. Contrary to those of precipitation, the modal characteristics of vegetation cover had a high degree of dominance, with the first model explaining 76.17% of the interannual variation in vegetation cover. Combined with the dominance of positive variance and the increasing trend in PC1, we inferred that vegetation cover largely increased across the catchment (Figures 8a and 8b). The vegetation in the middle and lower reaches of the YRB showed a trend toward improvement, with far greater areas of improvement than degradation and a greater increase than in the upper reaches (Figure 7a). Furthermore, EOF1 was lower along the margins than along the center, usually at <0.25. Moreover, the vegetation cover considerably fluctuated until 2004 and steadily increased after 2005 (Figure 7b). However, the second model explained only 5.54% of the variance, with an inversion of the interannual cycle of variability and decreasing EOF2 values from southeast to northwest, consistent with the spatial distribution characteristics of NDVI.
Figure 8 Interannual EOF characteristics of vegetation cover in the Yellow River Basin (ab and cd denote the results of the first and second modes, respectively.)

4.3 Surface water characteristics in the YRB

Figure 9 shows the multiyear averages of the surface water elevation and area for the seven sub-basins from 109 stations. The surface water characteristics of the basin are distinctly spatially heterogeneous, wherein the multiyear averages of surface water elevation gradually decreased from west to east. The surface water elevations above LYX, LYX to Lanzhou, Lanzhou to Hekou, Longmen to Sanmenxia, Hekou to Longmen, Sanmenxia to Huayuankou, and below Huayuankou were 3895, 2094, 1062, 425, 878, 135, and 31 m, respectively. The mean surface water area of the two lakes was 1042 km2.
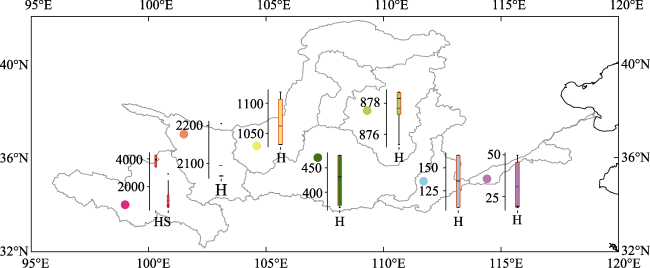
Figure 9 Surface water level characteristics of the seven sub-basins of the Yellow River Basin (H and S represent surface water height and lake area, respectively.)

4.4 Response of surface water and NDVI to precipitation in the YRB

Figure 10 shows the spatial distribution of the maximum correlation and lag time between surface water and precipitation at 109 locations. The maximum correlation between surface water elevation and precipitation ranged from 0.33 to 0.65, with a mean value of 0.51, whereas the time-lag ranged from 0 to 200 days, with more than 70% of stations showing a time delay of 16 days or less. Therefore, the water-surface heights of most hydrological stations responded quickly to precipitation. Only two lakes, namely, LYX and NL, showed maximum correlations with precipitation, with values of 0.57 and 0.51, respectively, corresponding to lag times of 0 and 8 days.
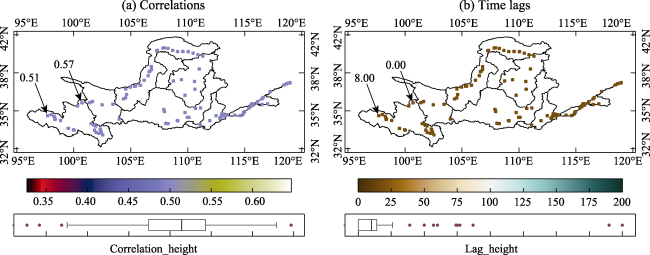
Figure 10 Spatial distribution of maximum correlation and time delay between surface water and precipitation at 109 meteorological monitoring stations in the Yellow River Basin (Arrows point to two lakes.)
Figure 11 shows the spatial distribution of the maximum correlation and time delay between NDVI and precipitation. Compared with that between surface water, the maximum correlation between NDVI and precipitation ranged from 0.40 to 0.72, showing a weakening trend from northeast to southwest; therefore, NDVI was more responsive to changes in precipitation. Moreover, variability was observed among different sub-basins, with higher correlations in the three sub-basins from Lanzhou to Hekou, the inland flow area, and Hekou to Longmen, moderate correlations from Sanmenxia to Huayuankou and below Huayuankou, and lower correlations in the other basins. Notably, a maximum correlation of less than 0.50 was only observed to the south of the Longmen to Sanmenxia Basin. Although the time delay ranged from 0 to 32 days, NDVI lagged precipitation by 16 days for almost all grid cells. The absence of a lag in NDVI for precipitation mostly occurred from Longmen to Sanmenxia and rarely from Lanzhou to Hekou. However, a lag of up to 32 days was least likely to occur across the YRB, with only isolated points being distributed from Lanzhou to Hekou and NL.
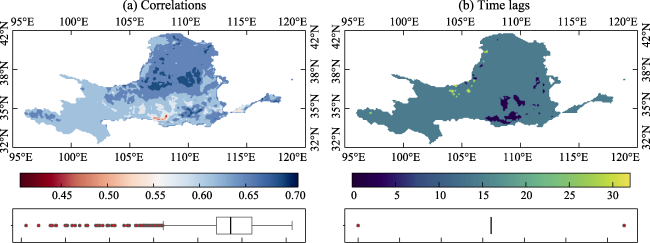
Figure 11 Spatial distribution of maximum correlation and time delay of NDVI and precipitation in the Yellow River Basin

5 Discussion

To validate the reliability of the analysis of the EOF results of precipitation and vegetation cover, the Mann-Kendall (MK) method was used for trend analysis of precipitation and vegetation cover and to detect the characteristics of the annual average cumulative precipitation and NDVI in the YRB during 2000-2021. All the trends in precipitation, vegetation and surface water are shown in Table 2. We observed a significant upward trend in the annual mean values of NDVI and precipitation (p<0.05), a feature consistent with the interannual EOF variation in precipitation and NDVI, and a higher upward trend in precipitation than in NDVI. Furthermore, the surface water area above LYX showed no trend change, although its slope increased, confirming the characteristics of open water variability indicated by Cao et al. (2022). This implies that an increase in annual precipitation in the upper LYX, which is a major catchment area, directly affects open water (Zhang et al., 2017). The water level and runoff in the source area of the YRB declined over the past 20 years, which is related to higher soil evaporation and increased precipitation penetration (Chen et al., 2023).
Table 2 Results of the MK test for precipitation, vegetation cover, and surface water in the Yellow River Basin
Time period Region Trend H P Slope
Rainfall 2000-2021 Yellow River increasing TRUE 0.000 7.215
Surface water area 2000-2021 Above Longyangxia no trend FALSE 0.910 0.932
NDVI 2000-2021 Yellow River increasing TRUE 0.000 0.004
Surface water height 2000-2021 Above Longyangxia no trend FALSE 0.128 -30.915
2017-2021 Longyangxia-Lanzhou no trend FALSE 0.221 -0.661
2008-2021 Lanzhou-Hekou no trend FALSE 0.125 7.817
2016-2021 Longmen-Sanmenxia increasing TRUE 0.024 27.056
2018-2021 Hekou-Longmen no trend FALSE 0.734 0.458
2016-2021 Sanmenxia-Huayuankou no trend FALSE 0.060 14.349
2008-2021 Below Huayuankou no trend FALSE 0.063 2.225
The hydrological and vegetation dynamics of the YRB have been extensively studied. For example, Wang et al. (2022) confirmed that over the last 20 years, precipitation in the source area of the YRB displayed an insignificant increasing trend. However, Li et al. (2016) concluded that precipitation showed spatial variability that increased along a gradient from northeast to southwest, consistent with the results of our study. NDVI showed a significant increasing trend during 2000-2021, indicating that the YRB has experienced significant greening in the past 22 years, corroborating with the results of previous studies (Zhang et al., 2020; Dai et al., 2022). Here, the NDVI slope in YRB was 0.004/yr (p<0.001), which was larger than the annual NDVI trend reported by Jiang et al. (2015) in 2000-2010 (0.0011/yr). The expanded duration may account for the difference. Similar to the spatial heterogeneity of NDVI observed in the past in different districts of YRB, the NDVI values were higher and lower in the southeast and northwest, respectively. Moreover, vegetation growth also revealed a significant shift in 2000-2004, which is similar to the spatial and temporal patterns of NDVI revealed by Jiang et al. (2015). Additionally, the area of vegetation improvement was much larger than that of vegetation degradation, which was mostly concentrated in the middle plain urban cluster, Huang-Huai-Hai Plain, and Qinghai-Tibet Plateau (Deng et al., 2022). Consequently, we inferred that vegetation dynamics are strongly influenced by anthropogenic activities, such as land-use change and grazing (Song et al., 2009; Liang et al., 2012). Measuring vegetation dynamics provides insight into watershed ecology, however, efforts must be focused on reconciling the relationship between urban expansion and ecological protection (Jiang and Zhang, 2016). Contrary to previous studies, we also focused on portraying the overall and local characteristics of precipitation and NDVI every 16 days, with finer timing. The maximum precipitation in July, as an essential indicator of climate change, has the greatest impact on both vegetation and surface water. Considering the example of precipitation, the seasonal characteristics of the basins from LYX to Lanzhou and Longmen to Sanmenxia are highly significant. Moreover, the active time of vegetation corresponds to precipitation.
Most of the YRB is situated in an arid or semi-arid zone, which is extremely sensitive to climate change; thus, precipitation characteristics play a crucial role in changes in vegetation cover and surface water resources, which has been confirmed by several studies (Hu et al., 2021; Lu et al., 2021; Ren et al., 2022). However, the studies focused on the interrelationship between two elements. The increases in vegetation and open water in the YRB over the past 20 years are strongly associated with changes in precipitation (Yang et al., 2010). Therefore, in this study, we integrated precipitation, vegetation, surface water level, and lake area, and provided a unified precipitation-vegetation-surface water system. The time-lag of the response of surface water level to precipitation change is mostly within 16 days. Moreover, vegetation is more reliant on precipitation, with an average delay in response of 16 days, consistent with the response pattern of the Loess Plateau catchment revealed by Kong et al. (2020). Notably, the sensitivity of the degree of responsiveness was closely related to factors such as water availability and vegetation distribution (Bao et al., 2021). Previous studies have focused on the presence of a temporal lead or lag between elements, ignoring the impact of time-lag effects on ecosystems. At shorter lag times (0 days), the response of agricultural land to precipitation was more pronounced, whereas at longer lag times (32 days), the response of bare land was stronger, consistent with the pattern revealed by Gbetkom et al. (2023) and Sanogo et al. (2021). Furthermore, compared with other watersheds, such as Dongting Lake, where the response of vegetation to precipitation is seasonal with a lag time of 140 days, the response of the YRB was more rapid, which may be ascribed to the dry climate and poor soil water storage capacity (Jiang et al., 2011).
The success of the multi-component EOF statistical approach in the semi-monthly and annual analyses of spatio-temporal characteristics demonstrates the generality and ability to independently identify spatio-temporal variability. As global warming and the high incidence of extreme weather events pose great challenges to ecological conservation and water management, our results are particularly important for predicting vegetation and surface water changes in watersheds. However, the methodology of the study closely integrates the intra-seasonal characteristics and trends of the surface elements within the catchment (i.e., vegetation cover and surface water height and area) with the climatic elements (i.e., precipitation) that drive their variability. These input parameters and results are an important research topic, especially in arid or semi-arid regions. The resulting acquisition of spatial and temporal continuum parameters recorded by remote sensing satellites is the basis for conducting such studies. Nevertheless, the predictability of water variables of watershed or vegetation cover is directly related to the degree of correlation and lagged feedback parameters. Additionally, in this study, we considered the interactions between multiple factors, which helps in improving the spatio-temporal quality of meteorological element modeling. This can be further expanded in future studies to consider additional influences, such as land-use and temperature changes, to predict vegetation and surface water changes more accurately within the watershed.

6 Conclusions

Based on MODIS, IMERG, and HYDROWEB data, we investigated the precipitation, vegetation, and surface water changes and their impact processes in the YRB over the last 20 years using EOF, correlation, and trend tests. The major findings of our study are as follows:
(1) The EOF and MK characteristics of interannual variability supported a fluctuating increase in precipitation and a steady increase in the NDVI, whereas the surface water area also increased with a positive slope. However, an insignificant downward trend was observed in water levels in the section from the river source to Lanzhou.
(2) As the mean correlations of precipitation with vegetation and surface water levels were 0.63 and 0.51, respectively, and those of areas with precipitation were 0.57 and 0.51 for LYX and NL, respectively, precipitation fluctuations were the key climatic factor driving changes in vegetation and surface water.
(3) The seasonal curves of precipitation and NDVI in the YRB had similar trends but different rates. The NDVI responded 16 days after precipitation, whereas more than 70% of the surface water level sites responded within 16 days. Moreover, the delay times for the LYX and NL areas were 0 and 8 days, respectively. These results demonstrate the positive and rapid impact of precipitation on vegetation and surface water.
[1]
Alexander L V, Zhang X, Peterson T C et al., 2006. Global observed changes in daily climate extremes of temperature and precipitation. Journal of Geophysical Research: Atmospheres, 111(D5): 1-22.

[2]
Anjum M N, Ding Y J, Shangguan D H et al., 2018. Performance evaluation of latest integrated multi-satellite retrievals for Global Precipitation Measurement (IMERG) over the northern highlands of Pakistan. Atmospheric Research, 205: 134-146.

DOI

[3]
Bao Z X, Zhang J Y, Wang G Q et al., 2021. The sensitivity of vegetation cover to climate change in multiple climatic zones using machine learning algorithms. Ecological indicators, 124: 107443.

DOI

[4]
Beckers J M, Rixen M, 2003. EOF calculations and data filling from incomplete oceanographic datasets. Journal of Atmospheric and Oceanic Technology, 20(12): 1839-1856.

DOI

[5]
Cao H Y, Han L, Li L Z, 2022. Changes in extent of open-surface water bodies in China’s Yellow River Basin (2000-2020) using Google Earth Engine cloud platform. Anthropocene, 39: 100346.

DOI

[6]
Chang G G, Li L, Zhu X D et al., 2007. Changes and influencing factors of surface water resources in the source region of the Yellow River. Acta Geographica Sinica, 62(3): 312-320. (in Chinese)

[7]
Chen L, Wang Y M, Chang J X et al., 2016. Characteristics and variation trends of seasonal precipitation in the Yellow River Basin. Yellow River, 38(9): 8-12. (in Chinese)

[8]
Chen M J, Tian F, Cao X Y et al., 2023. Hydrological variations in the Yellow River Source area (NE Tibetan Plateau) during the last 7.4 ka inferred from stable isotopes of Ostracod valves. Catena, 232: 107328.

DOI

[9]
Chen Y N, Li Z, Fan Y T et al., 2015. Progress and prospects of climate change impacts on hydrology in the arid region of northwest China. Environmental Research, 139: 11-19.

DOI PMID

[10]
Chuai X W, Huang X J, Wang W J et al., 2013. NDVI, temperature and precipitation changes and their relationships with different vegetation types during 1998-2007 in Inner Mongolia, China. International Journal of Climatology, 33(7): 1696-1706.

DOI

[11]
Clark J S, Bjornstad O N, 2004. Population time series: Process variability, observation errors, missing values, lags, and hidden states. Ecology, 85(11): 3140-3150.

DOI

[12]
Cretaux J F, Jelinski W, Calmant S et al., 2011. SOLS: A lake database to monitor in the near real time water level and storage variations from remote sensing data. Advances in Space Research, 47(9): 1497-1507.

[13]
Cui L L, Shi J, 2010. Temporal and spatial response of vegetation NDVI to temperature and precipitation in eastern China. Journal of Geographical Sciences, 20(2): 163-176.

DOI

[14]
Dai Q, Cui C F, Wang S, 2022. Spatiotemporal variation and sustainability of NDVI in the Yellow River Basin. Irrigation and Drainage, 71(5): 1304-1318.

DOI

[15]
Deng X J, Hu S, Zhan C S, 2022. Attribution of vegetation coverage change to climate change and human activities based on the geographic detectors in the Yellow River Basin, China. Environmental Science and Pollution Research, 29(29): 44693-44708.

DOI

[16]
Feng X M, Fu B J, Piao S et al., 2016. Revegetation in China’s Loess Plateau is approaching sustainable water resource limits. Nature Climate Change, 6(11): 1019-1022.

DOI

[17]
Fensholt R, Rasmussen K, Nielsen T T et al., 2009. Evaluation of earth observation based long term vegetation trends: Intercomparing NDVI time series trend analysis consistency of Sahel from AVHRR GIMMS, Terra MODIS and SPOT VGT data. Remote Sensing of Environment, 113(9): 1886-1898.

DOI

[18]
Gbetkom P G, Cretaux J F, Tchilibou M et al., 2023. Lake Chad vegetation cover and surface water variations in response to precipitation fluctuations under recent climate conditions (2000-2020). Science of the Total Environment, 857: 159302.

DOI

[19]
Gu Z J, Duan X W, Shi Y D et al., 2018. Spatiotemporal variation in vegetation coverage and its response to climatic factors in the Red River Basin, China. Ecological Indicators, 93: 54-64.

DOI

[20]
Gupta N K, Jethoo A S, Gupta S K, 2016. precipitation and surface water resources of Rajasthan State, India. Water Policy, 18(2): 276-287.

DOI

[21]
Hao F H, Zhang X, Ouyang W et al., 2012. Vegetation NDVI linked to temperature and precipitation in the upper catchments of Yellow River. Environmental Modeling & Assessment, 17(4): 389-398.

[22]
Herrmann S M, Anyamba A, Tucker C J, 2005. Recent trends in vegetation dynamics in the African Sahel and their relationship to climate. Global Environmental Change: Human and Policy Dimensions, 15(4): 394-404.

DOI

[23]
Holm A M, Cridland S W, Roderick M L, 2003. The use of time-integrated NOAA NDVI data and precipitation to assess landscape degradation in the arid shrubland of Western Australia. Remote Sensing of Environment, 85(2): 145-158.

DOI

[24]
Hu C H, Ran G, Li G et al., 2021. The effects of precipitation characteristics and land use and cover change on runoff in the Yellow River basin, China. Journal of Hydrology and Hydromechanics, 69(1): 29-40.

DOI

[25]
Jiang C, Zhang L B, 2016. Ecosystem change assessment in the Three-river Headwater Region, China: Patterns, causes, and implications. Ecological Engineering, 93: 24-36.

DOI

[26]
Jiang W G, Hou P, Zhu X H et al., 2011. Analysis of vegetation response to precipitation with satellite images in Dongting Lake. Journal of Geographical Sciences, 21(1): 135-149.

DOI

[27]
Jiang W G, Yuan L H, Wang W J et al., 2015. Spatio-temporal analysis of vegetation variation in the Yellow River Basin. Ecological Indicators, 51: 117-126.

DOI

[28]
Kim K Y, Hamlington B, Na H, 2015. Theoretical foundation of cyclostationary EOF analysis for geophysical and climatic variables: Concepts and examples. Earth: Science Reviews, 150: 201-218.

[29]
Kim K Y, Wu Q G, 1999. A comparison study of EOF techniques: Analysis of nonstationary data with periodic statistics. Journal of Climate, 12(1): 185-199.

DOI

[30]
Kong D X, Miao C Y, Wu J W et al., 2020. Time lag of vegetation growth on the Loess Plateau in response to climate factors: Estimation, distribution, and influence. Science of the Total Environment, 744: 140726.

DOI

[31]
Kusangaya S, Warburton M L, van Garderen E A et al., 2014. Impacts of climate change on water resources in southern Africa: A review. Physics and Chemistry of the Earth, 67: 47-54.

[32]
Li C J, Fu B J, Wang S et al., 2021. Drivers and impacts of changes in China’s drylands. Nature Reviews Earth & Environment, 2(12): 858-873.

[33]
Li Q, Yang M X, Wan G N et al., 2016. Spatial and temporal precipitation variability in the source region of the Yellow River. Environmental Earth Sciences, 75(7): 1-14.

DOI

[34]
Liang S H, Ge S M, Wan L et al., 2012. Characteristics and causes of vegetation variation in the source regions of the Yellow River, China. International Journal of Remote Sensing, 33(5): 1529-1542.

DOI

[35]
Liu H, Zheng L, Yin S J, 2018. Multi-perspective analysis of vegetation cover changes and driving factors of long time series based on climate and terrain data in Hanjiang River Basin, China. Arabian Journal of Geosciences, 11: 1-16.

DOI

[36]
Liu S Y, Huang S Z, Xie Y Y et al., 2019. Spatial-temporal changes in vegetation cover in a typical semi-humid and semi-arid region in China: Changing patterns, causes and implications. Ecological Indicators, 98: 462-475.

DOI

[37]
Liu Y, Tian J Y, Liu R H et al., 2021a. Influences of climate change and human activities on NDVI changes in China. Remote Sensing, 13(21): 4326.

DOI

[38]
Liu Y F, Guo B, Lu M et al., 2023. Quantitative distinction of the relative actions of climate change and human activities on vegetation evolution in the Yellow River Basin of China during 1981-2019. Journal of Arid Land, 15(1): 91-108.

DOI

[39]
Liu Z L, Ding Y P, Jiao Y M, 2021b. Impact of changes in precipitation pattern on food supply in a monsoon interlacing area and its mechanism: A case study of Yunnan province. Journal of Geographical Sciences, 31(10): 1490-1506.

DOI

[40]
Lu C P, Hou M C, Liu Z L et al., 2021. Variation characteristic of NDVI and its response to climate change in the middle and upper reaches of Yellow River Basin, China. IEEE Journal of Selected Topics in Applied Earth Observations and Remote Sensing, 14: 8484-8496.

DOI

[41]
Lv J X, Liu C M, Liang K et al., 2022. Spatiotemporal variations of extreme precipitation in the Yellow River Basin based on water resources regionalization. Resources Science, 44(2): 261-273. (in Chinese)

DOI

[42]
Ma D J, Wu X D, Wang J P et al., 2023. The spatiotemporal scale effect on vegetation interannual trend estimates based on satellite products over Qinghai-Tibet Plateau. Journal of Geographical Sciences, 33(5): 924-944.

DOI

[43]
Matchaya G, Nhamo L, Nhlengethwa S et al., 2019. An overview of water markets in Southern Africa: An option for water management in times of scarcity. Water, 11(5):1006.

DOI

[44]
Meng N, Wang N A, Cheng H Y et al., 2023. Impacts of climate change and anthropogenic activities on the normalized difference vegetation index of desertified areas in northern China. Journal of Geographical Sciences, 33(3): 483-507.

DOI

[45]
Miao C Y, Zheng H Y, Jiao J Y et al., 2020. The changing relationship between precipitation and surface runoff on the Loess Plateau, China. Journal of Geophysical Research: Atmospheres, 125(8): 1-15.

[46]
Morgan B, Awange J L, Saleem A et al., 2020. Understanding vegetation variability and their “hotspots” within Lake Victoria Basin (LVB: 2003-2018). Applied Geography, 122: 102238.

DOI

[47]
Nicholson S E, Farrar T J, 1994. The influence of soil type on the relationships between NDVI, rainfall, and soil moisture in semiarid Botswana: I. NDVI response to rainfall. Remote Sensing of Environment, 50(2): 107-120.

DOI

[48]
Nijssen B, O’Donnell G M, Hamlet A F et al., 2001. Hydrologic sensitivity of global rivers to climate change. Climatic Change, 50(1/2): 143-175.

DOI

[49]
Ren Z G, Tian Z H, Wei H T et al., 2022. Spatiotemporal evolution and driving mechanisms of vegetation in the Yellow River Basin, China during 2000-2020. Ecological Indicators, 138: 108832.

[50]
Sanogo K, Birhanu B Z, Sanogo S et al., 2021. Spatiotemporal response of vegetation to precipitation and air temperature fluctuations in the Sahel: Case study in the Forest Reserve of Fina, Mali. Sustainability, 13(11): 6250.

DOI

[51]
Shi J Y, Yuan F, Shi C X et al., 2020. Statistical evaluation of the latest GPM-Era IMERG and GSMaP satellite precipitation products in the Yellow River Source Region. Water, 12(4): 1006.

DOI

[52]
Song X, Yang G X, Yan C Z et al., 2009. Driving forces behind land use and cover change in the Qinghai-Tibetan Plateau: A case study of the source region of the Yellow River, Qinghai province, China. Environmental Earth Sciences, 59(4): 793-801.

DOI

[53]
Tan J, Huffman G J, Bolvin D T et al., 2019. IMERG V06: Changes to the morphing algorithm. Journal of Atmospheric and Oceanic Technology, 36(12): 2471-2482.

DOI

[54]
van der Pol T D, van Ierland E C, Gabbert S et al., 2015. Impacts of precipitation variability and expected precipitation changes on cost-effective adaptation of water systems to climate change. Journal of Environmental Management, 154: 40-47.

DOI PMID

[55]
van Dijk A, Gash J H, van Gorsel E et al., 2015. precipitation interception and the coupled surface water and energy balance. Agricultural and Forest Meteorology, 214: 402-415.

[56]
Wallace J M, Panetta R L, Estberg J, 1993. Representation of the equatorial stratospheric quasi-biennial oscillation in EOF phase space. Journal of the Atmospheric Sciences, 50(12): 1751-1762.

DOI

[57]
Wang C H, Yang J T, Yang K et al., 2022. Changing precipitation characteristics in the Yellow River Basin in the last 60 years and tendency prediction for next 30 years. Arid Zone Research, 39(3): 708-722.

[58]
Wang F, Wang Z M, Yang H B et al., 2018. Capability of remotely sensed drought indices for representing the spatio-temporal variations of the meteorological droughts in the Yellow River Basin. Remote Sensing, 10(11): 1834.

DOI

[59]
Wang J, Price K P, Rich P M, 2001. Spatial patterns of NDVI in response to precipitation and temperature in the central Great Plains. International Journal of Remote Sensing, 22(18): 3827-3844.

DOI

[60]
Wang J, Rich P M, Price K P, 2003. Temporal responses of NDVI to precipitation and temperature in the central Great Plains, USA. International Journal of Remote Sensing, 24(11): 2345-2364.

DOI

[61]
Wang Y H, Tan D, Han L Y et al., 2021. Review of climate change in the Yellow River Basin. Journal of Desert Research, 41(4): 235-246. (in Chinese)

DOI

[62]
Wessels K J, Prince S D, Malherbe J et al., 2007. Can human-induced land degradation be distinguished from the effects of precipitation variability? A case study in South Africa. Journal of Arid Environments, 68(2): 271-297.

DOI

[63]
Wu D H, Zhao X, Liang S L et al., 2015. Time-lag effects of global vegetation responses to climate change. Global Change Biology, 21(9): 3520-3531.

DOI PMID

[64]
Wu J W, Miao C Y, Zhang X M et al., 2017. Detecting the quantitative hydrological response to changes in climate and human activities. Science of the Total Environment, 586: 328-337.

DOI

[65]
Yang Z F, Li C H, Huang G H et al., 2010. Analysis of relationships between NDVI and climatic/hydrological parameters in the Yellow River basin. International Journal of Environment and Pollution, 42(1-3): 166-183.

DOI

[66]
Yuan M X, Wang L C, Lin A W et al., 2020. Vegetation green up under the influence of daily minimum temperature and urbanization in the Yellow River Basin, China. Ecological Indicators, 108: 105760.

DOI

[67]
Zhan C, Liang C, Zhao L et al., 2022. Drought-related cumulative and time-lag effects on vegetation dynamics across the Yellow River Basin, China. Ecological Indicators, 143: 109409.

DOI

[68]
Zhang J L, Cao Z W, Jin X et al., 2021. Research on comprehensive evaluation of the development quality of the Yellow River Basin. Journal of Hydraulic Engineering, 52(8): 917-926. (in Chinese)

[69]
Zhang Q, Liu J Y, Singh V P et al., 2017. Hydrological responses to climatic changes in the Yellow River Basin, China: Climatic elasticity and streamflow prediction. Journal of Hydrology, 554: 635-645.

DOI

[70]
Zhang W, Wang L C, Xiang F F et al., 2020. Vegetation dynamics and the relations with climate change at multiple time scales in the Yangtze River and Yellow River Basin, China. Ecological Indicators, 110: 105892.

DOI

[71]
Zheng H X, Zhang L, Zhu R R et al., 2009. Responses of streamflow to climate and land surface change in the headwaters of the Yellow River Basin. Water Resources Research, 45(7): 1-9.

Outlines

/