Research Articles

Rainfall effects on wind erosion processes on the simulated Gobi surface using indoor experiments

  • SUN Liying , 1, 2 ,
  • WANG Chunhui 1, 2 ,
  • DUAN Guangyao 3
Expand
  • 1. Key Laboratory of Water Cycle and Related Land Surface Processes, Institute of Geographic Sciences and Natural Resources Research, CAS, Beijing 100101, China
  • 2. College of Resources and Environment, University of Chinese Academy of Sciences, Beijing 100049, China
  • 3. Beijing Water Science and Technology Institute, Beijing 100048, China

Sun Liying (1978-), Associate Professor, specialized in soil erosion processes and soil water conservation. E-mail:

Received date: 2023-04-10

  Accepted date: 2023-11-09

  Online published: 2024-04-24

Supported by

National Natural Science Foundation of China(41930640)

National Natural Science Foundation of China(41977069)

Abstract

In the present study, indoor experiments were carried out to investigate the effects of rainfall on subsequent wind erosion processes on the simulated Gobi surface, with soils and gravels collected from the Alax Gobi in northwestern China. The results showed that the wind erosion rate (WR) ranged from 0.4 to 1931.2 g m-2 min-1 and that the sediment transportation rate (STR) ranged from 0.00 to 51.47 g m-2 s-1 under different gravel coverage conditions (0%, 20%, 40% and 60%) when the wind velocity changed from 6 m s-1 to 18 m s-1. Both WR and STR increased with increasing wind velocity as a power function and decreased with increasing gravel coverage. The rainfall event had significant inhibitory effects on WR and STR, and the complex effects of soil crust formation and the changing soil surface roughness (SSR) by rainfall event played significant roles in reducing these rates during subsequent wind erosion. In this study, a valuable exploration of the effects of rainfall events on subsequent wind erosion processes in the Gobi area was conducted. The findings are of great significance for a better understanding and effective prediction of dust emissions in this region.

Cite this article

SUN Liying , WANG Chunhui , DUAN Guangyao . Rainfall effects on wind erosion processes on the simulated Gobi surface using indoor experiments[J]. Journal of Geographical Sciences, 2024 , 34(3) : 610 -630 . DOI: 10.1007/s11442-024-2220-4

1 Introduction

Wind erosion on the surface of the Gobi Desert causes serious environmental and socioeconomic threats, such as dust storms, sand storms and land degradation, and these events have attracted increasing attention in recent decades (Zhang et al., 2002; Kheirabadi et al., 2018; Zhang et al., 2021). For example, the city of Beijing experienced severe sand and dust storms on March 14-15, 2021, which came from the desert of Inner Mongolia and adversely impacted air quality, traffic and the lives of residents (Filonchyk, 2022; Wang et al., 2022). The sand and dust particles in the Gobi Desert of Inner Mongolia were transported into northern China by a very strong Mongolian cyclone during the following days (Wang et al., 2022). The particles in the suspended dust storms of the Gobi Desert of northwestern China could be transported over long distances, thereby becoming the main component of Asian dust and participating in the global dust cycle (Shao et al., 2011; Kai et al., 2021; Wu et al., 2021). This phenomenon has led to the consensus that the Gobi Desert of northwestern China is a potential source of dust emissions in Central Asia (Zhang et al., 2003; Wang et al., 2012; Taramelli et al., 2013; Kai et al., 2021). Accordingly, dust emissions, sediment transportation and sediment deposition in the Gobi Desert region by wind erosion have attracted increasing attention due to their significant impacts on the environment and humankind (Lu et al., 2001; Wang et al., 2012; DuPont et al., 2021; Pang et al., 2021).
Wind erosion includes three sub-processes: detachment, transportation and deposition (Yan et al., 2018; Shahabinejad et al., 2019). The wind erosion rate (WR) and sediment transportation rate (STR) are impacted by many factors, such as wind type, wind profile, particle size distribution (PSD), non-erodible elements, soil moisture, and soil crust (Raupach et al., 1993; Martz and Li, 1997; Yan et al., 2018; Buyantogtokh et al., 2021; Fattahi et al. 2021; Huang et al., 2021; Negyesi et al., 2021). As the driving force of this process, wind velocity significantly impacts wind erosion. Kheirabadi et al. (2018) found that the wind erosion rate increases with increasing wind velocity as a power function. Chen et al. (1996) found that the wind erosion modulus is positively related to the cube of the wind velocity. The threshold wind velocity shows a close relationship with the particle size distribution of soil (Basaran et al., 2011). Münch et al. (2022) observed that the threshold wind velocity increases for both fine-grained (<63 µm) and coarse-grained (>200 µm) sands, but it is in low value for the medium-grained sands (63-200 µm).
Physical and chemical properties, such as particle size, organic carbon and moisture, are primary contributors to the erodibility of soil to wind. Soil erodibility to wind erosion increases with increasing mean weight diameter (MWD) of soil as a power function with a negative exponent (Zamani and Mahmoodabadi, 2013). The PSD of soil has impacts on the wind erosion rate (Yan et al., 2018). WR is negatively related to clay content and silt content as a power function and is positively related to sand content as an exponential function (Shahabinejad et al., 2019). The PSD of soil also influences the transportation of sediment by wind, as observed through laboratory experiments and theoretical modeling (Martz and Li, 1997). Gillette and Walker (1977) found that the PSD of particles transported in the horizontal flux of 0-1.3 cm is similar to that of parent materials. The ranges of fractions that are the most susceptible to wind erosion vary with the experimental conditions (Chepil, 1945; Zamani and Mahmoodabadi, 2013; Yan et al., 2018; Shahabinejad et al., 2019).
Surface roughness also has important impacts on wind erosion processes and is thus included as an important factor (K′) of the wind erosion equation (WEQ) prediction model, which is one of the most widely used approaches for wind erosion prediction (Van Pelt and Zobeck, 2004; Webb, et al., 2014; Mandakh et al., 2016; Tuo et al., 2016). Normally, the effects of surface roughness include two aspects, namely, oriented roughness and random roughness, which are related to the ridge height-spacing ratio and soil cloddiness (de Oro et al., 2016).
Non-erodible roughness elements, such as vegetation and stones, can impact wind erosion through coverage effects and shear stress partitioning effects (Raupach et al., 1993; Buyantogtokh et al., 2021). Raupach et al. (1993) observed that non-erodible roughness elements can decrease the wind force on erodible surfaces by reducing the downward momentum flux. The partitioning of shear stress differs by the presence of non-erodible elements and leads to the changing threshold conditions of sand saltation (Li et al., 2020). As a kind of non-erodible roughness element, gravel density can increase the threshold friction velocity (Buyantogtokh et al., 2021), alter airflow (Li et al., 2021) and enhance turbulence (Raupach et al., 1980).
Rainfall events may change soil surface characteristics in several manners, such as by altering PSD through particle size selectivity (Koiter et al., 2017; Luo et al., 2020; Quijano et al., 2020; Qi et al., 2023), changing soil surface structure by the formation of soil crust (Tanaka et al., 1999; Lu et al., 2017; Sun et al., 2021) and varying soil surface roughness by reshaping the surface microtopography (Jester and Klik, 2005; Quan et al., 2020). For example, Sun et al. (2023) found that the PSDs both on-slope and off-slope change due to rainfall events, as observed on a simulated Gobi surface. Tanaka et al. (1999) determined the mechanisms and processes of crust formation during natural rainfall events, and Lu et al. (2017) discovered the effects of soil surface crusts on soil surface structures and on erosion processes. Quan et al. (2020) observed a decreasing trend in soil surface roughness after rainfall events. Therefore, these changes caused by rainfall events can impact the following wind erosion processes in the Gobi Desert. However, the effects of rainfall events on subsequent wind erosion processes have been overlooked in previous investigations due to the extremely low amount of annual rainfall. This ignorance should be amendatory in the context of global warming because both temperature and precipitation have been reported to show increasing trends in northwestern China (Li et al., 2013; Li et al., 2016; Cao et al., 2021). The mechanisms of the rainfall effects on subsequent wind erosion processes in the Gobi Deserts should be well understood. To date, the influences of rainfall events on PSD, topsoil crust and soil roughness in the Gobi Desert region are still unclear, and the influences of these processes on subsequent wind erosion processes have yet to be studied.
Thus, in this study, indoor simulation experiments that combine artificial rainfall experiments and wind tunnel experiments were conducted to investigate the mechanisms of the rainfall effects on subsequent wind erosion processes on a simulated Gobi surface. The purposes of this study were (1) to quantify the effects of rainfall events on the WR and STR, (2) to analyze the effects of wind velocity and gravel coverage on wind erosion processes, and (3) to analyze the possible manners by which rainfall events impact wind erosion characteristics. These results could improve the basic understanding of the combined wind and water erosion process in the Gobi Desert of northwestern China. The processes investigated in the present study have significant impacts on the dust emissions and sediment transportation in the Gobi region and should receive more attention in the context of climate change. Moreover, these results could provide a scientific reference for revising the parameters of the wind erosion model to improve the simulation accuracy of the wind erosion model in the Gobi Desert region of northwestern China.

2 Materials and methods

2.1 Experimental soils

Laboratory experiments were conducted in the hall of the State Key Laboratory of Earth Surface Processes and Resource Ecology, Fangshan district, Beijing, China. The experimental soil and gravel were collected from the top 40 cm in the Ejina banner of Inner Mongolia, China (42°01′N, 101°22′E) in the western Alax Gobi (Figure 1a). The Alax Plateau has been recognized as an area of northwestern China that is representative of the Gobi Desert, and it is the major potential source of Asian dust (Wang et al., 2012). According to the data from the nearest meteorological station (Guaizihu Station), the annual precipitation from 1960 to 2015 was approximately 45 mm, with a maximum rainfall intensity of 9 mm h-1 during 2017-2018 and an average evaporation of 4200 mm during 1960-2001 (Wang et al., 2020). The mean wind velocity was approximately 4.6 m s-1, with a maximum value of approximately 14 m s-1 (Wang et al., 2020). The measured mean soil moisture of the sampling soil was 2.7%. A typical landscape of the Gobi sampling site is shown in Figure 1b. The collected soil and gravel samples were dried naturally and sieved through a 2-mm sifter to separate the soil and gravel. The 2-10-mm gravels were collected and prepared for the experiments. The average clay content of the experimental soil was 2.97%, the average silt content was 11.86% and the average sand content was 85.17%.
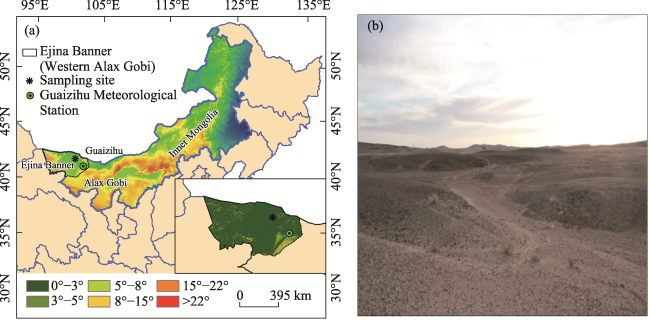
Figure 1 Location and typical landscape of the soil sampling site in Inner Mongolia, China: (a) location and (b) landscape

2.2 Experimental equipment

Squared steel boxes (0.5×0.5×0.2 m; length × width × height) were used for the rainfall and wind tunnel experiments. The prepared steel boxes were first tested on a 3° slope under simulated rainfall experiments and then tested through simulated wind tunnel experiments after drying to constant soil moisture at 2.7%, as the soil moisture in the sampling site was measured at 2.7%.
The experimental equipment included a rain simulator and wind tunnel equipment. An artificial simulated rainfall system (EL-RS3/5) with Veejet 80100 nozzles was used as a rainfall simulator (Sun et al., 2023). With an automatic control system, the spatial homogeneity of the rainfall simulator was greater than 90%, with high stability during long rainfall periods (Sun et al., 2023). The calibration of the spatial homogeneity of the artificial rainfall intensity is shown in Figure 2a.
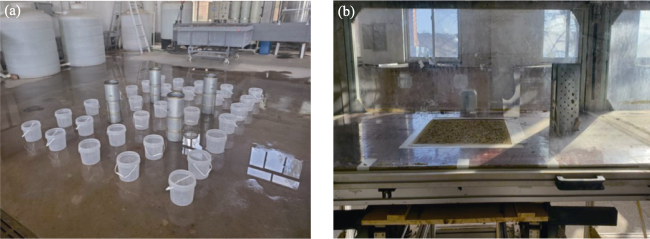
Figure 2 Images of the indoor artificial experiment: (a) calibration of the spatial homogeneity of the rainfall intensity and (b) wind tunnel experiment
The blow-type noncirculating wind tunnel was applied, with a total length of 34.4 m, including a fan section, regulating section, rectification section, experimental section, sand collector and diversion section (Wu et al., 2018). The experimental section measured 16.6 × 1.0×1.0 m (length × width × height). The wind velocity could be controlled automatically from 1 to 40 m s-1. Sand collectors could collect wind erosion particles at different heights, ranging from 1.5 cm to 30 cm at intervals of 2 cm. The distance between the sand collector and the experimental boxes was set at 30 cm (Figure 2b).

2.3 Experimental conditions

The main objective of the present study was to investigate the effects of rainfall on subsequent wind erosion processes in the context of the increasing rainfall intensity in the region of the Gobi Desert in northeastern China. Thus, the rainfall intensity was set at 9 mm h-1 for all rainfall experiments, as the maximum rainfall intensity was 9 mm h-1 during 2017-2018, as measured by the Guaizihu Meteorological Station (41°13′N, 102°22′E, 960 m a.s.l.) closest to the sampling sites (Wang et al., 2020). The experimental wind velocities for the following wind tunnel experiments were set at 6, 8, 10, 12, 14, 16, and 18 m s-1, as the mean wind velocity was approximately 4.6 m s-1 with a maximum value of approximately 14 m s-1 measured by the Guaizihu Meteorological Station (Wang et al., 2020). The rainfall duration was set at 30 min, and the following wind tunnel experiment time was set at 5 min. The sand collection duration was also set at 5 min. The measured range of the gravel coverage of the sampling region was 4.5%-58.3%. Therefore, the gravel coverage was set at 0%, 20%, 40% and 60%. The slope gradient for the rainfall experiment was 3°, as the dominant area of the sampling site was less than 3° (Sun et al., 2023). The antecedent soil moisture content for both the simulated rainfall experiment and wind tunnel experiment was set at 2.7% because the moisture content of the sampling soil was measured at 2.7%. The soil bulk density was set at 1.45 g cm-3, as the measured soil bulk density of the upper layer soil in the sampling sites was 1.45 g cm-3.

2.4 Experimental processes and measurements

2.4.1 Filling of the boxes

Soils were filled into steel boxes with permeable gauze laid at the bottom, which ensured water infiltration through the holes (Sun et al., 2019). To simulate natural conditions, the pretreated experimental soils (dried naturally to constant soil moisture at 2.7% and sieved by a 2-mm sifter) were weighed and filled into the boxes while controlling the soil bulk density at 1.45 g cm-3. The relationship between gravel coverage and gravel mass was determined by imaging using PhotoShop (2020) on a 1×1 m blue Poly Vinyl Chloride (PVC) plate with multiple sets. Then, the homogeneous mixed gravels (2-10 mm) were weighed and evenly spread onto the soil surface to set the gravel coverage at 0%, 20%, 40% and 60%. The simulated Gobi surfaces with different gravel coverages are shown in Figure 3.
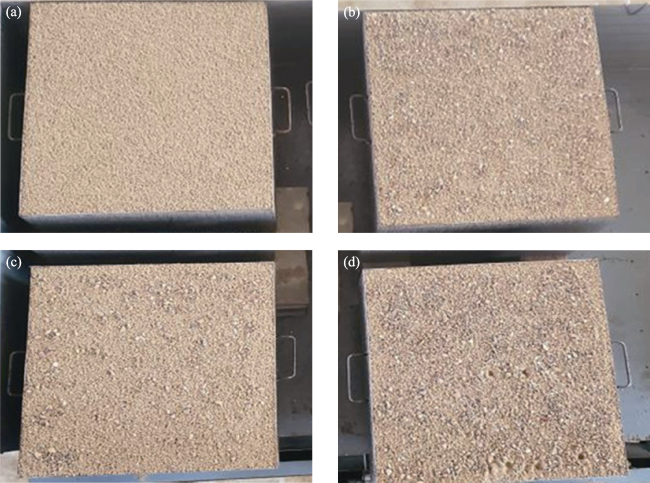
Figure 3 Simulated Gobi surfaces in the experiments with different gravel coverages: (a) 0%; (b) 20%; (c) 40%; and (d) 60%

2.4.2 Rainfall simulation and wind tunnel experiment processes

The filled experimental boxes were separated into 2 groups: a contrast group and a test group. Boxes in the contrast group were not subjected to rainfall experiments. Boxes in the test group were first processed in the rainfall experiments for 30 min at a 3° slope under a rainfall intensity of 9 mm h-1. Then, the soils in the wet boxes were air dried to a constant soil moisture content of 2.7%. Afterward, the boxes in the contrast group and test group were processed for the wind tunnel experiments for 5 min with different wind velocities. The contributions of rainfall events to subsequent wind erosion were determined by comparing the wind erosion rate (WR) and sediment transportation rate (STR) values of the contrast group with those of the test group. Before the simulation experiments, rainfall intensity and wind velocity were calibrated to ensure spatial uniformity greater than 90%, and the errors between simulated rainfall intensity and wind velocity and the target value were less than 5%. The rainfall experiments were repeated five times. In two of these repetitions, the samples were collected before and after rainfall events for measurement. The other three experimental boxes were processed for the following wind tunnel experiments.

2.4.3 Particle size distribution (PSD) measurements

The experimental rainfall intensity (9 mm h-1) was very low without runoff or sediment yield during the experiments. In two of the five repeated experiments, samples in the surface (depth of 0-2 mm) were collected by a knife for the measurement of the PSDs before and after rainfall events. Three samples were collected in each experimental time, and the PSD was determined by the laser diffraction method (Mastersizer 2000, Malvern, UK). According to the United States Department of Agriculture (USDA), the PSDs were classified into three fractions: clay fraction (< 2 µm), silt fraction (2-50 µm) and sand fractions (> 50 µm) (Corral-Pazos-de-Provens et al., 2022). These three fractions were compared before and after the rainfall event. The median particle diameter (d50) was also compared before and after the rainfall event, the higher d50 indicating the coarser sediment fractions (Luo et al., 2020).

2.4.4 Surface crust characterization

Additionally, small boxes made of iron (2×2×3 cm; length × width × height) were placed on the experimental soil surface before and after the rainfall event in two of the five repeated experiments for sample collection to test the surface structure. When the samples were air dried, the surface structure samples were cut and prepared for observation by a SMZ-T6 stereomicroscope (Chongqing Aote Optical Instrument Company, China), the eyepiece magnification of which was 20 times and the objective magnification of which was 0.7-4.5 times. The observation was carried out as follows: (1) A stereomicroscope was placed on a stationary table, an emission light was opened, and the light was focused to create an aperture with the size of a coin on the base of the microscope. (2) The sample box was placed on the base, the lifting group and the magnification knob were adjusted, and the magnification multiple with the clearest image was selected (2.5 times). (3) Sensors were used to take photos and obtain images under different rainfall experiment conditions.

2.4.5 Soil surface roughness (SSR) characterization

For the other three repeated rainfall experiments, a three-dimensional (3D) laser scanner (Pentax laser scanner) was used to scan the soil surface before and after the rainfall experiment. The accuracy of the 3D laser scanner was 1 mm at a 50-m range on both the horizontal and vertical levels. The point-cloud data from the scanner were transferred into digital elevation models (DEMs) using Z+F Lasercontrol (Version 8.5), PolyWorks (Version 10.1) and AcrGIS software (Version 10.2). By data processing, the soil surface roughness (SSR) before and after the rainfall experiments could be calculated by Eq. (1) (Quan et al., 2020):
$\operatorname{SSR}\left(x_{i}\right)=\sqrt{\frac{1}{n_{j}-1} \sum_{j=1}^{n_{j}}\left(z_{i j}-\bar{z}_{i}\right)^{2}}$
where SSR(xi)/mm is the soil surface roughness along Row i at distance x from the top of the squared box, nj is the number of columns, zi,j is the elevation of Row i in Column j, and zi is the mean elevation of Row i. Thus, the change in SSR before and after the rainfall event was determined for the whole experimental surface, where i=8 and j=250.

2.5 Contribution of rainfall events to WR and STR

The experimental boxes in both the contrast and test groups were weighed before and after the wind tunnel experiments to determine WR (Mina et al., 2022). The samples at different heights of the sand collectors in the wind tunnel equipment were weighed to determine the STR by wind erosion at different heights (Huang et al., 2021).
The contribution of rainfall events to WR (Crwr) could be calculated by Eq. (2):
$C r w r=\frac{W R_{i}-W R_{0 i}}{W R_{0 i}} \times 100 \%$
where WRi (g m-2 min-1) is the WR in the test group when the wind velocity is i (i=6, 8, 10, 12, 14, 16, 18 m s-1) and WR0i (g m-2 min-1) is the WR value in the contrast group at the same wind velocity without a rainfall event.
Similarly, the contribution of rainfall events to STR (Crstr) could be calculated by Eq. (3):
$\text { Crstr }=\frac{S T R_{i}-S T R_{0 i}}{S T R_{0 i}} \times 100 \%$
where STRi (g m-2 s-1) is the STR after rainfall event in the test group when the wind velocity is i (i=6, 8, 10, 12, 14, 16, 18 m s-1) and STR0i (g m-2 s-1) is the STR value in the contrast group at the same wind velocity without a rainfall event.
The coefficients of variation (Cv) of WR and STR were calculated by Eq. (4):
$C v=\frac{S D}{\text { Mean }} \times 100 \%$
where SD is the standard deviation of WR and STR and Mean is the average value of WR and STR.

2.6 Data analyses

The differences in variables before and after rainfall events were determined by the paired-samples T test method (SPSS 25.0). Analysis of variance (ANOVA) was performed for multiple comparison variables, such as PSD, SSR, WR and STR, with different gravel coverages using the least significant difference (LSD) procedure at a 95% confidence level (SPSS 25.0). Regression analysis (SPSS 25.0) was conducted for the determination of the relationships of different variables, such as the relationship between WR and wind velocity and the relationship between STR and the transportation height.

3 Results

3.1 Changes in wind erosion rate (WR)

WR increases dramatically with increasing wind velocity (6-18 m s-1) as a power function under different gravel coverages, regardless of the occurrence of a rainfall event (no rainfall event Figure 4a; rainfall event Figure 4b; Table 1). WR ranges from 0.8 to 1931.2 g m-2 min-1 in the contrast group (without rainfall events) under different gravel coverage conditions when the wind velocity changes from 6 to 18 m s-1 (Figure 4a and Table 1). WR ranges from 0.4 to 64.2 g m-2 min-1 in the test group (Figure 4b and Table 1). The rainfall event (9 mm h-1) can reduce WR dramatically under different wind velocities, as the mean WR in the test group (13.4±15.4 g m-2 min-1) is significantly lower than that (339.3±454.9 g m-2 min-1) in the contrast group. The mean WR in the contrast group is approximately 25.3 times that in the test group. In the contrast group, the coefficient of variation (Cv) of WR ranges from 111.9% to 115.7%. The Cv of WR ranges from 85.6% to 93.4% in the test group. The rainfall event not only reduces the absolute value of WR but also reduces the Cv of WR.
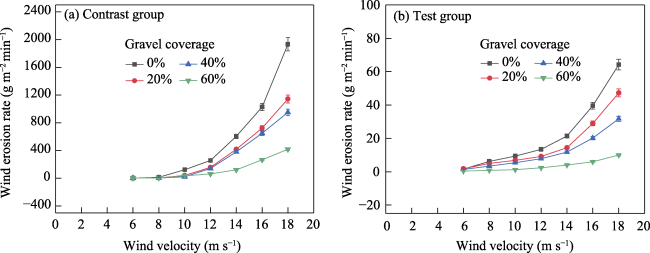
Figure 4 Wind erosion rate (WR) values under different experimental conditions: (a) contrast group and (b) test group
Table 1 Variations in wind erosion rate (WR) and its relationship with wind velocity
Classification of group Gravel coverage (%) WR (g m-2 min-1) Cv
(%)
Dr
(%)
Regression (R2/F)
Min Max Mean
Contrast group 0 1.1 1931.2 565.3±654.1Aa 115.7 y=1.19x3.85 (0.998/22.99)
20 2.8 1142.8 355.4±404.6Aab 113.8 37.1 y=4E-05x6.05 (0.969/29.31)
40 1.2 950.0 306.9±344.6Aab 112.3 45.7 y=5E-06x6.70 (0.929/33.42)
60 0.8 418.0 129.7±145.2Ab 111.9 77.1 y=4E-05x5.68 (0.986/25.85)
Total group 0.8 1931.2 339.3±454.9A / / y=2E-05x6.25 (0.760/27.55)
Test group 0 1.6 64.2 22.3±20.7Ba 92.8 / y=0.007x3.10 (0.979/28.17)
20 1.8 47.3 16.2±15.1Bab 93.4 27.2 y=0.01x2.75 (0.953/23.02)
40 1.4 31.7 11.7±10.0Bab 85.6 47.5 y=0.01x2.70 (0.977/33.82)
60 0.4 10.0 3.6±3.2Bb 90.1 84.0 y=0.002x2.91 (0.985/34.85)
Total group 0.4 64.2 13.4±15.4B / / y=0.008x2.88 (0.972/27.89)

Note: Min, Max and Mean are the minimum value, maximum value and mean value of WR, respectively, when the wind velocity varies from 6 m s-1 to 18 m s-1; y is the WR and x is the wind velocity; Cv is the coefficient of variation; Dr is the decrease rate; F>1.00 is the level of extreme significance for the regression equation; different capital letters represent the significant (p<0.05) differences of the variables between the contrast group and test group; and the different lowercase letters represent the significant (p<0.05) differences of the variables under different gravel coverages.

Compared with the bare soil surface (0% gravel coverage), WR shows a significant reduction under the gravel coverage, with the rates decreasing by 37.1%, 45.7% and 77.1% in the contrast group and by 27.2%, 47.5% and 84.0% in the test group when gravel coverage changes from 20% to 40% and to 60%, respectively (Figure 4 and Table 1). The mean WR shows a decreasing trend with increasing gravel coverage in both the contrast group and test group, indicating that gravel coverage can reduce WR. However, there are no significant differences in WR when gravel coverage varies from 20% to 60% in either the contrast group or test group due to the simultaneous effects of wind velocity on WR.

3.2 Changes in sediment transportation rate (STR)

As shown in Figure 5 and Table 2, the measured STR ranges from 0.00 to 51.47 g m-2 s-1 in the contrast groups (without rainfall events), while it ranges from 0.00 to 2.14 g m-2 s-1 in the test groups (with rainfall events). The STR in the contrast group is significantly (p<0.05) higher than that in the test group under different experimental conditions, indicating that the rainfall event can reduce STR sharply. The average STR in the contrast group (2.05±6.33 g m-2 s-1) is 25.6 times that in the test group (0.08±0.23 g m-2 s-1).
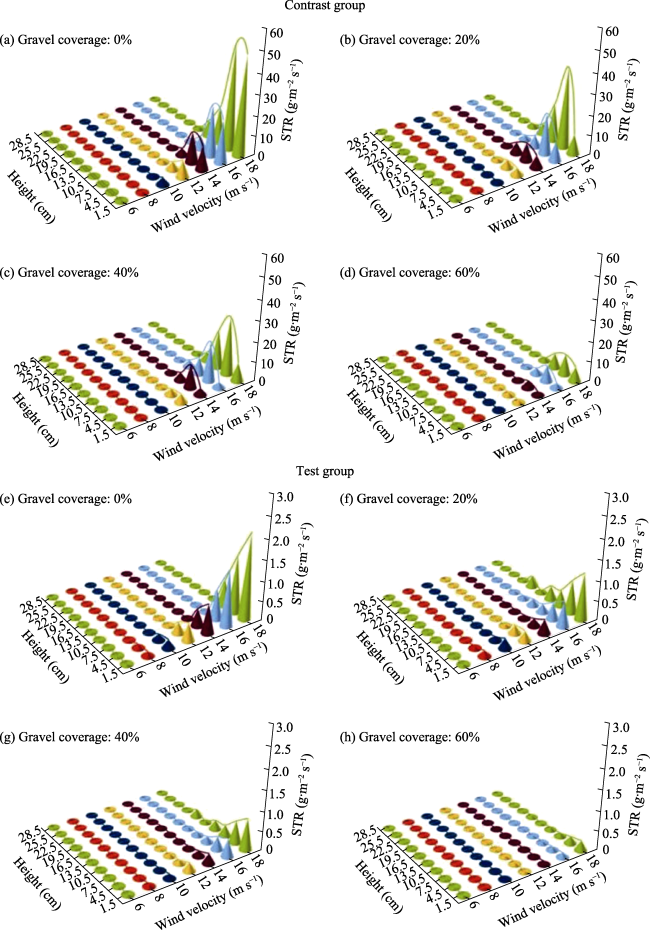
Figure 5 Sediment transportation rate (STR) under different experimental conditions: (a) contrast group under 0% gravel coverage; (b) contrast group under 20% gravel coverage; (c) contrast group under 40% gravel coverage; (d) contrast group under 60% gravel coverage; (e) test group under 0% gravel coverage; (f) test group under 20% gravel coverage; (g) test group under 40% gravel coverage; and (h) test group under 60% gravel coverage
Table 2 Variations in the sediment transportation rate (STR) and maximum height under different experimental conditions
Classification of the group Gravel coverage (%) STR (g m-2 s-1) Cv
(%)
Dr
(%)
Maximum height (cm) Regression equation of STR and wind velocity (R2/F)
Min Max Mean
Contrast group 0 0.00 51.47 3.42±9.63Aa 279.6 / 13.1±5.4Aa y=2E-08x7.08 (0.991/16.24)
20 0.00 39.79 2.14±6.03Aab 279.5 37.4 11.8±6.2Aa y=8E-09x7.29 (0.975/26.37)
40 0.00 28.94 1.85±5.07Aab 272.3 45.9 14.4±6.2Aa y=2E-09x7.79 (0.948/33.17)
60 0.00 10.46 0.78±2.03Ab 258.5 77.2 15.2±6.6Aa y=2E-07x5.81 (0.998/21.19)
Total group 0.00 51.47 2.05±6.33A / / 13.6±6.2A /
Test Group 0 0.00 2.14 0.12±0.38Ba 290.2 / 7.1±2.7Ba y=1E-05x3.63 (0.972/19.87)
20 0.00 1.19 0.10±0.21Bab 215.7 16.7 11.4±5.7Aa y=3E-05x3.14 (0.937/16.62)
40 0.00 0.80 0.07±0.14Bab 208.5 41.7 14.3±7.1Aa y=1E-05x3.29 (0.968/25.47)
60 0.00 0.25 0.02±0.04Bb 215.8 83.3 12.6±6.6Aa y=4E-07x4.17 (0.981/21.33)
Total group 0.00 2.14 0.08±0.23B / 11.4±6.5B /

Note: Min, Max and Mean are the minimum value, maximum value and mean value of STR, respectively, when the wind velocity varies from 6 m s-1 to 18 m s-1; Cv is the coefficient of variation and Dr is the decrease rate; y is the STR; x is the wind velocity; F>1.00 is the level of extreme significance of the regression equation; the different lowercase letters represent the significant differences (p<0.05) among the variables under different gravel coverages; and the different capital letters represent the significant differences (p<0.05) of the variables between the contrast group and test group.

Compared with the bare soil (0% gravel coverage), gravel coverage can significantly decrease STR, and the decrease rates of the mean STR are 37.4%, 45.9%, and 77.2% in the contrast group and 16.7%, 41.7%, and 83.3% in the test group at gravel coverages of 20%, 40% and 60%, respectively. Similar to the WR changing with gravel coverage, the mean STR shows a decreasing trend with increasing gravel coverage in both the contrast group and test group, but does not show significant differences (p<0.05) when the gravel coverage varies from 20% to 60%.
The relationships between STR and wind velocity follow a power function under different gravel coverages regardless of the occurrence of a rainfall event (contrast group (rainfall event) and test group (no rainfall event)) (Table 2).

3.3 Relationship between STR and transportation height

Under each wind velocity, STR varies with transportation height as a logarithmic function under different gravel coverages, regardless of the occurrence of a rainfall event (Table 3). The maximum height is defined as the height at which STR changes from unstable to stable after the logarithmic decline with increasing transportation height at a value lower than 0.1 g m-2 s-1. Thus, the maximum height can also be recognized as the height of the sediment transportation layer. The maximum height ranges from 1.5 to 25.5 cm under different experimental conditions, which indicates that near-surface sediment transportation dominates sand transportation processes. As shown in Table 2, the mean maximum height in the test group (11.4±6.5 cm) is significantly (p<0.05) lower than that (13.6±6.2 cm) in the contrast group, which indicates that the rainfall event also decreases the height of the transportation layer. The critical height is defined as the height at which STR reaches the maximum value. The critical height changes with wind velocity and gravel coverage. In the contrast group, the critical height increases from 1.5 cm to 4.5 cm with increasing wind velocity when the gravel coverage ≤40%, while it can reach 6.5 cm when the wind velocity is higher than 14 m s-1 under 60% gravel coverage. In the test group, the critical height remains at 1.5 cm, as seen through different experiments (Table 3).
Table 3 Relationship between sediment transportation rate (STR) and transportation height under different experimental conditions

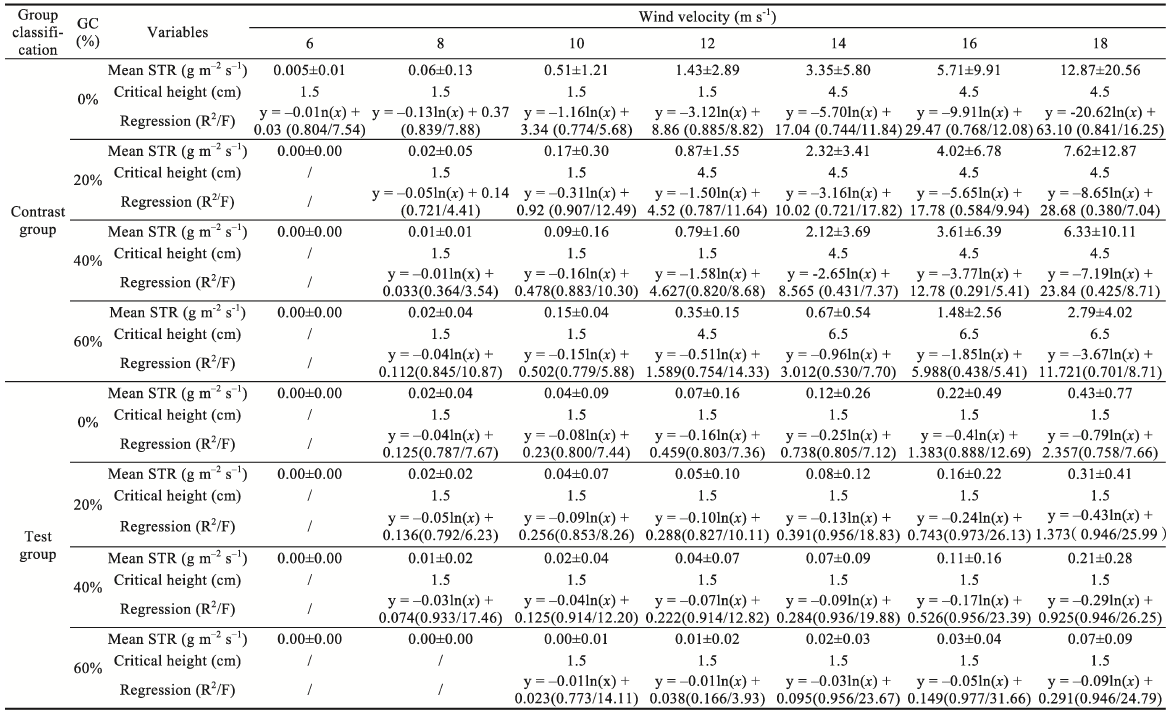
Note: GC is gravel coverage; y is the STR; x is the transportation height; and F>1.00 is the level of extreme significance of the regression equation

3.4 Contribution of rainfall events to WR and STR

The experimental results show that rainfall events play important roles in reductions in WR and STR during subsequent wind erosion on the simulated Gobi surface, as WR and STR decrease dramatically in the test groups. As shown in Table 4, the reduction effects of rainfall events on WR and STR increase with increasing wind velocity, and they can exceed 90% when the wind velocity is ≥12 m s-1. The inhibitory effects of the rainfall event on the WR and STR of the subsequent wind erosion process first decrease and then increase with increasing gravel coverage.
Table 4 Contribution of rainfall events to the wind erosion rate (WR) and sediment transportation rate (STR).
Variable Wind velocity (m s-1) Gravel coverage
0% 20% 40% 60%
WR 6 42.86 -35.71 16.67 -50.00
8 -55.97 4.17 6.25 -83.33
10 -92.32 -83.00 -74.04 -96.32
12 -94.78 -94.12 -94.51 -96.15
14 -96.45 -96.55 -96.90 -96.70
16 -96.15 -95.99 -96.89 -97.74
18 -96.68 -95.86 -96.66 -97.61
STR 6 -100.00 / / /
8 -63.96 4.17 6.25 -100.00
10 -92.32 -74.93 -74.04 -96.55
12 -94.78 -94.12 -94.51 -96.15
14 -96.45 -96.55 -96.90 -96.70
16 -96.15 -95.99 -96.89 -97.74
18 -96.68 -95.87 -96.65 -97.61

4 Discussion

4.1 Effects of wind velocity

Wind velocity is the driving force of sand saltation during wind erosion. In our experiments, both WR and STR increase with increasing wind velocity as a power function (Figure 4 and Table 1) regardless of the occurrence of a rainfall event, which is consistent with previous studies (Liu et al., 2006; Zhang et al., 2011; Kheirabadi et al., 2018; Huang et al., 2021). For example, Liu et al. (2006) indicated the power function between the wind velocity and the wind erosion rate in their wind tunnel experiments in middle Inner Mongolia in northwestern China. Hu et al. (2009) observed the increasing trend of STR with increasing wind speed with the power function in the field of middle Inner Mongolia in northwestern China. The rainfall event reduces the WR and STR dramatically in the subsequent wind erosion processes (Table 4) but does not change their relationships with wind velocity.
Under each wind velocity condition, STR is found to decrease with increasing transportation height as a logarithmic function regardless of the occurrence a rainfall event (Figure 5 and Table 3), which is also consistent with previous observations in desert areas in northern China (Mao et al., 2015). However, the critical height increases with increasing wind velocity in the contrast group, but it remains stable at a relatively low value in the test group after the rainfall event (Table 3). This phenomenon results from the dominant sediment transportation processes in the near-surface airflow, including particles arising from both saltation and creep (Li et al., 2021). The particle size decreases with increasing transportation height, and relatively large particles settle under the action of gravity (Mao et al., 2015). In the present study, the content of sand particles (>50 µm) is dominant (85.7%), and more energy is needed to transport these larger particles into higher layers. Thus, the critical transportation height increases with increasing wind velocity without rainfall events. Rainfall events do not change the logarithmic decreasing trend of STR with transportation height, but they change the variations in transportation critical height with wind velocity.

4.2 Effects of gravel coverage

Gravel coverage is recognized as an important factor that impacts wind erosion processes and dust emissions in the Gobi Desert of northwestern China (Tan et al., 2013; Zhang et al., 2015; Zhang et al., 2016; Buyantogtokh et al., 2021). In the present study, WR and STR decrease with increasing gravel coverage in both the contrast group and test group (Tables 1 and 2). Tan et al. (2019) and Buyantogtokh et al. (2021) found that the threshold friction velocity for sand saltation increases with increasing surface roughness density under higher gravel coverage; thus, increasing gravel coverage can decrease WR and STR. WR is reportedly controllable by the gravel density and the gravel distribution through changing the structure and erosion-deposition pattern around the gravel (Neuman et al., 2013). These results show why WR and STR decrease with increasing gravel coverage.
The maximum height of the sediment transportation layer does not show significant differences on bare soils (0% gravel coverage) or on soils with different gravel coverages in either the contrast group or test group. The average value of the maximum height, i.e., the height of the sediment transportation layer, in the test group is significantly lower (p<0.05) than that in the control group (Table 2). These results imply that the rainfall event only decreases the maximum height of the sediment transportation layer but does not change the gravel coverage effects on the sediment transportation layer during sediment transportation processes.
The critical height of the sediment transportation layer shows an increasing trend when the gravel coverage reaches 60% and the wind velocity is ≥12 m s-1 in the contrast group (Table 3), which is consistent with the observations of Tan et al. (2013). According to their results, the collision between soil particles and gravels can increase the wind velocity around gravel and remove large particles to increase the critical height of sediment transportation when gravel coverage reaches a specific degree. However, the critical height remains stable at a relatively low value in the test group (Table 3), which indicates that the rainfall event changes the gravel effects on the critical height of the sediment transportation layer.

4.3 Possible manners of rainfall event effects on wind erosion

The influences of rainfall events on subsequent wind erosion processes involve different aspects, including changes in particle size distribution (PSD) and soil surface characteristics, such as the formation of surface crust and changes in soil surface roughness (SSR). Although many previous studies have reported the size selectivity characteristics of water erosion (Hassan et al., 2006; Wang et al., 2012; Jolivet et al., 2021), there are no significant differences in PSD and d50 before and after rainfall events in the present study (Figure 6 and Table 5). The reason for this phenomenon may be due to the extremely low rainfall intensity at 9 mm h-1 and the small size of the experimental boxes in the present study, which limit the confluence of the flow.
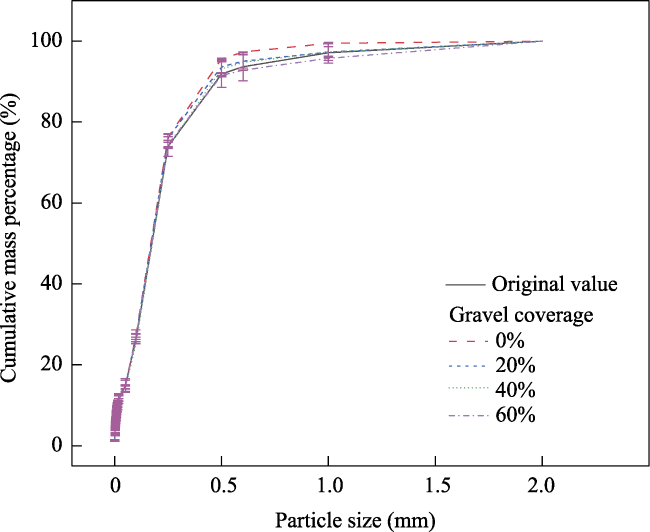
Figure 6 Cumulative mass percents of particles on-slope before (original value) and after rainfall event
Table 5 Particle size distribution (PSD) on-slope before (original value) and after rainfall events under different gravel coverages
Gravel coverage (%) Particle size distribution (PSD) Fine particles d50 (mm)
Clay
(<0.002 mm/%)
Silt
(0.002-0.05 mm/%)
Sand
(0.05-2 mm/%)
Before rainfall event Original 2.97±0.22a 11.86±0.71a 85.17±0.93a 14.83±1.84a 0.160±0.000a
After rainfall event 0 2.88±0.74a 12.02±2.73a 85.10±3.47a 14.90±3.47a 0.157±0.000a
20 3.19±0.04a 11.73±0.28a 85.08±0.28a 14.92±0.32a 0.156±0.000a
40 3.13±0.32a 11.30±0.34a 85.57±0.67a 14.43±0.67a 0.164±0.000a
60 2.84±0.18a 11.61±0.77a 85.54±0.95a 14.46±0.95a 0.158±0.000a

Note: The different lowercase letters represent significant (p<0.05) differences in the variables before (original value) and after rainfall events under different experimental conditions.

In the present study, soil surface crust appears during rainfall events, and this crust is imaged through stereomicroscopy (Figure 7). Compared with the images of the soil surface before rainfall events (Figures 7a, 7c, 7e, and 7g), higher particle density is apparent in the images of soil crust after rainfall events (Figures 7b, 7d, 7f, and 7h). The higher density of the crust layer after rainfall events contributes to the inhibitory effects of rainfall events on the WR and STR of subsequent wind erosion by increasing the cohesion of soil particles, improving the stability of the soil surface and reducing soil particle entrainment by wind (Duniway et al., 2019; Preston et al., 2020; Fattahi et al., 2021). As the higher density of the crust layer does not significantly change the PSD but increases the cohesion and stability of soil particles after rainfall events, much more energy is needed to transport fine particles by wind in the upper transportation layer. Thus, the maximum height of sediment transportation after rainfall events in the test group is lower than that in the contrast group without rainfall events. The critical height of sediment transportation remains stable in the test group when the wind velocity varies from 4 m s-1 to 16 m s-1 (Table 3), which is different from the increasing trends of the critical transportation height with increasing wind velocity and gravel coverage in the contrast group. However, the mechanisms of wind erosion processes remain the same when wind energy is high enough to start the saltation and creep of soil particles, resulting in unchanged variations in WR and STR with wind velocity after rainfall.
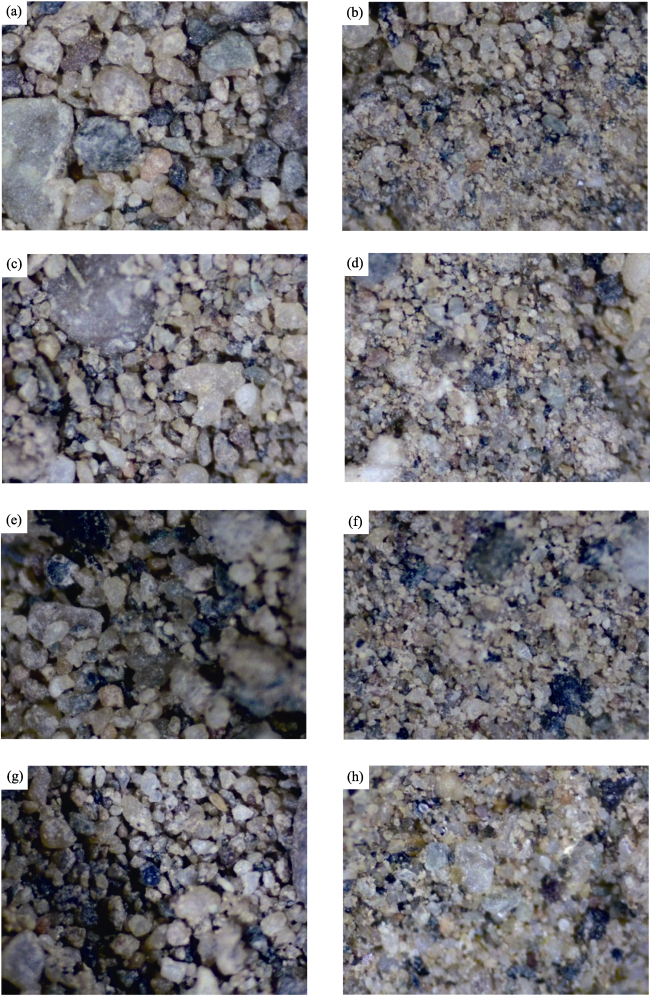
Figure 7 Images of the soil surface by stereomicroscopy: (a) 0% gravel coverage before a rainfall event; (b) 0% gravel coverage after a rainfall event; (c) 20% gravel coverage before a rainfall event; (d) 20% gravel coverage after a rainfall event; (e) 40% grave coverage before a rainfall event; (f) 40% gravel coverage after a rainfall event; (g) 60% gravel coverage before a rainfall event; and (h) 60% gravel coverage after a rainfall event
Moreover, rainfall events change SSR under different gravel coverages (Figure 8). The effects of SSR on the suppression of wind erosion have been investigated previously by decreasing the wind stress on the erodible surface, absorbing the downward momentum flux fraction of airflow and increasing the threshold friction velocity (Raupach et al., 1993; de Oro et al., 2016; Buyantogtokh et al., 2021). Thus, changing the SSR is another possible mechanism by which the rainfall event can affect subsequent wind erosion processes. Compared with the soil surface before the rainfall event, the average SSR after the rainfall event decreases by 47.6% on bare soils (0% gravel coverage) and by 12.0% on soils with 20% gravel coverage, and it increases by 3.5% on soils with 40% gravel coverage and by 11.1% on soils with 60% gravel coverage. The different changing rules of SSR with increasing gravel coverage can explain why the rainfall event changes the gravel coverage effects on the critical height during sediment transportation. The reductions in WR and STR are the results of the complex effects of changes in soil crust and SSR due to rainfall events. The decrease in SSR on soils with 0% and 20% gravel coverage offset part of the inhibitory effects of soil crust on WR and STR resulting from rainfall events. The relatively high increase rate of SSR under 60% gravel coverage aggravates the reduction in wind erosion by soil crust, which results in the higher decrease rates of the WR and STR with increasing gravel coverage in the test group than those in the contrast group, and it results in the higher contribution of rainfall events to WR and STR under 60% gravel coverage (Tables 1 and 2).
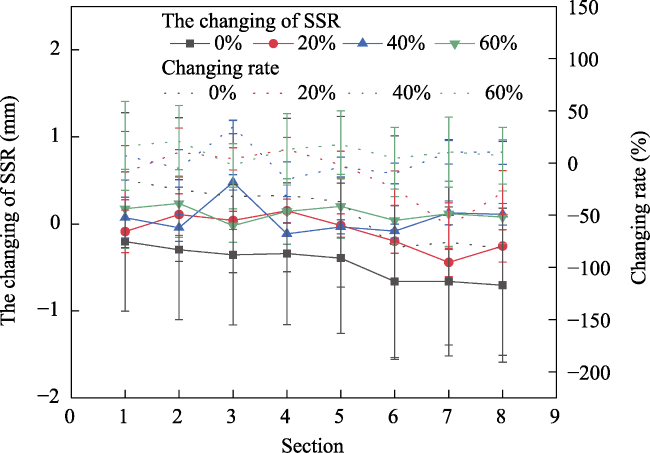
Figure 8 Changes in soil surface roughness (SSR) due to the rainfall event

5 Conclusions

The effects of rainfall events on subsequent wind erosion processes were investigated on a simulated Gobi surface using indoor simulation experiments with a rainfall intensity of 9 mm h-1 to simulate the highest previously recorded rainfall event of the sampling sites. Both the wind erosion rate (WR) and sediment transportation rate (STR) increased with increasing wind velocity by a power function, and the STR decreased with increasing transportation height as a logarithmic function for each wind velocity. However, both WR and STR decreased with increasing gravel coverage, with no significant (p<0.05) differences in the transportation maximum height when the gravel coverage varied from 0% to 60%. Rainfall events significantly reduced the WR and STR in subsequent wind erosion processes. The inhibitory contributions of rainfall events increased with increasing wind velocity and could reach 90% when the wind velocity was ≥12 m s-1. Generally, rainfall events not only decreased the maximum height and critical height of sediment transportation but also changed the increasing trends of the critical height with increasing wind velocity and gravel coverage. However, rainfall events did not change the relationships between WR/STR and wind velocity or the relationships between WR/STR and gravel coverage. Due to the complex effects of soil crust and changing soil surface roughness (SRR), rainfall events could have inhibitory impacts on subsequent wind erosion processes, as there were no significant differences in the particle size distribution before and after rainfall events. The changes in SSR after rainfall events showed different trends with varying gravel coverage. The rapid increase rate of SSR under 60% gravel coverage aggravated the reduction in wind erosion by soil crust, thereby increasing the contribution rates of rainfall events to reductions in WR and STR during subsequent wind erosion. All these results lay the basis for effective understanding and improving the accuracy of future assessments of potential dust emissions when there is a relatively high probability of rainfall events in the Gobi region of northwestern China. However, the present study was carried out using indoor experiments on a simulated Gobi surface with artificial rainfall events, artificial wind events and small-scale experimental boxes, and the experimental conditions were substantially different from those in the field. Thus, the mechanisms of the effects of rainfall events on sediment transportation and dust emission in subsequent wind erosion processes should be further investigated in detail, especially through experiments and observations in the Gobi Desert with high rainfall intensities.
[1]
Basaran M, Erpul G, Uzun O et al., 2011. Comparative efficiency testing for a newly designed cyclone type sediment trap for wind erosion measurements. Geomorphology, 130: 343-351.

DOI

[2]
Buyantogtokh B, Kurosaki Y, Tsunekawa A et al., 2021. Effect of stones on the sand saltation threshold during natural sand and dust storms in a stony desert in Tsogt-Ovoo in the Gobi Desert, Mongolia. Journal of Arid Land, 13: 653-673.

DOI

[3]
Cao F Q, Gao T, Dan L et al., 2021. Contributions of natural climate variability on the trends of seasonal precipitation extremes over China. International Journal of Climatology, 41: 5226-5242.

DOI

[4]
Chen W N, Dong Z B, Li Z S et al., 1996. Wind tunnel test of the influence of moisture on the erodibility of loessial sandy loam soils by wind. Journal of Arid Environments, 34: 391-402.

DOI

[5]
Chepil W S, 1945. Dynamics of wind erosion (I): Nature of movement of soil by wind. Soil Science, 60: 305-320.

DOI

[6]
Corral-Pazos-de-Provens E, Rapp-Arrarás Í, Domingo-Santos J M, 2022. Estimating textural fractions of the USDA using those of the International System: A quantile approach. Geoderma, 416: 115783.

DOI

[7]
de Oro L A, Colazo J C, Buschiazzo D E, 2016. RWEQ: Wind erosion predictions for variable soil roughness conditions. Aeolian Research, 20: 139-146.

DOI

[8]
Duniway M C, Pfennigwerth A A, Fick S E et al., 2019. Wind erosion and dust from US drylands: A review of causes, consequences, and solutions in a changing world. Ecosphere, 10: e02650.

[9]
Dupont S, Rajot J L, Lamaud E et al., 2021. Comparison between eddy-covariance and flux-gradient size-resolved dust fluxes during wind erosion events. Journal of Geophysical Research: Atmoshpheres, 126: e2021JD034735.

[10]
Fattahi S M, Soroush A, Huang N et al., 2021. A framework for predicting abrasion rupture of crusts in wind erosion. Earth Surface Processes and Landforms, 46: 2565-2581.

DOI

[11]
Filonchyk M, 2022. Characteristics of the severe March 2021 Gobi Desert dust storm and its impact on air pollution in China. Chemosphere, 287: 132219.

DOI

[12]
Gillette D A, Walker T R, 1977. Characteristics of airborne particles produced by wind erosion of sandy soil, High Plain of West Texas. Soil Science, 123: 97-110.

DOI

[13]
Hassan M A, Egozi R, Parker G, 2006. Experiments on the effect of hydrograph characteristics on vertical grain sorting in gravel bed rivers. Water Resources Research, 42: W09408.

[14]
Hu X, Liu L Y, Li S J et al., 2009. Estimation of sand transportation rate for fixed and semi-fixed dunes using meteorological wind data. Pedosphere, 19: 129-136.

DOI

[15]
Huang B, Li Z N, Zhang Z T et al., 2021. Wind tunnel test on windblown sand two-phase flow characteristics in arid desert regions. Applied Sciences, 11: 11349.

DOI

[16]
Jester W, Klik A, 2005. Soil surface roughness measurement: Methods, applicability, and surface representation. Catena, 64: 174-192.

DOI

[17]
Jolivet M, Braucher R, Dovchintserena D et al., 2021. Erosion around a large-scale topographic high in a semi-arid sedimentary basin: Interactions between fluvial erosion, aeolian erosion and aeolian transport. Geomorphology, 386: 107747.

DOI

[18]
Kai K J, Kawai K, Ito A et al., 2021. Dust hotspot in the Gobi Desert: A field survey in April 2019. SOLA, 17: 130-133.

DOI

[19]
Kheirabadi H, Mahmoodabadi M, Jalali V et al., 2018. Sediment flux, wind erosion and net erosion influenced by soil bed length wind velocity and aggregate size distribution. Geoderma, 323: 22-30.

DOI

[20]
Koiter A J, Owens P N, Petticrew E L et al., 2017. The role of soil surface properties on the particle size and carbon selectivity of interrill erosion in agricultural landscapes. Catena, 153: 194-206.

DOI

[21]
Li B F, Chen Y N, Chen Z S et al., 2016. Why does precipitation in northwest China show a significant increasing trend from 1960 to 2010? Atmopheric Research, 167: 275-284.

[22]
Li B F, Chen Y N, Shi X et al., 2013. Temperature and precipitation changes in different environments in the arid region of northwest China. Theoretical and Applied Climatology, 112: 589-596.

DOI

[23]
Li G, Zhang J, Herrmann H J et al., 2020. Study of aerodynamic grain entrainment in aeolian transport. Geophysical Research Letters, 47(11): e2019GL086574.

[24]
Li H, Zou X, Zhang C et al., 2021. Effects of gravel cover on the near-surface airflow field and soil wind erosion. Soil & Tillage Research, 214: 105133.

[25]
Liu M X, Wang J A, Yan P et al., 2006. Wind tunnel simulation of ridge-tillage effects on soil erosion from cropland. Soil & Tillage Research, 90: 242-249.

[26]
Lu H, Shao Y P, 2001. Toward quantitative prediction of dust storms: An integrated wind erosion modelling system and its applications. Environmental Modelling & Software, 16: 233-249.

[27]
Lu P, Xie X L, Wang L H et al., 2017. Effects of different spatial distributions of physical soil crusts on runoff and erosion on the Loess Plateau in China. Earth Surface Processes and Landforms, 42: 2082-2089.

DOI

[28]
Luo M J, Pan C Z, Cui Y S et al., 2020. Sediment particle selectivity and its response to overland flow hydraulics within grass strips. Hydrological Processes, 34: 5528-5542.

DOI

[29]
Mandakh N, Tsogtbaatar J, Dash D et al., 2016. Spatial assessment of soil wind erosion using WEQ approach in Mongolia. Journal of Geographical Sciences, 26(4): 473-483.

DOI

[30]
Mao D L, Lei J Q, Wang C et al., 2015. Characteristics of sand flow structure and sand transportation particles in Cele desert-oasis ecotone of Xinjiang Wei autonomous region. Bulletin of Soil and Water Conservation, 35: 25-33. (in Chinese)

[31]
Martz L W, Li L, 1997. Grain-size analysis of surface material under wind erosion using the effective surface concept. Earth Surface Processes and Landforms, 22: 19-29.

DOI

[32]
Mina M, Rezaei M, Sameni A et al., 2022. Predicting wind erosion rate using portable wind tunnel combined with machine learning algorithms in calcareous soils, southern Iran. Journal of Environmental Management, 304: 114171.

DOI

[33]
Münch S, Papke N, Leue M, et al., 2022. Differences in the sediment composition of wind eroded sandy soils before and after fertilization with poultry manure. Soil & Tillage Research, 215: 105205.

[34]
Negyesi G, Szabo S, Buro B et al., 2021. Influence of soil moisture and crust formation on soil evaporation rate: A wind tunnel experiment in Hungary. Agronomy, 11: 935.

DOI

[35]
Neuman C M, Sanderson R S, Sutton S, 2013. Vortex shedding and morphodynamic response of bed surfaces containing non-erodible roughness elements. Geomorphology, 198: 45-56.

DOI

[36]
Pang Y J, Li Y H, Wu B et al., 2021. Emission, deposition and geochemical characteristics of aeolian dust in the eastern Kumtag Desert, China. Theoretical and Applied Climatology, 143: 1129-1143.

DOI

[37]
Preston C A, McKenna N C, Boulton J W, 2020. A wind tunnel and field evaluation of various dust suppressants. Journal of the Air & Waste Management Association, 70(9): 915-931.

[38]
Qi X Q, Cheng X K, Liu J et al., 2023. Effective soil particle size distributions and critical size of enrichment/depletion in splash erosion for loessial soil. Journal of Geographical Sciences, 33(10): 2113-2130.

DOI

[39]
Quan X, He J J, Cai Q G et al., 2020. Soil erosion and deposition characteristics of slope surfaces for two loess soils using indoor simulated rainfall experiment. Soil & Tillage Research, 204: 104714.

[40]
Quijano L, Kuhn N J, Navas A, 2020. Effects of interrill erosion on the distribution of soil organic and inorganic carbon in different sized particles of Mediterranean calcisols. Soil & Tillage Research, 196: 104461.

[41]
Raupach M R, Gillette D A, Leys J F, 1993. The effect of roughness elements on wind erosion threshold. Journal of Geophysical Research, 98: 3023-3029.

DOI

[42]
Raupach M R, Thom A S, Edwards I, 1980. A wind-tunnel study of turbulent flow close to regularly arrayed rough surfaces. Boundary-Layer Meteorology, 18: 373-397.

DOI

[43]
Shahabinejad N, Mahmoodabadi M, Jalalian A et al., 2019. The fractionation of soil aggregates associated with primary particles influencing wind erosion rates in arid to semiarid environments. Geoderma, 356: 113936.

DOI

[44]
Shao Y P, Wyrwoll K H, Chappell A et al., 2011. Dust cycle: An emerging core theme in Earth system science. Aeolian Research, 2: 181-204.

DOI

[45]
Sun L Y, Fang H Y, Cai Q G et al., 2019. Sediment load change with erosion processes under simulated rainfall events. Journal of Geographical Sciences, 29(6): 1001-1020.

DOI

[46]
Sun L Y, Wang C H, 2023. Effects of the extreme rainfall events on particle size selectivity on the simulated Gobi surface using indoor rainfall experiments. Catena, 220: 106716.

DOI

[47]
Sun L Y, Zhou J L, Cai Q G et al., 2021. Comparing surface erosion processes in four soils from the Loess Plateau under extreme rainfall events. International Soil and Water Conservation Research, 9: 520-531.

DOI

[48]
Tan L H, Zhang W M, Qu J J et al., 2013. Aeolian sand transport over gobi with different gravel coverages under limited sand supply: A mobile wind tunnel investigation. Aeolian Research, 11: 67-74.

DOI

[49]
Tanaka U, Yokoi Y, Kosaki T et al., 1999. Mechanisms and processes of crust formation on artificial aggregates (III): Relations between natural rainfall characteristics and degree of crusting. Soil Science and Plant Nutrition, 45: 537-549.

DOI

[50]
Taramelli A, Pasqui M, Barbour J et al., 2013. Spatial and temporal dust source variability in northern China identified using advanced remote sensing analysis. Earth Surface Processes and Landforms, 38: 793-809.

DOI

[51]
Tuo D F, Xu M X, Gao L Q et al., 2016. Changed surface roughness by wind erosion accelerates water erosion. Journal of Soils and Sediments, 16: 105-114.

DOI

[52]
Van Pelt R S, Zobeck T M, 2004. Validation of the Wind Erosion Equation (WEQ) for discrete periods. Environmental Modelling & Software, 19: 199-203.

[53]
Wang J K, Zhang B H, Zhang H D et al., 2022. Simulation of a severe sand and dust storm event in March 2021 in northern China: dust emission schemes comparison and the role of gusty wind. Atmosphere, 13: 108.

DOI

[54]
Wang X M, Cai D W, Zhu B Q et al., 2020. Dust-sized fractions from dustfall and physical weathering in the Gobi Desert. Aeolian Research, 43: 100565.

DOI

[55]
Wang X M, Lang L, Hua T et al., 2012. Characteristics of the Gobi Desert and their significance for dust emissions in the Ala Shan Plateau (Central Asia): An experimental study. Journal of Arid Environments, 81: 35-46.

DOI

[56]
Webb N P, Okin G S, Brown S, 2014. The effect of roughness elements on wind erosion: The importance of surface shear stress distribution. Journal of Geophysical Research: Atmospheres, 119: 6066-6084.

[57]
Wu C L, Lin Z H, Liu X H et al., 2021. Description of dust emission parameterization in CAS-ESM2 and its simulation of global dust cycle and East Asian dust events. Journal of Advances in Modeling Earth Systems, 13: e2020MS002456.

[58]
Wu W, Yan P, Wang Y et al., 2018. Wind tunnel experiments on dust emissions from different landform types. Journal of Arid Land, 10: 548-560.

DOI

[59]
Yan Y C, Wang X, Guo Z J et al., 2018. Influence of wind erosion on dry aggregate size distribution and nutrients in three steppe soils in northern China. Catena, 170: 159-168.

DOI

[60]
Zamani S, Mahmoodabadi M, 2013. Effect of particle-size distribution on wind erosion rate and soil erodibility. Archives of Agronomy and Soil Science, 59: 1743-1753.

DOI

[61]
Zhang J, Teng Z J, Huang N et al., 2016. Surface renewal as a significant mechanism for dust emission. Atmospheric Chemistry and Physics, 16: 15517-15528.

[62]
Zhang K C, Zhang W M, Tan L H et al., 2015. Effects of gravel mulch on aeolian transport: A field wind tunnel simulation. Journal of Arid Land, 7: 296-303.

DOI

[63]
Zhang Q Y, Zhao X Y, Zhang Y et al., 2002. Preliminary study on sand-dust storm disaster and countermeasures in China. Chinese Geographical Science, 12: 9-13.

DOI

[64]
Zhang X Y, Gong S L, Zhao T L et al., 2003. Sources of Asian dust and role of climate change versus desertification in Asian dust emission. Geophysical Research Letters, 30: 2272.

[65]
Zhang Z C, Dong Z B, Zhao A G, 2011. The characteristics of aeolian sediment flux profiles in the south-eastern Tengger Desert. Sedimentology, 58: 1884-1894.

DOI

[66]
Zhang Z C, Han L Y, Pan K J, 2021. Sediment transport characteristics above a gobi surface in northwestern China, and implications for aeolian environments. Aeolian Research, 53: 100745.

DOI

Outlines

/