
Journal of Geographical Sciences >
Distribution of topographical changes triggered by prolonged heavy rainfall in the Chinese Loess Plateau: A case study of the Gutun catchment in Yan'an
|
Cao Zhi (1989‒), PhD and Associate Professor, specialized in rural geography and land science. E-mail: caoz@igsnrr.ac.cn |
Received date: 2022-10-17
Accepted date: 2023-12-07
Online published: 2024-04-24
Supported by
National Natural Science Foundation of China(42271279)
National Natural Science Foundation of China(41931293)
National Natural Science Foundation of China(41801175)
Taishan Industrial Experts Program
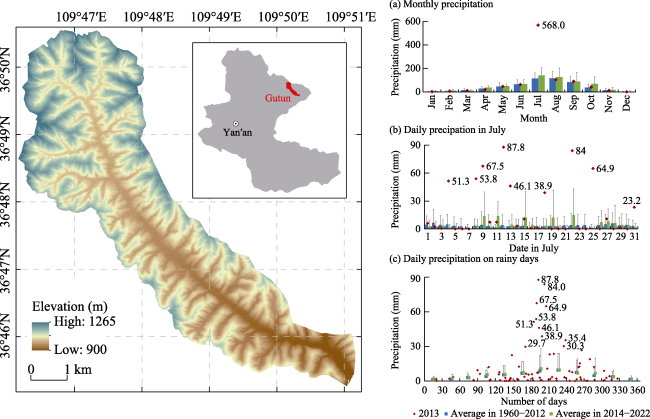
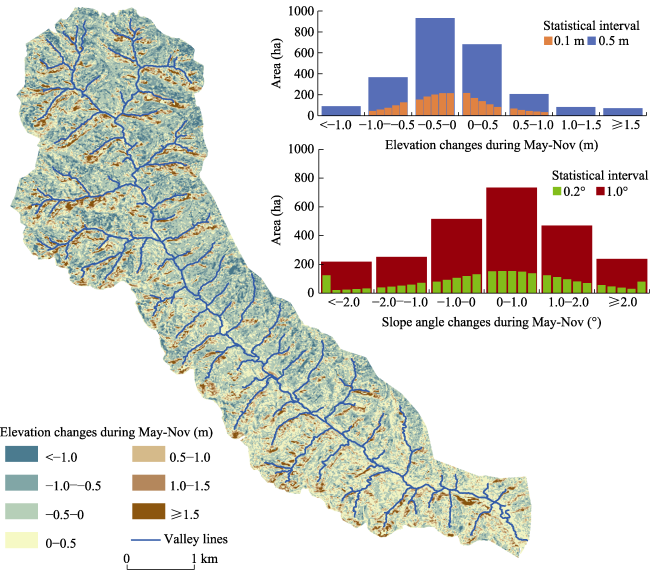
As China's Loess Plateau has lately witnessed increasingly extreme precipitation events, it is important to analyze the impact of extreme precipitation and identify the conditions for the occurrence of geological disasters. Field surveys can provide detailed geological information in this regard but are time consuming and labor intensive. In this paper, we provide a case study on the Gutun catchment of Yan'an, which was affected by prolonged heavy rainfall in July 2013. We used Digital Elevation Model (DEM) data obtained by processing ZY-03 stereo-pair images before and after the rainy season, including the period of prolonged heavy rainfall mentioned above, to analyze the topographical changes triggered by the rainfall. The results showed the following: (1) The rainy season reduced the elevation of the catchment by about 1.7 cm. The major change in its elevation ranged from -0.5 to 0 m, accounting for 38.41% of the overall area of change and dominating above 70 m of slope height. (2) The rainy season increased the average inclination of the slopes in the area from 28.81° to 28.95°, while the range of their peak inclination was mainly distributed in the range of 24°-36°. (3) Sunny and half-sunny slopes exhibited a greater loss in elevation, while shady and half-shady slopes exhibited an increase in elevation. More drastic topographical changes were observed in the shady and half-shady slopes. (4) The morphology of the area that had undergone a reduction in elevation was characterized by concave slopes, while convex slopes abounded in the area with increased elevation. (5) The sunny or shady properties of the slope aspect constituted the key factor influencing the topographical changes, followed by the height, inclination, and shape of the slopes. The work here can provide guidance for measures related to disaster prevention and mitigation.
CAO Zhi , HAN Zhen , LI Yurui , WANG Jieyong . Distribution of topographical changes triggered by prolonged heavy rainfall in the Chinese Loess Plateau: A case study of the Gutun catchment in Yan'an[J]. Journal of Geographical Sciences, 2024 , 34(3) : 571 -590 . DOI: 10.1007/s11442-024-2218-y
Figure 1 Location of the study area (Gutun catchment in Yan'an) and the precipitation in itNote: The monthly and daily precipitation values in 2013, 1960-2012, and 2014-2022 are shown on the right. The red dots in (a), (b), and (c) refer to the monthly and daily precipitation values in 2013. The blue bars in (a) and (b), and the blue dots in (c) refer to the average monthly and daily precipitation values in 1960-2012. The green bars in (a) and (b), and the green dots in (c) refer to the average monthly and daily precipitation values in 2014-2022. Data on meteorological observations at the Yan'an station were obtained from the China Meteorological Data Service Center (CMDSC) (http://data.cma.cn/). |
Table 1 Number of rainy days and the grades of precipitation in 2013 |
| Month | Rainy days | Light rain days | Moderate rain days | Heavy rain days | Torrential rain days | Days > mean | Days > mean+std |
|---|---|---|---|---|---|---|---|
| Jan | 2 | 2 | |||||
| Feb | 2 | 2 | 1 | ||||
| Mar | 3 | 3 | 1 | 1 | |||
| Apr | 4 | 3 | 1 | 2 | 1 | ||
| May | 11 | 10 | 1 | 3 | 1 | ||
| Jun | 9 | 7 | 1 | 1 | 2 | 1 | |
| Jul | 20 | 9 | 3 | 2 | 6 | 9 | 8 |
| Aug | 9 | 6 | 1 | 2 | 3 | 2 | |
| Sep | 12 | 8 | 3 | 1 | 6 | 1 | |
| Oct | 6 | 4 | 2 | 3 | |||
| Nov | 5 | 5 | 1 | ||||
| Dec | 0 |
Note: China's National Standard on the Grade of Precipitation (GB/T 28592-2012) has conditional standards of precipitation within 12 and 24 hours. We classified the grade of precipitation only according to the 24-hour standard based on the data on daily precipitation. “Light rain” refers to 0.1-9.9 mm of rainfall over 24 hours, “moderate rain” refers to 10.0-24.9 mm of rainfall over 24 hours, “heavy rain” is 25.0-49.9 mm of rainfall over 24 hours, and “torrential rain” is 50.0-99.9 mm of rainfall over 24 hours. “Days > mean” refers to the days in 2013 on which the daily precipitation exceeded the monthly average daily precipitation on rainy days in 1960-2012 and 2014-2022. “Days > mean+std” refers to the days in 2013 on which the daily precipitation exceeded the monthly average daily precipitation plus its standard deviation on rainy days in 1960-2012 and 2014-2022. |
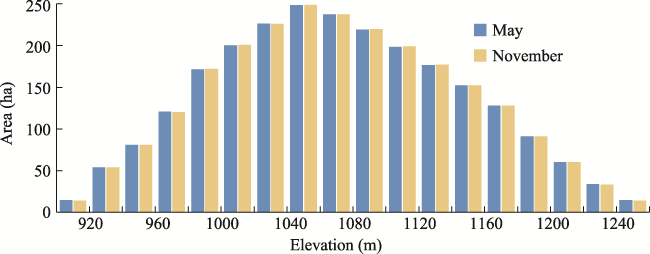
Figure 2 Histogram of elevations of the Gutun catchment before and after the rainy season |
Figure 3 Patterns of changes in elevation of the Gutun catchment before and after the rainy seasonNote: The histograms represent the areas of changes in the elevation and slope under different statistical intervals. |
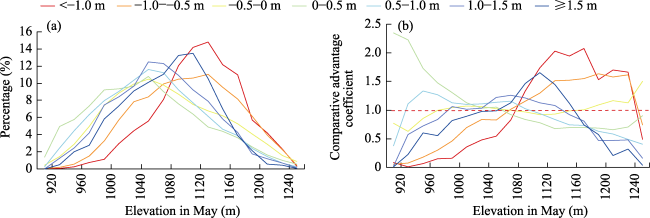
Figure 4 Coupling between the changes in elevation and the elevation before the rainy season |
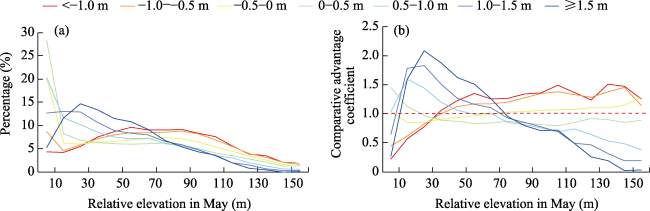
Figure 5 Coupling between the changes in elevation and the relative elevation before the rainy season |
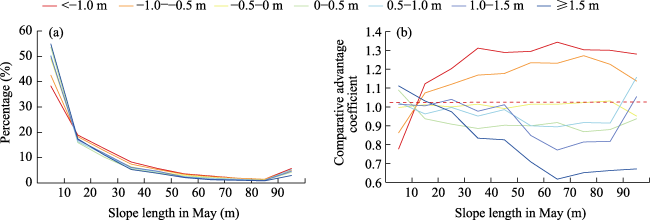
Figure 6 Coupling between the changes in elevation and the slope length before the rainy season |
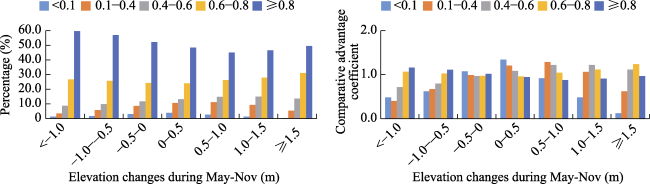
Figure 7 Coupling between the changes in elevation and the RPI before the rainy season |
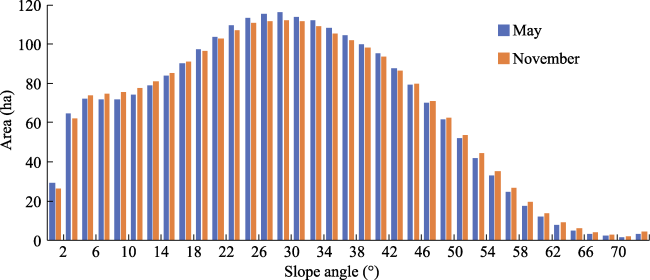
Figure 8 Histogram of slope inclinations of the Gutun catchment before and after the rainy season |
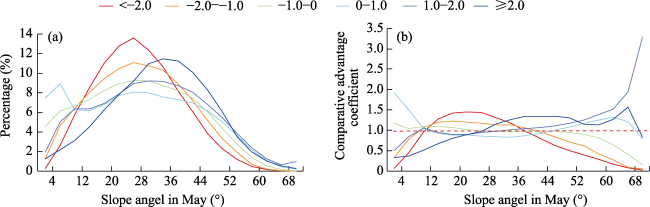
Figure 9 Coupling between the changes in slope inclination and the slope inclination before the rainy season |
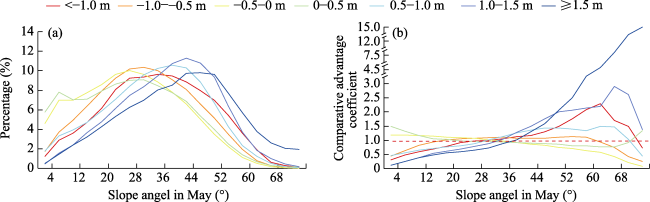
Figure 10 Coupling between the changes in elevation and the slope inclination before the rainy season |
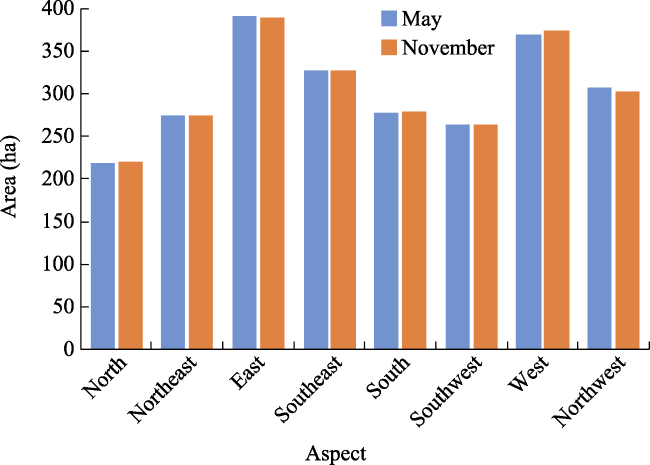
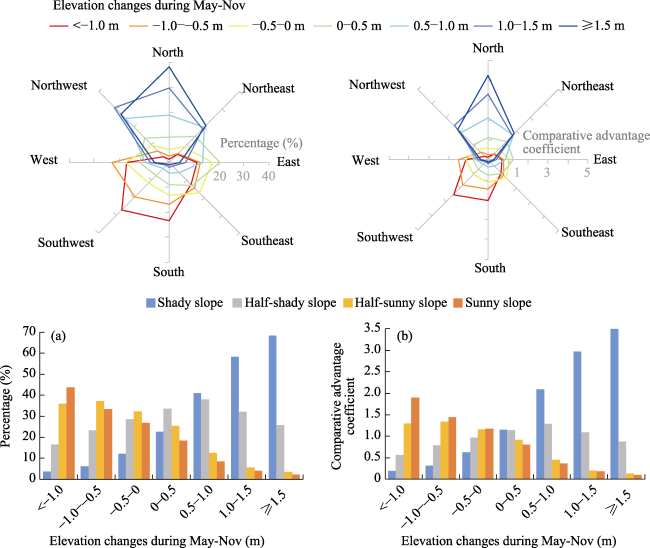
Figure 11 Histogram of the slope aspect of the Gutun catchment before and after the rainy season |
Figure 12 Coupling between the changes in elevation and the slope aspect before the rainy season |
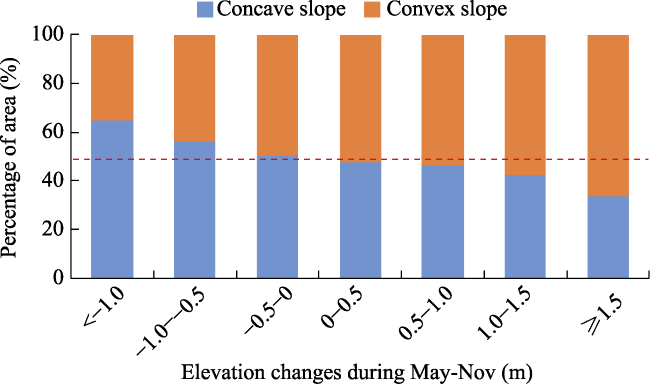
Figure 13 Ratios of convex and concave slopes in the Gutun catchment before and after the rainy season |
Table 2 Correlation between the changes in elevation and topographical factors |
| EC | E | RE | SL | RPI | SI | SS | SA8 | SA4 | NDVI | GLC | |
|---|---|---|---|---|---|---|---|---|---|---|---|
| EC | *** | *** | *** | *** | *** | *** | *** | *** | *** | *** | |
| E | −0.16 | *** | *** | *** | *** | *** | *** | *** | *** | *** | |
| RE | −0.16 | 0.75 | *** | *** | *** | *** | *** | *** | *** | *** | |
| SL | −0.05 | −0.03 | −0.06 | *** | *** | *** | *** | *** | *** | *** | |
| RPI | −0.05 | 0.34 | 0.55 | −0.17 | *** | *** | ** | *** | *** | *** | |
| SI | 0.11 | 0.16 | 0.07 | 0.12 | −0.06 | *** | *** | *** | *** | ||
| SS | 0.11 | 0.11 | 0.16 | −0.19 | 0.17 | 0.02 | *** | *** | |||
| SA8 | −0.16 | 0.00 | 0.04 | 0.04 | 0.00 | 0.03 | 0.00 | *** | *** | *** | |
| SA4 | −0.39 | 0.03 | 0.04 | −0.02 | 0.10 | 0.00 | 0.00 | 0.20 | *** | *** | |
| NDVI | 0.02 | 0.41 | 0.52 | 0.08 | 0.22 | 0.23 | 0.07 | 0.02 | −0.12 | *** | |
| GLC | 0.02 | −0.33 | −0.47 | −0.06 | −0.28 | −0.23 | −0.10 | −0.03 | 0.01 | −0.54 |
Note: “EC” refers to changes in elevation, “E” refers to the elevation, “RE” refers to the relative elevation, “SL” refers to the slope length, “RPI” refers to relative position index, “SI” refers to the slope inclination, “SS” refers to slope shape, “SA8” refers to the slope aspect along eight directions, “SA4” refers to the slope aspect with four orientations, “NDVI” refers to the normalized difference vegetation index, and “GLC” refers to gully land consolidation. “**” refers to statistical significance at the 0.05 level while “***” refers to statistical significance at the 0.01 level. |
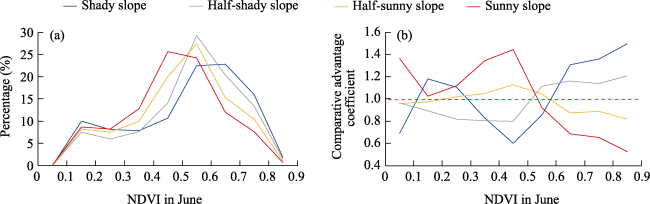
Figure 14 Coupling between the NDVI and the shape of the slopes before the rainy season |
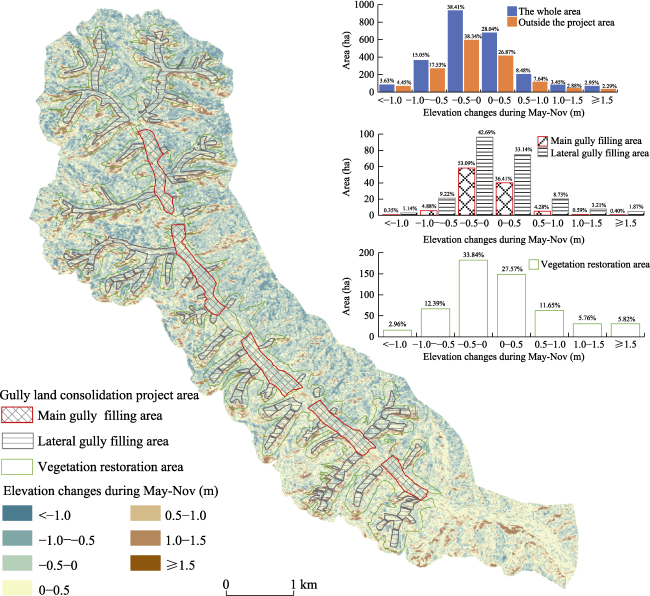
Figure 15 Comparison of changes in elevation between the Gutun catchment and the area under the Gully Land Consolidation ProjectNote: The histograms reflect the areas undergoing different levels of changes in elevation between the Gutun catchment and the parts of its area designated under the Gully Land Consolidation Project. The percentage labels in the histograms reflect the area ratios of different levels of changes in elevation to the corresponding area. |
| [1] |
|
| [2] |
|
| [3] |
|
| [4] |
|
| [5] |
|
| [6] |
|
| [7] |
|
| [8] |
|
| [9] |
|
| [10] |
|
| [11] |
|
| [12] |
|
| [13] |
|
| [14] |
|
| [15] |
|
| [16] |
|
| [17] |
|
| [18] |
|
| [19] |
|
| [20] |
|
| [21] |
|
| [22] |
|
| [23] |
|
| [24] |
|
| [25] |
|
| [26] |
|
| [27] |
|
| [28] |
|
| [29] |
|
| [30] |
|
| [31] |
|
| [32] |
|
| [33] |
|
| [34] |
|
| [35] |
|
| [36] |
|
| [37] |
|
| [38] |
|
| [39] |
|
| [40] |
|
| [41] |
|
| [42] |
|
| [43] |
|
| [44] |
|
/
| 〈 |
|
〉 |