Research Articles

Development of periglacial landforms and soil formation in the Ilgaz Mountains and effect of climate (Western Black Sea Region-Türkiye)

  • DEDE Volkan , 1 ,
  • DENGİZ Orhan 2 ,
  • DEMİRAĞ TURAN İnci , 3, * ,
  • TÜRKEŞ Murat 4 ,
  • ŞENOL Hüseyin 5 ,
  • SERİN Soner 6
Expand
  • 1. Department of Geography, Ardahan University, Ardahan 75002, Turkey
  • 2. Department of Soil Science and Plant Nutrition, Faculty of Agriculture, Ondokuz Mayıs University, Samsun 55139, Turkey
  • 3. Department of Geography, Faculty of Human and Social Sciences, Samsun University, Samsun 55080, Turkey
  • 4. Center for Climate Change and Policy Studies, Boğaziçi University, İstanbul 34342, Turkey
  • 5. Faculty of Agriculture, Department of Soil Science and Plant Nutrition, Isparta University of Applied Sciences, Isparta 32200, Turkey
  • 6. Institute of Social Sciences, İstanbul University, İstanbul 34119, Turkey
*Demirağ Turan İnci, Associate Professor, E-mail:

Dede Volkan, Assistant Professor, E-mail:

Received date: 2022-05-23

  Accepted date: 2023-03-24

  Online published: 2024-04-24

Abstract

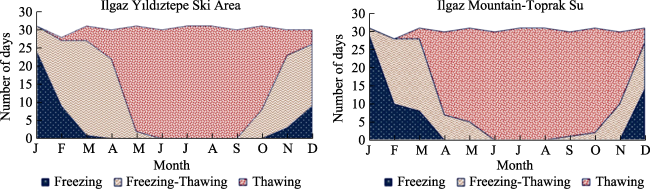
The main aims of the current study are to determine the morphological features of the periglacial landforms (non-sorted step, mud circle, stony earth circle, thufur, and congeliturbation) located on the Ilgaz Mountains, examine the physicochemical and mineralogical properties with pedological processes of the soils, and assess of the effects of climatic conditions controlling the development of landforms. The Ilgaz Mountains (2587 m a.s.l.), located in the Western Black Sea Region, within the Anatolian Mountains, are important in terms of periglacial landforms (mud circles, stony earth circles, thufurs, non-sorted steps, non-sorted stripes, congeliturbation deposits, and block currents). The descriptive statistics of 123 periglacial landforms measured by fieldworks were analyzed. The distribution of freezing and thawing in the Ilgaz Mountains throughout the year was evaluated, and it was found that freezing takes place between December and March, freezing-thawing takes place in April, May, October and November, and thawing takes place between June and October. According to soil properties, organic matter content changes from 1.88% to 12.72% in non-sorted step soils, while it is between 2.03% and 12.24% in stony earth circle soils. The organic matter is observed to be close to congeliturbation deposits at lower ratios compared to non-sorted steps, stony earth circles and mud circles. The soil reactions on stony earth circles and non-sorted steps vary between slightly acidic and slightly alkaline. On the other hand, soil samples taken from the mud circles are different from those taken from the non-sorted steps and stony earth circles. Their soil reaction is acidic, and pH changes between 4.86 and 6.25. The lime content also varies between 2.81% and 32.08%, with an average of 12.02%. The texture properties of soils are dominantly loam and clay loam, as in the non-sorted steps, stony earth circles, and mud circles. Considering their mineralogical properties, the XRD study was carried out to determine the primer mineral types and abundance degrees of soils of periglacial landforms. Quartz, muscovite and albite minerals were found in soils in the stony earth circle, while quartz, muscovite, orthoclase and albite minerals were determined as primary minerals in soils formed on the thufur landforms.

Cite this article

DEDE Volkan , DENGİZ Orhan , DEMİRAĞ TURAN İnci , TÜRKEŞ Murat , ŞENOL Hüseyin , SERİN Soner . Development of periglacial landforms and soil formation in the Ilgaz Mountains and effect of climate (Western Black Sea Region-Türkiye)[J]. Journal of Geographical Sciences, 2024 , 34(3) : 543 -570 . DOI: 10.1007/s11442-024-2217-z

1 Introduction

Periglacial processes take place in regions where cold climatic conditions are dominant and around glaciation. The term periglacial was first mentioned to describe the mechanical disintegration of sandstones in the Carpathian Mountains (Lozinski, 1909). Periglacial belts are high mountain areas in the middle latitudes and glacial regions in the high latitudes.
Numerous scientific studies have been carried out to investigate the effects of periglacial processes in different locations on the Earth. The morphometry of the periglacial landforms, how the climate affects these landforms, and the microbiological properties of the soils in the periglacial regions have drawn attention in recent years (e.g., Grab, 2002; Růžička et al., 2012; Uxa et al., 2017; Uxa and Mida, 2017; Abakumov et al., 2021). Scientific studies have been conducted for decades to evaluate the Earth's paleoclimatic conditions and determine periglacial processes (e.g., Oliva et al., 2016, 2018, 2020; Knight et al., 2019; Seligman et al., 2019; Soto and Alberti, 2019). Located in the middle latitudes of Anatolia, high mountain areas provide cold environment conditions.
Soil is the most important of the basic elements of life and is a complex system that is constantly changing. During the formation and development of soils, many soil-forming events such as weathering, fragmentation, transport, accumulation, and formation of new products come into prominence (Tunçay et al., 2020). According to Dengiz and Şenol (2018), soil gains a character depending on the geological material, climate characteristics, topography, and the period of the pedological process along with biological and human activities in the area. In particular, these factors do not depend on the structure and content of geological materials in the different characterization of soils in local areas, but they influence the water flow in the transport and accumulation of the soil material in suspension under the effect of change in the relief. Therefore, pedologically, landform or relief is one of the most important factors for soil formation and has a strong effect on water and energy flow and, thus, on parent material change in the local area. In the study conducted to determine the relationship between the development of soils spreading over the sandstone, limestone, and marl and landforms in the Ankara Soğulca Basin, Dengiz and Başkan (2010) stated that local landforms and parent material had direct and indirect strong effects on the characterization of soils in the local area. On the other hand, Dede et al. (2020) investigated differences in the physicochemical properties and erodibility parameters of soils formed in the periglacial landforms of the Ilgaz Mountains (non-sorted step, stony earth circle, mud circle, thufur, and congeliturbation deposit). The study by Erinç et al. (1961) study of titled “Periglacial Landforms on the Ilgaz Mountains” revealed the periglacial features of the Ilgaz Mountains. The study determined the distribution of periglacial landforms in highly general terms. The aim of the present study is to (1) determine the periglacial landforms of the Ilgaz Mountains and reveal their characteristics in detail; (2) determine the pedological development of soils formed in the periglacial landforms; and (3) comment about past climate conditions by considering up-to-date climate conditions, as well.

2 Material and method

2.1 Material

2.1.1 General characteristics of the study area

The Ilgaz Mountains are located in the Western Black Sea Region in Northern Anatolia, between 41°03ʹ-41°06ʹN and 33°46ʹ-33°53ʹE (Figure 1). The study area rises just like a wall at a short distance to the north of the Ilgaz district. The Ilgaz Mountains have a length of approximately 10 km in the east-west direction and a width of 2.5 km in the north-south direction. There are hills exceeding the elevation of 2000 m a.s.l. in places in the summit zone of the study area (Kavşakbaşı-2030 m a.s.l., Küçükçal-2096 m a.s.l., Küçükhacet-2546 m a.s.l.), and Büyükhacet is the highest peak (2587 m a.s.l.). The summit zone also constitutes the water section line in the east-west direction. Therefore, Taşlık, Sakar, and Asasuyu streams are drained in the area in the north of the summit zone, and the Kubbe stream is drained in the south.
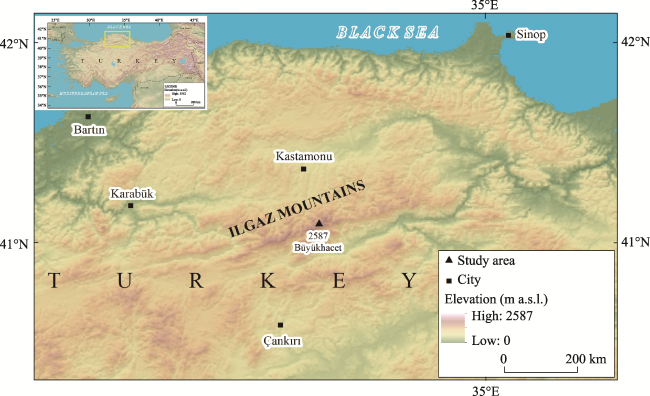
Figure 1 Location of Ilgaz Mountains
The Ilgaz Mountains have a Paleozoic-aged massive character. The right-lateral North Anatolian Fault (NAF) extends in the northeast-southwest direction, in the immediate south of the summit zone. The North Anatolian Fault divides the rocks forming the summit zone into two. While carbonate sandstone and limestone are dominant in the summit zone in the north of the North Anatolian Fault, there are limestone, sandstone, and marl in the south (Figure 2). All these systems are based on phyllite, schist, and metadiabase. The rock types with the widest distribution, completely covering the summit zone, are carbonate sandstone and marl (Uğuz and Sevin, 2011).
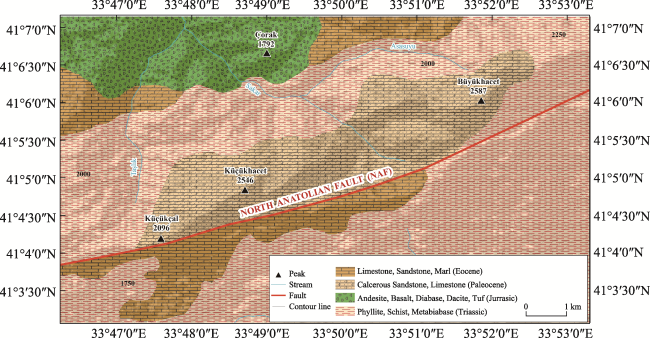
Figure 2 Topographic and geological structure of Ilgaz Mountains (Uğuz and Sevin, 2011)
The Ilgaz Mountains had different characteristics in the Late Pleistocene compared to today's climatic conditions. In this regard, glacier models in which paleoclimatic conditions are evaluated indicate that colder conditions prevailed. The study results reveal that the climate was 8-11°C colder and 1.5-2 times rainier during the Last Glacial Maximum (30-18 ka) in Anatolia (Sarıkaya and Çiner, 2015). Another study emphasizes that the climate was 4.5-6.4°C colder and 50% more humid during the Late Glacial Period (18-13 ka) (Sarıkaya, 2009). The specified climatic conditions form a suitable basis for the development of periglacial landforms.

2.2 Methods

2.2.1 Climatic and geomorphological analysis

For the climate of the Ilgaz Mountains and their surroundings (Kastamonu, İnciğez, Ilgaz Airport, Başören, İhsangazi, Ilgaz Toprak, Ilgaz Yıldıztepe, Tosya and Ilgaz) data from nine meteorological stations were used (Figure 3). With these data, as a result of the interpolation methods performed in the summit zone of the Ilgaz Mountains, the annual average total precipitation amount was found to be 500-600 mm, and the annual average air temperature was found to be 5-6°C. The study area is located in the subalpine vegetation zone. It starts from the upper boundary of the forest and continues to the summit zone. In general, the upper boundary of the forest starts from 2225 m a.s.l. Climate data sets for the study area were created by interpolating the data obtained from the Turkish Meteorology General Directorate with the data on the higher parts of the Ilgaz Mountains. Interpolation preoces was created by using Geographic Information Systems (GIS). At this stage, the IDW (Inverse Distance Weighting) method (Philip and Watson, 1982; Watson and Philip, 1985) was employed.
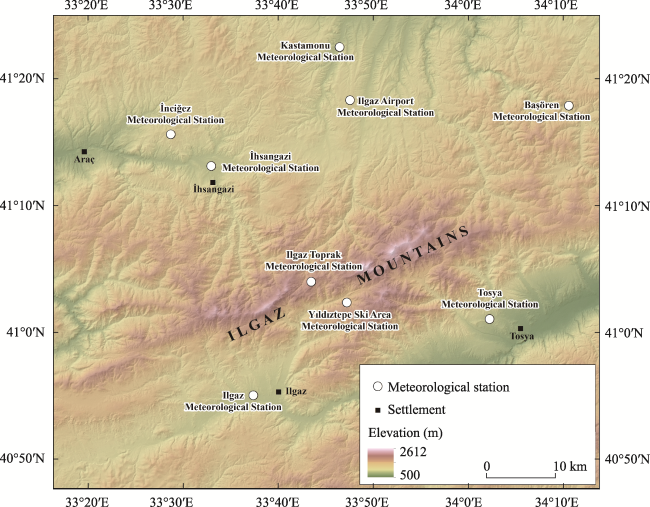
Figure 3 Distribution of climate stations
In the study, the climatological boundary conditions for periglacial process analysis were applied as follows:
1) Days when freezing took place at minimum and maximum temperatures below 0°C during the day;
2) Days when freezing-thawing took place at a minimum temperature below 0°C and a maximum temperature above 0°C;
3) Days when thawing took place at minimum and maximum temperatures above 0°C.
The climate types dominating the study area were examined with both the United Nations Environment Program's Drought Index (AI) and the United Nations Convention to Combat Desertification (UNEP/UNCCD) and Erinç's Drought (Rainfall Efficiency) Index (Erinç, 1965). AI is calculated using the following equation (UNEP, 1993):
$A I=\left(\frac{P}{P E T}\right)$
where P is annual precipitation (mm), and PET is potential evapotranspiration sums (mm). PET values were calculated by taking into account the approach used in the WATBUG program written by Willmott (1977) based on Thornthwaite's (1948) methodology. Table 1 contains the classification of AI vulues for Türkiye.
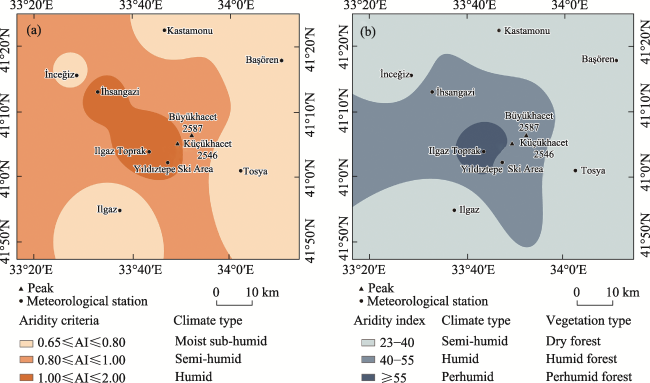
Table 1 Classification of climate types in Türkiye based on the UNEP/UNCCD Aridity Index (AI) (Türkeş, 2020)
AI criteria Climate type AI criteria Climate type
> 0.20 Arid 0.65 ≤ AI < 1.00 Semi-humid
0.20 ≤ AI < 0.50 Semi-arid 1.00 ≤ AI < 2.00 Humid
0.50 ≤ AI < 0.65 Dry sub-humid AI ≥ 2.00 Per humid
Erinç's Drought Index (Im) is calculated as follows:
$I_{m}=\left(\frac{\bar{P}}{\bar{T}_{\max }}\right)$
where $\bar{P}$ is the long-term average of annual precipitation (mm), and $\bar{T}_{\max }$ is the annual maximum temperature (°C).
Erinç's index (1965) can be divided into five main classes and corresponds to the main vegetation types in Turkey (Table 2). The United Nations Environment Program's Drought Index (AI) and the United Nations Convention to Combat Desertification (UNEP/UNCCD) and Erinç's Drought (Rainfall Efficiency) Index have been used to more clearly understand the effects of regional climate processes on shaping periglacial processes.
Table 2 Erinç's climate classification corresponding to the Aridity Index (Im) and vegetation formations from Kutiel and Türkeş (2005) based on Erinç (1965)
Im criteria Climate type Vegetation type
< 15 Arid Desert-like steppe
15-23 Semi-arid Steppe
23-40 Semi-humid Dry forest
40-55 Humid Humid forest
> 55 Per humid Per humid forest
Moreover, the distribution of freezing and thawing in the Ilgaz Mountains during the year was evaluated according to the data from Ilgaz Yıldıztepe and Ilgaz Topraksu meteorology stations.
In the study, firstly, a digital elevation model (DEM) was created using 1/25,000 scaled Kastamonu F31-c3 and F31-c4 map sheets. The global archives of ALOS PALSAR data are available from 2006 to 2011. For the study, analysis and mapping processes were carried out using ALOS PALSAR satellite data and DEM data with a resolution of 30 m. In determining the general geological structure of the study area, the 1/100.000 scaled Kastamonu-F31 map sheet produced by the General Directorate of Mineral Research and Exploration (MTA) was redrawn in detail with fieldworks (Uğuz and Sevin, 2011). Fieldworks were carried out in the Ilgaz Mountains between August 18 and 21, 2019. As a result of fieldworks, the development and evolution of periglacial landforms in the summit zone Ilgaz Mountains were determined. In this context, the width, length, and height measurements of 20 mud circles, 43 non-sorted steps, 30 thufurs and 30 stony earth circles were recorded. Periglacial landforms were measured in meters. Afterward, their descriptive statistics and correlations between them were calculated. The relationships between the characteristics of the periglacial landforms measured metrically and the topographic factors of the field were evaluated via correlation analysis. IBM SPSS Statistics 23v. software was used for basic descriptive statistics and multiple correlation analyses (IBM Corp, 2015).
Furthermore, in the study area, both the measured width and length of the non-sorted steps, the width of the plants surrounding the non-sorted steps and mud circles, the distribution of plant heights according to elevation and their relations with slopes, and the relations between the widths and lengths of the non-sorted steps of the northern and southern slopes, and the distribution of the non-sorted steps according to slope exposure were analyzed with graphical (X-Y scatter) and statistical solutions methods. Possible correlations between data pairs and their distribution characteristics were first evaluated visually with X-Y scatter graphs, either for northern and southern slopes together or separately for northern and southern slopes when appropriate. Based on this visual analysis, samples that did not provide meaningful and contributing results were eliminated.

2.2.2 Pedological and mineralogical analysis

In different periglacial landforms, a total of 27 soil samples were taken to investigate their physicochemical and mineralogical properties in the laboratory. Soil samples were then air-dried and passed through a 2 mm sieve to prepare for laboratory analysis. Soil texture was determined by the hydrometer method (Bouyoucos, 1951) after removal of organic matter with 30% H2O2, of sulfate was removed by leaching salts with distilled water, carbonates were removed with 1 MNaoAC at pH 5, and dispersion was performed by agitating the sample in 10 ml of 40% sodium hexametaphosphate (calcon) (Gee and Bauder, 1986) and bulk density was analyzed according to Blacke and Hartge (1986). Another soil physical parameter is aggregate stability analyzed by considering of wet sieving based on Kemper and Rosenau (1986). Organic matter was determined in air-dry samples using the Walkley-Black wet digestion method (Nelson and Sommers, 1982). Field capacity, wilding point, available water capacity, pH, and electrical conductivity (EC) were determined by method of the Soil Survey Laboratory (1992). Lime content was found with a Scheibler calsimeter (Soil Survey Staff, 1993). Exchangeable cations were measured using a 1N NH4OAC (pH 7) method (Soil Survey Laboratory, 1992). pH far from normal distribution has negative skewness, whereas other properties without normal distribution are positively skewed. Many researchers classify the coefficient of variation, which is considered an important indicator in explaining changes in soil properties, as low (<15%), medium (15%-35%) and high (>35%) according to the values it takes (Mulla et al., 2000; Zhou et al., 2010; Dengiz, 2020).
Following the degradation of organic matter with dilute and Na-acetate-buffered H2O2 (pH 5), the clay fraction (< 2  μm) was determined using soil dispersion with a sodium metaphosphate (calgon) and sedimentation in water. Cu Kα radiation at an angle of 2θ ranging from 2° to 30°, with steps of 0.02° 2θ and a counting time of 2 seconds per step, specimens oriented on glass slides were analyzed with X-ray diffraction (XRD). Then, Mg and K saturation, along with ethylene glycol solvation (EG) methods were applied, respectively, followed by heating at 550°C for 2 hours. The minerals and their relative abundances were determined using the diagnostic XRD spacing of the minerals, and then evaluated using their XRD relative peak intensities obtained from the XRD graphs (Whittig and Allardice, 1986). The selected soil samples were also studied with a scanning electron microscope (SEM). In this analysis, microprobe process was not done. The samples were mounted onto aluminum stubs and coated first with carbon and then with gold. This double coating was proved to be superior to a coating of carbon or gold alone. Each specimen was studied at magnifications ranging from 250 to 20,000.

3 Results

3.1 Periglacial landforms

Periglacial landforms on the Ilgaz Mountains consist of mud circles, stony earth circles, non-sorted steps, non-sorted stripes, thufur, congeliturbation deposits, and block currents. In the general sense, mud circles and thufurs cover large areas on the summit plains where Küçükçal, Küçükhacet and Büyükhacet hills are located. Stony earth circles spread both on the summit plains and the southern slopes of the summit plains. Furthermore, non-sorted steps develop in the south of Küçükçal Hill and Büyükhacet Hill, the west of Kavşakbaşı Hill, and on both northern and southern slopes of Küçükhacet Hill in the slope direction. Congeliturbation deposits are located in the slightly sloping area between Kavşakbaşı Hill and Büyükhacet Hill and in the east of Küçükhacet Hill. Moreover, the non-sorted stripes are located in an area close to the summit plains in the south of Küçükhacet Hill and Büyükhacet Hill. Finally, block currents cover large areas in the north of the summit plains, and they are also in motion in the sloping areas in the south of Küçükhacet Hill (Figure 4).
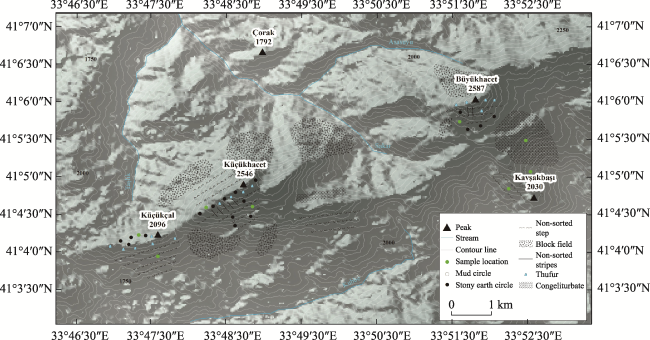
Figure 4 Periglacial geomorphology of Ilgaz Mountains

3.2 UNEP Aridity, Erinç's indices, descriptive and correlation statistics

According to the UNEP Aridity and Erinç's Indices, the climate type of the Ilgaz Mountains was revealed as a humid-cold mountain climate (Figure 5).
Figure 5 Climate types according to UNEP-UNCCD Aridity Index (AI) (a) and Erinç Index (b)
The distribution of freezing and thawing in the Ilgaz Mountains throughout the year was evaluated according to the data from Ilgaz Yıldıztepe and Ilgaz Topraksu meteorological stations. In light of the data obtained, freezing takes place between December and March, freezing-thawing takes place in April, May, October and November, and thawing takes place between June and October (Figure 6).
Figure 6 Freezing-thawing variation during the year
Descriptive statistics calculated for the measured sizes of microperiglacial landforms and the Pearson's correlation results were evaluated. X-Y scatter graphs are given in the text only in a statistically significant correlation. Table 3 contains a summary of the descriptive statistic of periglacial landforms measured by fieldworks. The average length, width, and height of the non-sorted steps observed in the locality of Küçükçal Hill are 484.23 cm, 60.62 cm, and 25.77 cm, respectively. The coefficients of variation (%) were calculated as 38.44, 29.02, and 32.28, respectively (Table 3). Moreover, according to the correlation analysis of the measurement data obtained from 3 different areas of the Ilgaz Mountains using the Pearson's correlation coefficient r, a high significant positive correlation of 88.9% was identified between the width and length of stony earth circles around Küçükçal Hill (Table 3) (p<0.01).
Table 3 Descriptive statistics and correlation matrix results of the samples taken from the Ilgaz Mountains periglacial landforms
Küçükçal Hill
a1) Non-sorted step (n=13) descriptive statistics a2) Non-sorted step (n=13) correlation coefficients
Mean (cm) StD (cm) CV (%) Length Width Height
Length 484.23 186.143 38.44 Length 1 -0.275 -0.05
Width 60.62 17.590 29.02 Width 1 -0.054
Height 25.77 8.318 32.28 Height 1
b1) Stony earth circle (n=10) descriptive statistics b2) Stony earth circle (n=10) correlation coefficients
Mean (cm) StD (cm) CV (%) Length Width Height
Length 721 229.114 31.78 Length 1 0.889** -0.278
Width 59.50 23.148 38.91 Width 1 -0.046
Height 25.10 13.287 52.93 Height 1
c1) Mud circle (n=5) descriptive statistics c2) Mud circle (n=5) correlation coefficients
Mean (cm) StD (cm) CV (%) Length Width Height
Length 46.20 11.713 25.35 Length 1 0.865 -0.556
Width 42.20 14.114 33.45 Width 1 -0.074
Height 9.40 4.393 46.73 Height 1
d1) Thufur (n=5) descriptive statistics d2) Thufur (n=5) correlation coefficients
Mean (cm) StD (cm) CV (%) Length Width Height
Length 40.60 7.537 18.56 Length 1 0.631 0.767
Width 41.20 4.438 10.78 Width 1 -0.003
Height 12.20 3.34 27.43 Height 1
Büyükhacet Hill
a1) Non-sorted step (n=10) descriptive statistics a2) Non-sorted step (n=10) correlation coefficients
Mean (cm) StD (cm) CV (%) Length Width Height
Length 721 229.114 31.78 Length 1 0.356 -0.220
Width 59.50 23.148 38.91 Width 1 0.473
Height 25.10 13.287 52.93 Height 1
b1) Stony earth circle (n=5) descriptive statistics b2) Stony earth circle (n=5) correlation coefficients
Mean (cm) StD (cm) CV (%) Length Width Height
Length 60.20 13.971 23.21 Length 1 0.892* -0.012
Width 42 7.583 18.06 Width 1 0.147
Height 13 4.472 34.4 Height 1
c1) Mud circle (n=11) descriptive statistics c2) Mud circle (n=11) correlation coefficients
Mean (cm) StD (cm) CV (%) Length Width Height
Length 41.18 19.156 46.52 Length 1 0.881*** 0.765**
Width 39.45 18.490 46.87 Width 1 0.677*
Height 18.18 5.095 28.03 Height 1
d1) Thufur (n=5) descriptive statistics d2) Thufur (n=5) correlation coefficients
Mean (cm) StD (cm) CV (%) Length Width Height
Length 64 21.036 32.87 Length 1 0.457 0.057
Width 42.40 5.128 12.09 Width 1 0.393
Height 11.60 2.702 23.29 Height 1
Küçükhacet Hill
a1) Non-sorted step (n=20) descriptive statistics a2) Non-sorted step (n=20) correlation coefficients
Mean (cm) StD (cm) CV (%) Length Width Height
Length 581.75 168.564 28.98 Length 1 -0.198 -0.028
Width 50 12.794 25.59 Width 1 0.528*
Height 16.30 5.371 32.95 Height 1
b1) Stony earth circle (n=15) descriptive statistics b2) Stony earth circle (n=15) correlation coefficients
Mean (cm) StD (cm) CV (%) Length Width Height
Length 55.93 12.601 22.53 Length 1 0.593* -0.491
Width 48.93 11.430 23.36 Width 1 -0.605*
Height 6.07 2.344 38.62 Height 1
c1) Thufur (n=20) descriptive statistics c2) Thufur (n=20) correlation coefficients
Mean (cm) StD (cm) CV (%) Length Width Height
Length 47.40 16.333 34.46 Length 1 0.904*** 0.860**
Width 43.05 15.219 35.35 Width 1 0.909***
Height 14.65 7.666 52.33 Height 1

(*), (**) and (***): Statistically significant correlation coefficients at 0.05, 0.01 and 0.001 levels, respectively.

A high positive correlation of 89.2% (p<0.05) was found between the width and length of the stony earth circles measured in the Büyükhacet Hill summit zone (Table 3), a high positive correlation of 88.1% between the length and width of the stony earth circles (Table 3) (p<0.001), a high positive correlation of 76.5% was revealed between their length and height (p<0.01), and a high positive correlation of 67.7% between their width and height (p<0.05).
In the locality of Küçükhacet Hill, a positive moderate correlation of 52.8% was revealed between the width and height of the non-sorted steps (p<0.05), a moderate positive correlation of 59.3% was found between the length and width of the stony earth circles (p<0.05), and a high negative correlation of 60.5% was identified between their width and height (p<0.05). On the other hand, there was a high positive correlation of 90.4% between the length and width of thufur, and a high positive correlation of 90.9% between the width and the height of thufur (p<0.001). Moreover, a high positive correlation of 86% was found between the length and the height of thufur (p<0.001) (Table 3).
When the width-dependent length of the stony earth circle observed in the locality of Küçükçal Hill was modeled, it was found that the model was significant (p=0.001), and the explanatory power of the model was quite high (79%). Accordingly, if we increase the width by one unit in the locality of Küçükçal Hill, the length will increase by 1.057 folds (Figure 7).
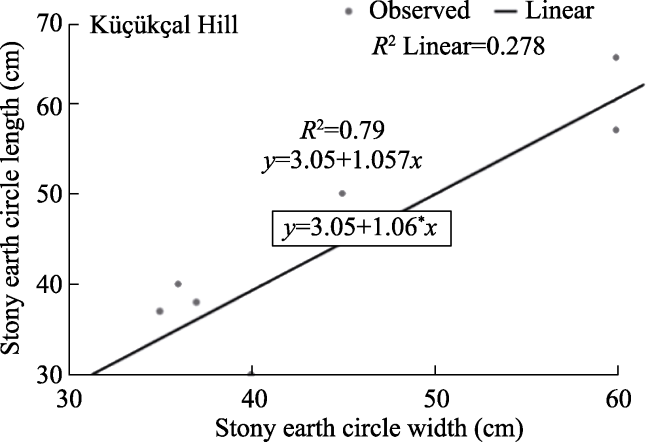
Figure 7 X-Y scatter plots showing statistically significant positive linear relationships between the characteristics of the stony earth circle observed in Küçükçal Hill
In the locality of Büyükhacet Hill, a linear correlation was found between the width and the length of the stony earth circle (p=0.042). The explanatory power of the created model was determined as 79.6%. It can be said that if we increase the width by one unit, the length will increase by 1.643 folds. Linear correlations were also identified between the length-width and heights of the stony earth circles. It can be said that if the circle width increases by one unit, its length will increase by 0.9 folds (p<0.001), if its height increases by one unit, its length will increase by 2.88 folds (p=0.006), and if its height increases by one unit, its width will increase by 2.458 folds (p=0.022). The explanatory power of the models is high for stony earth circle and mud circle lengths-widths. For others, it is moderate (Figure 8).
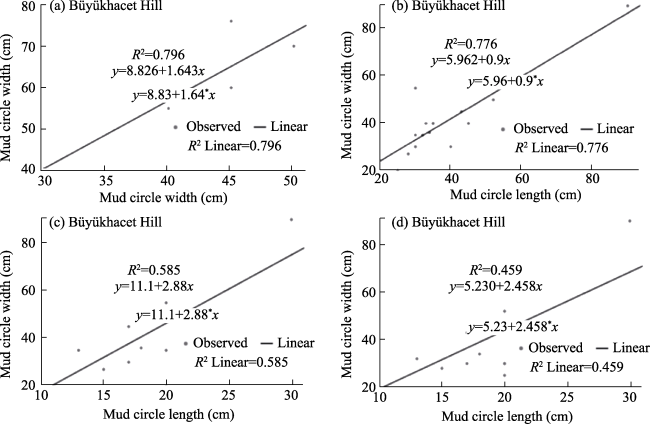
Figure 8 X-Y scatter plots showing statistically significant positive linear relationships between the features of periglacial landforms observed in the Büyükhacet Hill
A linear model was created between the width and height of the non-sorted steps in the locality of Küçükhacet Hill (p=0.017). However, the explanatory power (appropriateness) of the created model is low (27.8%). If the length is increased by one fold, the width will increase by 1.26 folds. A linear model was created between the length and width of the stony earth circles (p=0.020), but the explanatory power of the model was observed to be low (35.1%). It can be said that if their width increases by one fold, their length will increase by 0.65 folds. A negative linear model was created between the width and height of the stony earth circle (p=0.017), and the model did not exhibit a high fit (36.6%). It can be said that if its height increases by one fold, its width decreases by 2.95 folds. Linear correlations between the length-width-height of thufur were modeled (p<0.001), and the explanatory power of the models was found to be high. It can be said that if the width of thufur increases by one fold, the height will increase by 0.97 folds, if the height increases by one fold, the length will increase by 1.83 folds, and the width will increase by 1.8 folds (Figure 9).
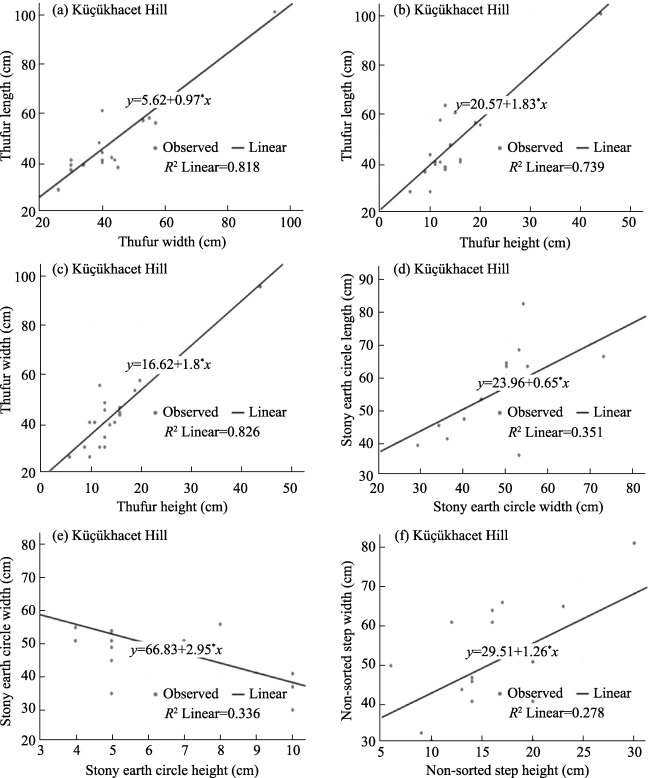
Figure 9 X-Y scatter plots showing statistically significant positive linear relationships between the features of periglacial landforms observed in Küçükhacet Hill

3.3 Pedological and mineralogical features of different periglacial landforms

Table 4 Fieldwork measurement information of soil samples taken from Ilgaz Mountains
Sample code Sample name Coordinates Elevation (m) Location
ILG19-01 Non-sorted step 41°03.891N / 33°46.992E 1943 Küçükçal Hill
ILG19-02 Non-sorted step 41°03.895N / 33°46.992E 1945 Küçükçal Hill
ILG19-03 Non-sorted step 41°03.909N / 33°46.990E 1969 Küçükçal Hill
ILG19-04 Stony earth circle 41°04.063N / 33°46.949E 2089 Küçükçal Hill
ILG19-05 Mud circle 41°04.065N / 33°46.951E 2090 Küçükçal Hill
ILG19-06 Stony earth circle 41°04.074N / 33°46.935E 2091 Küçükçal Hill
ILG19-07 Thufur 41°04.089N / 33°47.059E 2092 Küçükçal Hill
ILG19-08 Out of landforms 41°04.107N / 33°47.111E 2080 Küçükçal Hill
ILG19-09 Congeliturbation 41°05.489N / 33°52.984E 2068 Büyükhacet Hill
ILG19-10 Mud circle 41°05.845N / 33°52.714E 2150 Büyükhacet Hill
ILG19-11 Congeliturbation 41°05.743N / 33°52.563E 2215 Büyükhacet Hill
ILG19-12 Mud circle 41°05.708N / 33°52.149E 2325 Büyükhacet Hill
ILG19-13 Non-sorted step 41°05.704N / 33°52.142E 2323 Büyükhacet Hill
ILG19-14 Thufur 41°05.756N / 33°52.101E 2346 Büyükhacet Hill
ILG19-15 Stony earth circle 41°05.759N / 33°52.087E 2350 Büyükhacet Hill
ILG19-16 Mud circle 41°05.327N / 33°53.071E 2016 Büyükhacet Hill
ILG19-17 Non-sorted step 41°05.326N / 33°53.073E 2015 Büyükhacet Hill
ILG19-18 Non-sorted step 41°04.290N / 33°50.140E 2145 Küçükhacet Hill
ILG19-19 Stony earth circle 41°04.363N / 33°50.087E 2188 Küçükhacet Hill
ILG19-20 Non-sorted step 41°04.396N / 33°50.075E 2210 KüçükhacetHill
ILG19-21 Non-sorted step 41°04.531N / 33°50.032E 2325 Küçükhacet Hill
ILG19-22 Thufur 41°05.565N / 33°49.975E 2359 Küçükhacet Hill
ILG19-23 Thufur 41°04.588N / 33°49.924E 2370 Küçükhacet Hill
ILG19-24 Stony earth circle 41°04.589N / 33°49.914E 2370 Küçükhacet Hill
ILG19-25 Thufur 41°04.631N / 33°49.834E 2398 Küçükhacet Hill
ILG19-26 Non-sorted step 41°04.639N / 33°49.793E 2395 Küçükhacet Hill
ILG19-27 Stony earth circle 41°04.577N / 33°49.684E 2380 Küçükhacet Hill
Soil samples of periglacial landforms are shown in Figure 10, and the results and descriptive statistics of 17 different physical and chemical properties of these soil samples are presented in Tables 5 and 6.
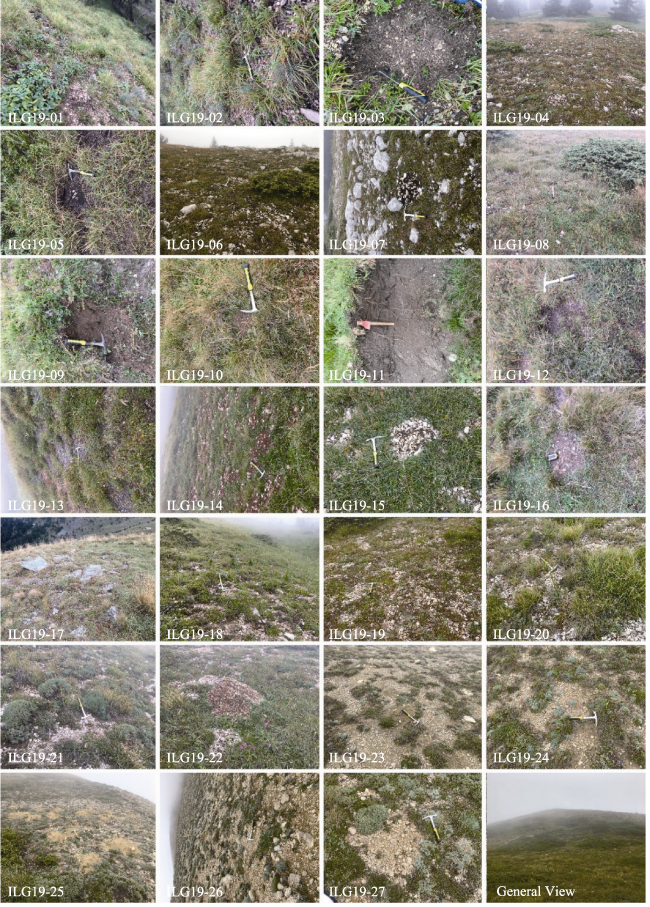
Figure 10 General views of the soil samples taken from the Ilgaz Mountains
Table 5 Descriptive statistics of physico-chemical properties of soil samples taken from non-sorted steps and stony earth circles
Parameters Average Standard
deviation
Coefficient of variability* Variance Lowest value Highest value Distortion** Kurtosis
Non-sorted step
pH 7.06 0.32 1.05 0.10 6.26 7.31 -2.27 5.59
EC 0.34 0.14 0.49 0.02 0.20 0.68 1.90 4.26
OM (%) 6.46 3.18 10.84 10.11 1.88 12.72 0.74 0.83
CaCO3 (%) 14.66 19.20 58.94 369.00 0.35 61.29 2.22 4.93
Ca (meq/100 gr) 17.80 10.95 31.24 120.11 2.96 34.20 -0.27 -1.13
Mg (meq/100 gr) 17.67 9.78 30.22 95.81 4.99 35.21 0.22 -0.24
Na (meq/100 gr) 0.53 0.07 0.22 0.00 0.43 0.65 0.30 -1.01
K (meq/100 gr) 0.82 0.53 1.50 0.28 0.21 1.71 0.75 -0.54
Clay (%) 25.82 7.69 21.00 59.22 14.09 35.09 -0.40 -1.21
Silt (%) 28.12 6.18 18.97 38.23 19.18 38.15 0.31 -0.90
Sand (%) 46.04 7.61 27.17 57.94 33.65 60.82 0.43 1.25
BD (gr/cm3) 1.27 0.12 0.45 0.01 1.05 1.50 0.14 1.58
HC (cm/ha) 22.08 18.09 52.45 327.51 6.27 58.72 1.31 0.74
PC (%) 32.47 4.54 13.60 20.65 23.60 37.20 -0.86 0.33
WP (%) 18.76 4.10 12.00 16.82 11.90 23.90 -0.26 -1.01
AW (%) 13.71 1.54 4.70 2.40 11.40 16.10 -0.06 -0.56
AS (%) 44.71 21.47 55.56 461.16 23.20 78.76 0.74 -1.26
Stony earth circle
pH 7.01 0.35 1.07 0.12 6.39 7.46 -1.04 2.56
EC 0.32 0.10 0.26 0.01 0.21 0.47 0.02 -0.82
OM (%) 8.03 3.72 10.21 13.87 2.03 12.24 -0.69 -0.08
CaCO3 (%) 12.73 14.01 29.48 196.38 0.32 32.80 1.00 -1.65
Ca (meq/100 gr) 24.76 12.21 31.76 149.32 12.99 44.75 0.98 -0.18
Mg (meq/100 gr) 18.45 7.85 21.09 61.71 7.74 28.83 -0.03 -1.22
Na (meq/100 gr) 0.54 0.14 0.41 0.02 0.38 0.79 0.78 0.75
K (meq/100 gr) 0.59 0.32 0.91 0.10 0.26 1.17 1.23 1.67
Clay (%) 22.75 9.30 22.08 86.64 12.55 34.63 0.14 -2.35
Silt (%) 36.28 6.21 17.30 38.58 27.07 44.37 -0.11 -0.31
Sand (%) 40.96 10.28 24.69 105.71 30.82 55.51 0.48 -1.78
BD (gr/cm3) 1.15 0.14 0.44 0.02 0.98 1.42 1.35 3.07
HC (cm/ha) 38.17 28.22 72.98 79.57 20.66 75.64 0.10 -1.79
FC (%) 33.38 3.17 8.00 10.05 29.40 37.40 -0.04 -1.99
WP (%) 17.80 3.70 8.20 13.71 13.80 22.00 0.05 -2.37
AW (%) 15.58 1.57 4.50 2.47 13.60 18.10 0.54 0.38
AS (%) 31.54 15.96 43.62 254.84 10.18 53.80 0.07 -0.84

EC: Electrical conductivity, OM: Organic matter, BD: Bulk density, HC: Hydraulic conductivity, FC: Field capacity, WP: Wilting Point, AW: Available water, AS: Aggregate stability

Table 6 Descriptive statistics of physico-chemical properties of soil samples taken from mud circle, thufur and congeliturbation
Parameters Average Standard
deviation
Coefficient of variability* Variance Lowest value Highest value Distortion** Kurtosis
Mud circle
pH 5.69 0.59 1.39 0.35 4.86 6.25 -1.25 1.89
EC 0.24 0.13 0.28 0.01 0.16 0.44 1.87 3.54
OM (%) 6.08 2.70 6.50 7.33 2.94 9.44 0.20 0.43
CaCO3 (%) 3.62 1.19 2.30 1.43 0.44 2.76 -0.04 -5.54
Ca (meq/100 gr) 5.97 1.73 3.85 3.02 3.82 7.67 -0.52 -2.05
Mg (meq/100 gr) 7.02 2.07 4.51 4.29 4.27 8.78 -0.94 -0.65
Na (meq/100 gr) 0.41 0.06 0.17 0.00 0.33 0.50 -0.20 1.12
K (meq/100 gr) 0.55 0.33 0.80 0.11 0.16 0.96 0.08 0.39
Clay (%) 17.78 1.36 2.89 1.87 16.30 19.19 -0.07 -4.17
Silt (%) 30.15 4.38 8.15 19.25 25.96 34.11 -0.02 -5.80
Sand (%) 52.06 4.69 10.17 22.05 47.57 57.74 0.44 -2.82
BD (gr/cm3) 1.24 0.14 0.33 0.02 1.11 1.44 1.03 0.38
HC (cm/ha) 36.72 8.25 15.35 68.18 28.78 44.13 -0.03 -5.78
FC (%) 28.45 3.82 8.70 14.61 22.90 31.60 -1.61 2.93
WP (%) 14.75 2.19 5.30 4.80 11.80 17.10 -0.80 1.85
AW (%) 13.70 1.76 3.90 3.11 11.10 15.00 -1.78 3.36
AS (%) 22.62 6.10 14.45 37.31 15.07 29.52 -0.28 -0.21
Thufur
pH 7.13 0.49 1.09 0.24 6.62 7.71 -0.01 -2.60
EC 0.39 0.15 0.42 0.02 0.20 .63 0.56 0.41
OM (%) 4.15 1.75 4.77 3.06 2.24 7.01 1.23 2.62
CaCO3 (%) 12.02 12.29 29.27 151.11 2.81 32.08 1.44 1.65
Ca (meq/100 gr) 17.93 9.68 26.03 93.74 6.89 32.92 0.89 1.33
Mg (meq/100 gr) 9.77 4.33 8.35 18.75 4.90 13.25 -0.60 -3.30
Na (meq/100 gr) 0.49 0.09 0.25 0.01 0.38 0.63 0.56 -0.73
K (meq/100 gr) 0.50 0.30 0.77 0.09 0.09 0.86 -0.38 -1.27
Clay (%) 23.64 7.94 19.84 63.08 12.32 32.16 -0.69 -0.88
Silt (%) 34.47 5.80 15.67 33.70 28.44 44.11 1.42 2.97
Sand (%) 41.88 5.40 14.25 29.17 33.74 47.99 -0.79 0.59
BD (gr/cm3) 1.33 0.09 0.27 0.01 1.20 1.47 0.02 0.65
HC (cm/ha) 19.42 13.93 35.49 194.11 7.18 42.67 1.53 2.65
FC (%) 30.68 4.54 9.20 20.64 25.60 34.80 -0.45 -3.13
WP (%) 16.60 4.52 10.10 20.43 10.60 20.70 -0.65 -2.31
AW (%) 14.08 1.02 2.80 1.04 12.60 15.40 -0.34 0.97
AS (%) 18.50 4.83 12.58 23.34 12.90 25.48 0.49 -0.03
Congeliturbation
pH 4.86 0.07 0.15 0.006 4.80 4.95 0.93 -
EC 0.18 0.01 0.03 0.00 0.16 0.19 -1.73 -
Parameters Average Standard
deviation
Coefficient of variability* Variance Lowest value Highest value Distortion** Kurtosis
OM (%) 5.07 0.44 0.84 0.19 4.58 5.42 -1.37 -
CaCO3 (%) 0.51 0.35 0.71 0.12 0.23 0.79 0.69 -
Ca (meq/100 gr) 7.20 4.53 8.52 20.54 3.84 12.36 1.49 -
Mg (meq/100 gr) 5.96 1.88 3.59 3.54 4.50 8.09 1.37 -
Na (meq/100 gr) 0.46 0.07 0.14 0.006 0.41 0.55 1.59 -
K (meq/100 gr) 0.61 0.28 0.56 0.08 0.37 0.93 0.99 -
Clay (%) 27.23 4.73 9.45 22.45 22.72 32.17 0.39 -
Silt (%) 27.33 3.52 7.05 12.447 23.89 30.94 0.21 -
Sand (%) 45.43 4.15 7.89 17.22 42.23 50.12 1.40 -
BD (gr/cm3) 1.31 0.01 0.03 0.00 1.30 1.33 -0.93 -
HC (cm/ha) 14.26 6.50 12.89 42.37 8.35 21.24 0.71 -
FC (%) 32.63 2.05 4.10 4.20 30.60 34.70 0.07 -
WP (%) 19.16 2.23 4.40 5.00 17.20 21.60 0.89 -
AW (%) 13.46 0.40 0.80 0.16 13.10 13.90 0.72 -
AS (%) 35.56 7.68 15.09 59.06 27.17 42.26 -0.94 -

EC: Electrical conductivity, OM: Organic matter, BD: Bulk density, HC: Hydraulic conductivity, FC: Field capacity, WP: Wilting point, AW: Available water, AS: Aggregate stability

The reactions of soils belonging to stony earth circles and non-sorted steps vary between slightly acidic and slightly alkaline, and the average pH values are 7.01 and 7.06 (Table 5). Organic matter values vary a lot, ranging from 1.88% to 12.72% in non-sorted step soils and between 2.03% and 12.24% in stony earth circle soils. The dominant cation in soils is Ca ion, followed by Mg ion. The general texture properties of soils are sandy clay loam, loam and clay loam. With the increase in clay and organic matter of soils, the bulk densities of soils decrease, and their water-holding capacity increases. Another remarkable feature of soils belonging to these landforms is the decreased in aggregate stability with the increased height. While the skewness coefficients, Ca, Mg, Na, clay, silt, sand, bulk density, wilting point and useful water exhibit normal distribution, other properties are far from a normal distribution. While hydraulic conductivity and aggregate stability in soils of both periglacial landforms have high variation, clay, silt and sand exhibit medium variation, and other soil properties exhibit low variation. Only CaCO3 values exhibited high variation in non-sorted steps and medium variation in stony earth circles.
Soil samples taken from the mud circles of the Ilgaz Mountains at the elevations of 2016 m a.s.l and 2323 m a.s.l are different from soils taken from the non-sorted steps and stony earth circles, with acidic reaction and pH values ranging between 4.86 and 6.25. However, the organic matter value is 9.44% at 2090 m a.s.l. as in other periglacial landforms, and this ratio decreases to 2.76% as the height increases (2023 m a.s.l.). Lime ratios in the soil are quite low and vary between 0.74% and 2.76%. Furthermore, soils have loam and sandy loam textures, as in non-sorted steps and stony earth circles. However, these soils have the lowest clay and highest sand ratios within periglacial landforms. Bulk densities of soils vary between 1.11 gr/cm3 and 1.44 gr/cm3, and their permeability is on average 36.72 cm/h. Soils in thufur, on the other hand, as in the non-sorted steps and stony earth circles, have soil reactions varying between slightly acidic and slightly alkaline. The organic matter values are observed to be close to congeliturbation deposits at lower ratios compared to non-sorted steps, stony earth circles and mud circles, with an average value of 4.15%. The lime value varies between 2.81% and 32.08%, with an average of 12.02%. The texture properties of soils vary in the texture classes of loam and clay loam, as in the non-sorted steps, stony earth circles and mud circles. Values of bulk densities vary between 1.20 and 1.47 gr/cm3, and hydraulic conductivity values vary between 7.18 and 42.67 cm/h. The periglacial landform with the lowest pH values of soil samples is the congeliturbation deposit, with pH values between 4.80 and 4.95.
The lime content of these soils is also very low, with an average of 0.51%. Organic matters vary between 4.58% and 5.42%. Soils have loam, sandy clay loam, and clay loam textures. Their bulk densities are usually 1.30 gr/cm3, and their permeability is 14.26 cm/h on average. The aggregate stability of soils is 35.56% on average, and it is possible to see the decreasing trend with the increase in height in soils in this landform (Table 6).
The XRD study was carried out to determine the primary mineral types and abundance degrees of soils of periglacial landforms, and Figure 11 shows the diffractoms of minerals. According to the order of abundance of minerals, quartz, muscovite, and albite were found in soils in stony earth circles, while quartz, muscovite, orthoclase, and albite were determined as primary minerals in soils belonging to thufur landforms. While quartz, muscovite, albite, clinochlore, and actinolite minerals were observed as primary minerals in soil samples of the congeliturbation deposit, quartz, muscovite, clinochlore, and albite were determined as primary minerals in soil samples of the mud circle. Moreover, quartz, muscovite, albite, and clinochlore were found in the soil samples of non-sorted steps.
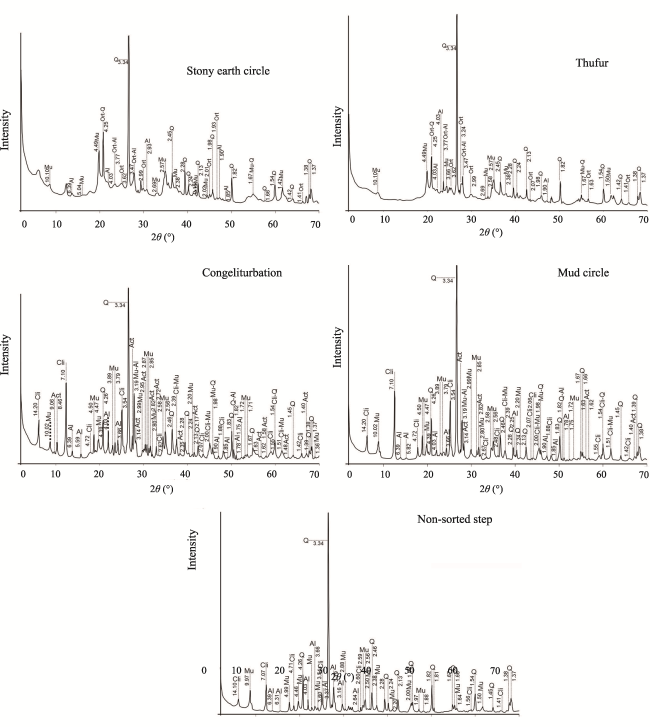
Figure 11 X-ray diffractions of primary minerals of soils

(Q: Quartz, Mu: Muscovite, Avg: Orthoclas, Al: Albit, Cli: Clinochlor; Act: Actinolite)

Furthermore, the XRD study was conducted to determine clay mineral types and abundance degrees of soils belonging to periglacial landforms. The XRD basal distances of clay minerals and diffractoms of clay minerals are shown in Figure 12, and SEM images are presented in
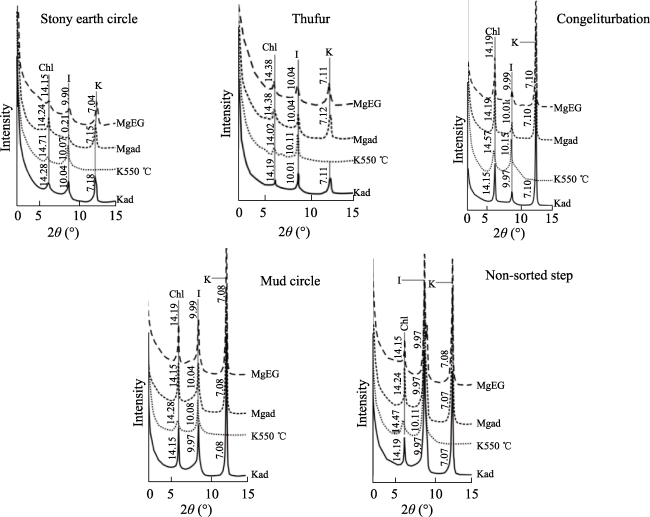
Figure 12 Clay fraction X-ray diffraction of the soil samples
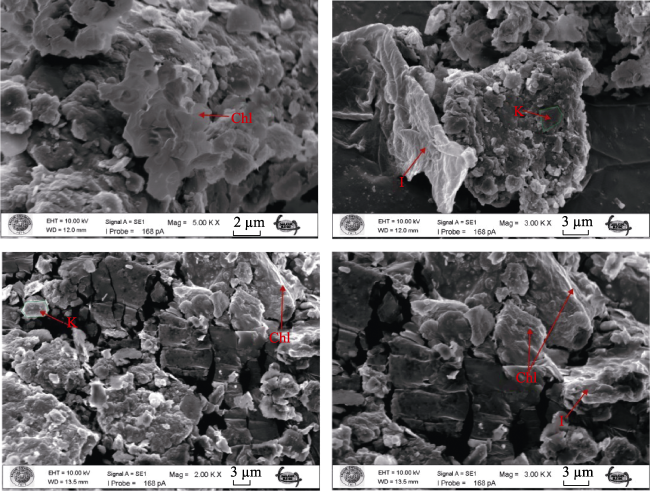
Figure 13 Sem images of the soil samples, advanced Kaolinite (K), Illite (I) and Chlorite (Chl)

4 Discussion

4.1 General characteristics of periglacial landforms

Non-sorted steps on the Ilgaz Mountains are located in the south of Küçükçal Hill and Büyükhacet Hill, in the north of Küçükhacet Hill, and in the west of Kavşakbaşı Hill. Non-sorted steps generally developed on limestone, sandstone, marl, and carbonate sandstone. Non-sorted steps extend between the elevations of 1943 m a.s.l. and 2395 m a.s.l., and mostly in the northwest, southeast, and southwest directions. Reactions of non-sorted step soils vary between slightly acidic and slightly alkaline. Organic matter content varies significantly. A decreasing trend in soil organic matter was observed with the increased elevation. This results from both the effect of eluviation and carbonate production and chemical properties of the bedrock (sandstone and limestone). The results for organic matter content are similar to other studies. For example, Türkeş et al. (2023) determined the organic matter content to be between 0.3% and 30% in their study carried out on Mount Ida (Kaz Dağı). Additionally, Dede et al. (2021) indicated that with an increase in elevation, there was a significant decrease in the accumulation of organic matter, in particular, due to a decrease in bio-chemical reaction, as well as geo-physico-chemical reaction.
Stony earth circles in the Ilgaz Mountains are the most common periglacial landforms after non-sorted steps. Stony earth circles are located in less sloping areas on the summit plains. They are generally observed in the west of Küçükçal Hill and in the south of Küçükhacet Hill and Büyükhacet Hill. Stony earth circles spread between the elevations of 2089 m a.s.l. and 2380 m a.s.l. The variation of the organic matter content of stony earth circle soils is similar to soils formed on non-sorted steps. Especially the decomposition of organic matter caused a significant difference due to variations in temperature degrees for each elevation. Kızılkaya et al. (2019) reported that dehydrogenase enzyme activity, which is an important indicator for microbial activity in soils formed on garland and stone cluster periglacial landforms decreased with increasing elevation.
In the Ilgaz Mountains, mud circles are less common than stony earth circles and non-sorted steps. They are observed on the summit plains between the elevations of 2016 m a.s.l. and 2323 m a.s.l. Mud circles are observed in the west of Küçükçal Hill and in the south of Büyükhacet Hill. Mud circles look more circular in the west of Küçükçal Hill (Figure 14). Considering soil reaction, significant changes were found, especially due to accumulation or transport-leaching process. The soils in mud circles have strong to slightly acidic reactions due to the leaching process and are located on sandstone including low basic cations. The results were compatible with the data obtained from Ilgar Mountains (pH 4.51-5.52). According to Serin (2019), in the analysis results of soil samples taken from periglacial landforms, it was found that pH values were between 5.70 and 7.65, and EC values were between 0.06 and 0.24 dS/m. It was stated that washing or leaching processes in the field were effective.
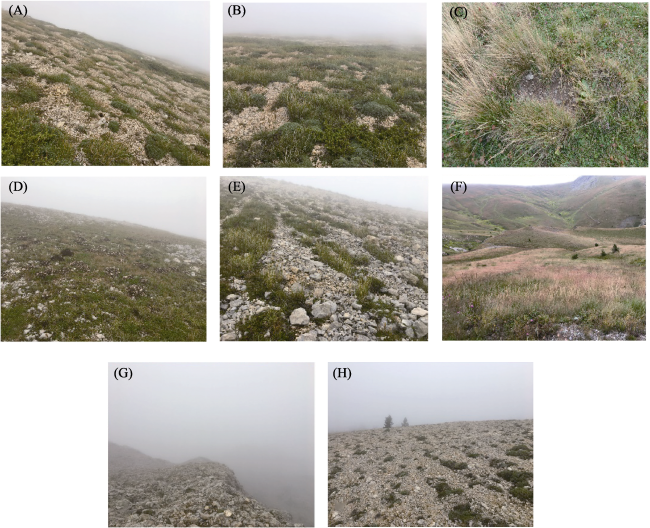
Figure 14 General view of periglacial landforms in Ilgaz Mountains (A: Non-sorted step, B: Stony earth circle, C: Mud circle, D: Thufur, E: Non-sorted stripe, F: Congeliturbation, G: Peaksbelt, H: Blockfield)
Thufur, which was determined by fieldworks, is located between the elevations of 2092 m a.s.l. and 2398 m a.s.l. in Büyükhacet Hill on the summit plains. The reactions of soils in thufur vary between slightly acidic and slightly alkaline (6.6-7.7). When compared to other soils formed on different landforms in the study area, the highest lime content (CaCO3) was determined in soils formed on thufur periglacial landforms and varies between 2.81% and 32.08%. This case can be explained by the fact that this type of landform is generally formed on limestone and marl rocks which include a high amount of basic cations against the leaching process. The texture properties of soils differ in the texture classes of loam and clay loam.
Congeliturbation deposits spread between the elevations of 2068 m a.s.l. and 2215 m a.s.l. They are located on the southern and northern slopes of Büyükhacet Hill and Küçükhacet Hill. In the soils of congeliturbation deposits, pH values do not change significantly, which can be called an acid reaction (4.80 and 4.95), due to the low lime content and leaching process. Therefore, it can be concluded that leaching processes are effective in cold climate regions in the Ilgaz Mountains. It is well known that there is a positive correlation between organic matter content and microorganisms. This case was already mentioned in the paragraph about stony earth circles by considering the study by Kızılkaya et al. (2019). In addition, according to Kokelj et al. (2002), the organic matter content in the permafrost active layer decreased from the surface (3%-5%). Similar results were obtained for congeliturbation deposits, and OM values were between 4.5% and 5.4%.
The correlation analysis was conducted on Küçükçal Hill, Büyükhacet Hill, and Küçükhacet Hill in the Ilgaz Mountains. In the vicinity of Küçükçal Hill, a very high significant positive correlation was identified between the width and length of stony earth circles. Moreover, a very high positive correlation was found between the width and length of stony earth circles measured in the Büyükhacet Hill summit zone. The same high correlations were detected by Türkeş et al. (2023) in Mount Ida (Kaz Dağı). Moreover, very high positive correlations were also detected between the length and width of thufur, while a very high correlation was found between the width and height of thufur located on Küçükhacet Hill.
Uxa et al. (2017) evaluated the relationship between the morphology of the northern Billefjorden area patterned soils in Svalbard and altitude. As a result of the study, r=0.50 for length data and r=0.53 for width data were obtained for the measurement results of the parameters acquired from the landforms. In the Ilgaz Mountains, results were obtained between R2=0.79 for the length and width relationship of stony earth circle landforms, and R2=0.45-0.79 for the length-width-elevation relationship of mud circle landforms. Türkeş and Öztürk (2011) and Öztürk (2012) analyzed the morphometry of periglacial landforms statistically in their studies in Uludağ (2543 m a.s.l.). Positive relationships at the level of r=0.666 were found between the length and width parameters of non-sorted step landforms. On the other hand, positive significant relationships were found at the r=0.543 level between plant height and slope, a different parameter. In the current study, in which the periglacial geomorphology of Mount Honaz (2543 m a.s.l.) was explained by Serin (2019), it was stated that there were length-width-height relationships in mud circle landforms and positive and negative relationships between R2=0.30-0.60. For stony earth circle landforms, positive and negative correlations were found between R2=0.17-0.46. The results of scientific studies carried out in the Anatolian Mountains are similar to the results obtained from the Ilgaz Mountains in the province, indicating that periglacial processes are similar for the Anatolian Mountains, but the local-scale periglacial processes and landforms may yield results worth investigating due to topographical differences. Uxa and Mida (2017) and Uxa et al. (2017) reported that patterned soils in periglacial regions generally have significantly smaller horizontal dimensions than lower elevations, with increasing elevation. In the Ilgaz Mountains, a negative correlation (r=-0.012/-0.278) between the length parameters of stony earth circle landforms and elevation and a negative correlation (r=-0.046/-0.605) between the width and elevation were determined. It was also found that mud circle landforms and length and width parameters, respectively, were negatively correlated with altitude (r=-0.556/-0.765; -r=0.074/-0.677). Hjort and Luoto (2009) stated that the effect of vegetation was important in the characterization of periglacial regions and the development of landforms. They emphasized that vegetation was one of the most important variables affecting cryoturbation structures on the geomorphological development of cryoturbation structures. Under the predicted global warming, the ‘greening’ of arctic and subarctic regions may, therefore, decrease and also increase the activity of periglacial processes on sparsely vegetated terrain. Likewise, the fact that cryoturbation structures detected on the Ilgaz Mountains are covered with dense alpine plants affects the OM values (5.07%). It is thought that vegetation affects soil moisture and the continuity of active processes in these structures.

4.2 The physicochemical and mineralogical properties of soils in periglacial landforms

The physicochemical and mineralogical properties shaping the pedological development of soils differ as a result of dynamic interactions between natural environmental factors (landform, elevation, slope, climate, parent material, vegetation, etc.), particularly in local areas. The basic cation contents of soils belonging to periglacial landforms vary depending on the chemical composition of the rock, which is the source of ions, and the rate of eluviation in the soil due to precipitation. However, it has been revealed that the dominant cation in all periglacial landforms is calcium ion. Moreover, pH values and lime contents of soils belonging to periglacial landforms also vary substantially depending on the change in the amount of binding of basic cations in soil colloids as a result of the events mentioned above. While the reaction in soils in stony earth circles, thufur, and mud circles was, in general, slightly alkaline (pH>7.0), the soil samples of non-sorted steps and congeliturbation deposits were found to have an acidic reaction. The degree of weathering of rocks also influences the texture properties of soils, which are composed of clay, silt, and sand mixtures. In rocks such as granite and sandstone, which are less resistant to weathering due to their mineralogical composition, soils form coarse textures such as loam and sandy loam, as in non-sorted steps and stony earth circles, whereas soils have moderate textures such as loam and clay loam, as in stony earth circles and mud circles located on rocks such as marble, schist, and phyllite that are relatively more resistant to weathering. Organic matter contents of soils belonging to periglacial landforms were found to decrease with the increasing height. The reason for this is the decrease in microorganism activities and, thus, the decreased decomposition of organic matter as a result of the decrease in temperature against the increase in precipitation. Kızılkaya et al. (2019) investigated the dehydrogenase enzyme activities, a significant indicator of microorganism activities, in samples taken from soils in non-sorted steps and thufur from periglacial landforms and observed a decrease with the increase in height. Aggregate stability is a significant factor in both the structural development of soils and their resistance to erosion (Celilov and Dengiz, 2019). Aggregate stability values of soils in stony earth circles and non-sorted steps were close to those of thufur and lower than those of other landforms. Furthermore, a decreasing trend is observed in the aggregate stability values with the increasing height of circles. This suggests that the decrease in organic matter and partially in the amount of clay occurs with the increase in height, and temperature changes result from the inhibition of aggregate formation as the height increases.
Determining the primary minerals of soils and the clay mineralogy class contributes significantly to interpreting the physical, chemical, and even biological properties of soils and predicting and interpreting soil behavior and formations. However, the behavior of the dominant clay minerals should be considered together with the type and ratio of the clay fraction (Gürsoy and Dengiz, 2018). Quartz and muscovite are very common, rock-forming minerals among the primary minerals of soils belonging to periglacial landforms spread in the study area. They are the characteristic minerals of granite and pegmatites associated with granites and are also abundantly observed in schists and gneisses. Moreover, they are present in contact metamorphic and crystallized limestones. There is also glaucophane schist cleavage merged with the Çangal metaophiolite and metaepiophiolitic cover outcropping in the Ilgaz Mountains, the study area. The Çangal formation was affected by metamorphism during the Lower-Middle-Jurassic period, like the Daday-Devrakani metasedimentary group in the north of the region. The Çangal metaophiolite was cut by the Asarcık diorite with a hot contact. It is reported that the settlement occurred before the Middle Jurassic Period (165 Ma with K-Ar) (Boztuğ and Yılmaz, 1995). The Çangal metaophiolite metaultramaphite consists of two primary groups: a) rocks in serpentinite and anthophyllite schist composition, b) metagabbro, metadibase, metaspilite, and metaporphyry rocks (Yılmaz, 1983). In the first group, the mineral is in the composition of serpentinite, chlorite, actinolite, calcite, and talc. Sampling area 9 is probably included in the first group within the Çangal metaophiolite. In the rocks constituting the second group, the mineral paragenesis is stated as albite, quartz, actinolite, and Fe-Mg chlorite (Boztuğ and Yılmaz, 1995). Other samples probably fall into the second group.
Chlorite mineral has been found as the common clay mineral of soils belonging to periglacial landforms. Chlorite mineral is not affected by all saturation and dissolution applications (Çelik Karakaya, 2006); it is important for identifying the peak at approximately 14 Å (001) and 7 Å (002). Chlorite develops as the weathering product of primary minerals and replaces other clay minerals at the later stages of diagenesis, especially when it reaches metamorphism (Selley, 1978). Chlorites are mostly minerals formed by metamorphism in green facies of iron and magnesium-rich plutonic rocks. 9.90-10.21Å (001) belongs to illite in all applications. Illite (Gaudette et al., 1966), a term used for clay at 10 Å that do not expand, has muscovite on one side and pyrophyllite on the other (Çelik Karakaya, 2006). It contains more Si, Mg, and H2O than muscovite, less tetrahedral Al and less K between layers (Çelik Karakaya, 2006; Hower and Mowatt, 1966). The peaks observed in the range of 7.04-7.12 Å (001) in samples saturated with Mg, MeEG, and K disappeared when heated at 550oC, which shows that these peaks belong to the kaolinite mineral. If hydroxyls are fully lost due to dehydration when heated, the structure deteriorates, and this is typical for kaolins (Çelik Karakaya, 2006; Wilson, 1987). Peaks are divided into five classes according to intensity. In the samples belonging to stony earth circle and thufur landforms, chlorite is of low intensity (110-360 intensity sec-1), whereas illite and kaolinite are classified in the medium intensity class (360-1120 intensity sec-1) in this classification. Chlorite mineral is poorly developed and not good crystalline in soil samples belonging to stony earth circle and thufur landforms. In the samples mentioned, the order of dominance was kaolinite, illite, and chlorite. Chlorite was the dominant clay mineral in the soil sample of the congeliturbation deposit, followed by kaolinite and illite. In this periglacial landform, chlorite and kaolinite were of medium intensity, whereas illite was classified in the low-intensity class. The order of dominance of clay mineral samples belonging to mud circles was kaolinite (high intensity), illite and chlorite (medium intensity). In the samples belonging to non-sorted steps, illite (very high intensity), kaolinite (high intensity), and chlorite (medium intensity) were dominant, respectively. The effects of metamorphism and soil formation processes changed the order in the samples but not clay mineral types.

5 Conclusions

The periglacial landforms in the Ilgaz Mountains spread between the elevations of 1943 m a.s.l. and 2398 m a.s.l. Periglacial landforms developed over Paleozoic-aged carbonate sandstone, limestone, marl, and sandstone. The slope values in the areas where periglacial landforms spread vary between 30 and 40 percent. The elevation and parent material play an important role in the development of periglacial landforms in the Ilgaz Mountains.
Periglacial landforms, especially in local areas, significantly affect and contribute to the acquisition of different characteristics in the soils formed on characteristic landforms as a result of formation phases. One hundred twenty-three periglacial landform measurements were performed in the Ilgaz Mountains. For stony earth circle landforms in the vicinity of Küçükçal Hill, a very high positive correlation was determined at the level of r=0.889 in the length-width parameters. For mud circle landforms, the length-width relationship was found to be very high at the r=0.865 level. In stony earth circle landforms formed around Büyükhacet Hill, there was a positive significance at the r=0.892 level in the length-width parameters. For mud circle landforms formed in this area, a positive correlation was found between the length and width at the level of r=0.881, between the length elevation at the level of r=0.765 and between the width elevation at the level of r=0.677. Another significant result was determined for thufur landforms formed around Büyükhacet Hill. Therefore, the following positive directional results were found: r=0.904 between the length and the width, r=0.860 between the length and the height, and r=0.909 between the width and the height.
Twenty-seven soil samples were obtained from the periglacial landforms on the Ilgaz Mountains, and soils with the coarsest textures (loam, sandy loam) were determined in mud circles, whereas soils with the highest clay ratio were non-sorted steps. Organic matter tended to decrease with the increasing height in all periglacial landforms. Congeliturbation deposits and mud circles, where the lowest pH values were obtained, have strong acidic reactions. However, the soils formed on non-sorted steps have neutral or slightly alkaline reactions. While quartz and muscovite were primary minerals, chlorite was the clay mineral in soils of all landforms. Soils in periglacial landforms spread in the study area are at the initial stages of pedological development and do not have subsurface diagnostic horizons. Therefore, these soils were described as young and included in the Entisol order in the soil classification.

Acknowledgment

The authors sincerely thank Ardahan University, Scientific Research Projects Coordinatorship, which supported the study with the project numbered 2019-001, Utku Danış, the Ilgaz Forestry Operations Manager, and İlyas Hazar, a resident in Yukarı Berçin village in Tosya-Türkiye.
[1]
Abakumov E, Polyakov V, Kushnov I et al., 2021. Geochemical and microbiological features of cryoconite, sampled from glaciers of the Central Caucasus region (Kabardino-Balkarian Republic, Russia). In: BIO Web of Conferences (Vol. 35). EDP Sciences.

[2]
Altın T, 2006. Periglacial geomorphological landforms on Aladağ and Bolkar Mountains. Turkish Geographical Review, 46: 105-122.

[3]
Ardos M, 1977. Geomorphology of southern of Lake Eğirdir and Pleistocene glaciation on Davras Mountain. Review of the Geographical Institute University of Istanbul, 22: 99-118.

[4]
Barrows T T, Stone J O, Fifield L K, 2004. Exposure ages for Pleistocene periglacial deposits in Australia. Quaternary Science Reviews, 23: 697-708.

DOI

[5]
Bateman M D, Hitchens S, Murton J B et al., 2014. The evolution of periglacial patterned ground in East Anglia, UK. Journal of Quaternary Science, 29(4): 301-317.

DOI

[6]
Beret B, 1956. Glacial traces on Mount Çakırgöl. Turkish Geographical Review, 15/16: 115-125.

[7]
Bilgin T, 1969. Glacial and Periglacial Topographical Landforms on Mount Gâvur. Publications of Istanbul University, 1494.

[8]
Blacke G R, Hartge K H, 1986. Bulk density. In: Klute A (ed). Methods of Soil Analysis (Part 1): Physical and Mineralogical Methods. 2nd ed. Agronomy, Vol, 9: 363-382.

[9]
Bouyoucos G J, 1951. A recalibration of the hydrometer method for making mechanical analysis of soils. Agronomy Journal, 43: 435-438.

[10]
Boztuğ D, Yılmaz O, 1995. Metamorphism and geological evolution of the Daday-Devrekani massif, Kastamonu region, western Pontides, northern Turkey. Geological Bulletin of Turkey, 38(1): 33-52.

[11]
Çelik Karakaya M, 2006. Properties and Identification Methods of Clay Minerals. Ankara.

[12]
Celilov C, Dengiz O, 2019. Determination of the spatial distribution for erodibility parameters using different interpolation methods: Ilgaz National Park Soils, Turkey. Turkish Journal of Agricultural Research, 6(3): 242-256.

[13]
Colucci R R, Boccali C, Zebre M et al., 2016. Rock glaciers, protalus ramparts and pronival ramparts in the south-eastern Alps. Geomorphology, 269: 112-121.

DOI

[14]
Dede V, Çiçek İ, Uncu L, 2015. Formations of rock glacier in Karçal Mountains. Bull. Earth Sci. Appl. Res. Centre Hacettepe University, 36(2): 61-80.

[15]
Dede V, Dengiz O, Demirağ Turan İ et al., 2020. Determination of some relationships between soil erodibility properties and physicochemical of soils formed on various periglacial landforms in Ilgaz Mountains. Turkish Journal of Geographical Sciences, 18(1): 99-123.

[16]
Dede V, Dengiz O, Zorlu B Ş et al., 2021. The effect of temperature change due to elevation on soil properties in periglacial landforms in Ilgaz Mountains. Turkish Geographical Review, 78: 23-32.

[17]
Dengiz O, 2020. Soil quality index for paddy fields based on standard scoring functions and weight allocation method. Archives of Agronomy and Soil Science, 66(3): 301-315.

DOI

[18]
Dengiz O, Başkan O, 2010. Characterization of soil profile development on different landscape in semi-arid region of Turkey: A case study; Ankara-Soğulca catchment. Journal of Anatolian Agricultural Sciences, 25(2): 106-112.

[19]
Dengiz O, Şenol H, 2018. Effect of toposequences on geochemical mass balance and clay mineral formation in soils developed on basalt parent material under subhumid climate condition. Indian Journal of Geo-Marine Science, 47(9): 1809-1820.

[20]
Drewes J, Moreiras S, Korup O, 2018. Permafrost activity and atmospheric warming in the Argentinian Andes. Geomorphology, 323: 13-24.

DOI

[21]
Erinç S, 1949. Glacial morphology researches on Uludağ. Turkish Geographical Review, 11/12: 79-94.

[22]
Erinç S, 1965. A research on the impacts of precipitation and a new index[D]. İstanbul: İstanbul University.

[23]
Erinç S, Bilgin T, Bener M, 1961. Periglacial landforms on Ilgaz Mountains. Review of the Geographical Institute University of Istanbul, 12: 90-99.

[24]
Gaudette H E, Eades J L, Grim R E, 1966. The nature of illite. Clays Clay Min., 13: 33-48.

[25]
Gee G W, Bauder J W, 1986. Particle size analysis. In: Klute A (ed). Methods of Soil Analysis (Part 1): Physical and Mineralogical Methods. 2nd ed. Agronomy Vol.9, American Society of Agronomy, Madison, WI, 383-411.

[26]
Grab S, 2002. Glacial and periglacial phenomena in Ethiopia: A review. Permafrost and Periglacial Processes, 13(1): 71-76.

DOI

[27]
Gürsoy F E, Dengiz O, 2018. Morphology, minerology properties and classification of vertisols formed on two different parent material. Anadolu Journal of Agricultural Sciences, 33: 162-169.

[28]
Hagg W, Mayer C, Mayr E et al., 2012. Climate and glacier fluctuations in the Bavarian Alps in the past 120 years. Erdkunde, 66(2): 121-142.

[29]
Hjort J, Luoto M, 2009. Interaction of geomorphic and ecologic features across altitudinal zones in a subarctic landscape. Geomorphology, 112(3/4): 324-333.

DOI

[30]
Hughes P D, 2018. Little Ice Age glaciers and climate in the Mediterranean Mountains: A new analysis. Cuadernos de Investigación Geográfica, 44: 15-46.

DOI

[31]
Kahraman N, 2015. Glacial traces on Mount Mescit. The Journal of Academic Social Science Studies (JASSS), 34: 41-51.

[32]
Kemper W D, Rosenau R C, 1986. Aggregate stability and size distribution.In: Klute A (ed.). Methods of Soil Analysis (Part I): Physical and Mineralogical Methods. 2nd ed. SSSA Book Series No.5, SSA and ASA, Madison, Wisconsin, 425-442.

[33]
Kızılkaya R, Dede V, Dengiz O et al., 2019. Effect of soil properties formed on various periglacial landforms in Ilgaz Mountain on dehydrogenase enzyme activity. Soil Science Society of Turkey, 7(2): 121-127.

[34]
Knight J, Harrison S, Jones D B, 2019. Rock glaciers and the geomorphological evolution of deglacierizing mountains. Geomorphology, 324: 14-24.

DOI

[35]
Kokelj S V, Smith, C A S, Burn C R, 2002. Physical and chemical characteristics of the active layer and permafrost, Herschel Island, western Arctic Coast, Canada. Permafrost and Periglacial Processes, 13(2): 171-185.

DOI

[36]
Kutiel H, Türkeş M, 2005. New evidence about the role of the North Sea-Caspian Pattern (NCP) on the temperature and precipitation regimes in continental central Turkey. Geografiska Annaler: Series A, Physical Geography, 87: 501-513.

[37]
Lozinski W von, 1909. Über die mechanische Vermitterung der Sandsteine im gemassigten klima. Bulletin International de I’Academie des Sciences de Cracovie class des Sciences Mathematique et Naturalles, 1: 1-25.

[38]
Mulla D, McBratney A, Summer M, 2000. Handbook of Soil Science. Properties and Processes. 2nd ed.

[39]
Nelson D W, Sommers L E, 1982. Total Carbon, Organic Carbon and Organic Matter. In: Page L A, Miller R H, Keeney D R (eds.). Methods of Soil Analysis (Part 2): Chemical and Microbiological Methods. 2nd ed. Madison, WI: American Society of Agronomy, 539-579.

[40]
Oliva M, Sarıkaya M A, Hughes P, 2020. Holocene and earlier glaciations in the Mediterranean Mountains. Mediterranean Geoscience Reviews, 2: 1-4.

DOI

[41]
Oliva M, Serrano E, Gomez-Ortiz A et al., 2016. Spatial and temporal variability of periglaciation of the Iberian Peninsula. Quaternary Science Reviews, 137: 176-199.

DOI

[42]
Oliva M, Zebre M, Guglielmin M et al., 2018. Permafrost conditions in the Mediterranean region since the Last Glaciation. Earth-Science Reviews, 185: 397-436.

DOI

[43]
Öztürk M Z, 2012. Investigation of Periglacial Processes, Periglacial Landforms and Associated Control Factors over Uludağ. Publications of Nilüfer Akkılıç Library, 10.

[44]
Philip G M, Watson D F, 1982. A precise method for determining contoured surfaces. Journal of the Australian Petroleum Production & Exploration Association (APPEA), 22: 205-212.

[45]
Planhol X, de Bilgin T, 1961. Pleistocene and actual glaciation with periglacial landforms on Karagöl Mass. Review of the Geographical Institute University of Istanbul, 12: 127-146.

[46]
Růžička V, Zacharda M, Němcová L et al., 2012. Periglacial microclimate in low-altitude scree slopes supports relict biodiversity. Journal of Natural History, 46(35/36): 2145-2157.

DOI

[47]
Sarıkaya M A, Çiner A, 2015. Late Pleistocene glaciations and paleoclimate of Turkey. Bulletin of the Mineral Research and Exploration, 151: 107-127.

[48]
Sarıkaya M A, Tekeli A E, 2014. Satellite Inventory of Glaciers in Turkey. In: In: Kargel J S, Leonard G J, Bishop M P (eds.). Global Land Ice Measurements from Space. Berlin Heidelberg: Praxis-Springer (Publisher), 465-480: 876.

[49]
Sarıkaya M A, 2009. Late Quaternary glaciation and paleoclimate of turkey inferred from cosmogenic 36Cl dating of moraines and glacier modeling[D]. Tucson, AZ, USA: University of Arizona.

[50]
Sayhan H, 1999. The genetic and morphometric analysis of Thufurs to development connected with the actual morphodynamic at the eastern of Mount Erciyes. Turkish Geographical Review, 34: 141-165.

[51]
Seligman Z M, Klene A E, Nelson F E, 2019. Rock glaciers of the Beartooth and northern Absaroka ranges, Montana, USA. Permafrost and Periglacial Processes, 30: 1-11.

DOI

[52]
Selley RC, 1978. Ancient Sedimentary Environments. London: Chapman and Hall, 287 s.

[53]
Serin S, 2019. Periglacial geomorphology of Mount Honaz (Denizli)[D]. Turkey: Bilecik Şeyh Edebali University, Institute of Social Sciences.

[54]
Soil Survey Laboratory, 1992. Procedures for Collecting Soil Samples and Methods of Analysis for Soil Survey. Soil Surv. Invest. Rep. I. U.S. Gov. Print. Office, Washington D.C. USA.

[55]
Soil Survey Staff, 1993. Soil Survey Manuel. USDA Handbook, No.18, Washington D.C. USA.

[56]
Soto A V, Alberti A P, 2019. Periglacial deposits as indicators of paleotemperatures. A case study in the Iberian Peninsula: The mountains of Galicia. Permafrost and Periglacial Processes, 29: 1-15.

DOI

[57]
Spreitzer H, 1958. Frührezente und rezente Hochstande der Gletscher des Kilikischen Ala Dag im Taurus. Geographische Forschungen, 60, Innsbruck.

[58]
Tunçay T, Dengiz O, İmamoğlu A, 2020. Influence of toposequence on physical and mineralogical properties of soils developed on basaltic parent material under sub-humid terrestrial ecosystem. Journal of Agricultural Sciences, 26: 104-116.

[59]
Türkeş M, 2020. Climate and Drought in Turkey. In: Harmancıoğlu N B, Altınbilek D (eds). Water Resources of Turkey, World Water Resources 2. Switzerland: Springer, 85-125.

[60]
Türkeş M, Dede V, Dengiz O et al., 2023. Periglacial landforms and soil formation on summit of the Mount lda (Kaz Dağı), Biga Peninsula-Turkey. Physical Geography, 44(5): 531-580. https://doi.org/10.1080/02723646.2022.2091312.

DOI

[61]
Türkeş M, Öztürk M Z, 2011. Non-sorted step and mud circle formations on Uludağ. Turkish Journal of Geographical Sciences, 9(2): 239-257.

[62]
Uğuz M F, Sevin M, 2011. Geological Maps of Turkey Scaled of 1/100.000, Kastamonu F-31 Sheet. General Directorate of Mineral Research and Exploration, 145.

[63]
UNEP, 1993. World Atlas of Desertification. London: The United Nations Environment Programme (UNEP).

[64]
Uxa T, Mida P, 2017. Rock glaciers in the Western and High Tatra Mountains, Western Carpathians. Journal of Maps, 13: 844-857.

DOI

[65]
Uxa T, Mida P, Krizek M, 2017. Effect of climate on morphology and development of sorted circles and polygons. Permafrost and Periglacial Processes, 28: 663-674.

DOI

[66]
Vandenberghe J, Renssen H, Roche D M et al., 2012. Eurasian permafrost instability constrained by reduced sea-ice cover. Quaternary Science Reviews, 34: 16-23.

DOI

[67]
Watson D F, Philip G M, 1985. A refnement of inverse distance weighted interpolation. Geoprocessing, 2: 315-327.

[68]
Whittig L D, Allardice W R, 1986. X-ray diffraction techniques. In: Klute A (ed.). Methods of Soil Analysis (Part 1): Physical and Mineralogical Methods. 2nd ed. ASA Publication 9. Madison, Wisconsin, 55-86.

[69]
Willmott C J, 1977. Watbug: A Fortran IV Algorithm for calculating the climatic water budget[D]. Delaware: University of Delaware.

[70]
Wilson M J, 1987. X-ray powder diffraction methods. In: Wilson M J (ed.). A Handbook of Determinative Methods in Clay Mineralogy. Glasgow and London: Blackie & Sons, 2698pp.

[71]
Wolter J, Lantuit H, Wetterich S, et al., 2018. Climatic, geomorphologic and hydrologic perturbations as drivers for mid- to late Holocene development of ice-wedge polygons in the western Canadian Arctic. Permafrost and Periglacial Processes, 29(3): 1-18.

DOI

[72]
Yılmaz O, 1983. Mineralogical petrographic investigation of Çangal metaophiolite and metamorphism conditions. Geosciences, 10: 45-58.

DOI

[73]
Zganiacz J P, Dzieduszynska D A, 2017. Palaeoenvironmental proxies for permafrost presence during the Younger Dryas, Central Poland. Permafrost and Periglacial Processes, 28: 726-740.

DOI

[74]
Zhou H, Chen Y, Li W, 2010. Soil properties and their spatial pattern in an oasis on thelower reaches of the Tarim River, northwest China. Agric. Water Manage., 97: 1915-1922.

Outlines

/