
Journal of Geographical Sciences >
Impact of the Grain-for-Green Programme and climate change on the soil erosion decline in the Yangtze River, China
|
Li Boyan, Associate Professor, specialized in ecohydrological responses to climate change. E-mail: byli@snnu.edu.cn |
Received date: 2023-05-24
Accepted date: 2023-11-17
Online published: 2024-04-24
Supported by
National Natural Science Foundation of China(42101259)
National Natural Science Foundation of China(42371101)
National Natural Science Foundation of China(42301455)
Qin Chuangyuan Cites High-level Innovation or Entrepreneurship Talent Project(QCYRCXM-2023-066)
Fifth Batch Special Funding (Pre-Station) from China Postdoctoral Science Foundation(2023TQ0207)
Fundamental Research Funds for the Central Universities(GK202304024)
Fundamental Research Funds for the Central Universities(1110011297)
Fundamental Research Funds for the Central Universities(1112010355)
Teaching Reform Project of Shaanxi University(23GGYS-JG06)
The area of land that is affected by soil erosion in the Yangtze River has been reduced by 146,000 km2 (accounting for 27% of the entire Yangtze River) since 2000. However, the contributions of different tributaries to this soil erosion decline and the underlying causes have not been determined. Here we quantify the soil erosion decline in the Yangtze River and the impacts of the Grain-for-Green Programme (GFGP) and climate change using the RUSLE model and statistical methods. The results were as follows: (1) After the implementation of the GFGP, soil erosion decreased in ten sub-basins excluding the Dongting Lake catchment; (2) Soil erosion was mainly affected by the GFGP and the rainfall erosivity. Specifically, the contributions of the GFGP and rainfall erosivity to soil erosion decline are estimated to be 70.12% and 29.88%, respectively. (3) “Scenario #9” means the combination of slope (15°-25°) of retired farmland converted to shrub land and slope (>25°) of retired farmland converted to grassland. Considering scenario feasibility and management targets, Scenario #9 was the most appropriate land use scenario for the Yangtze River. This study offers insights into managing and reducing soil erosion in the future.
Key words: soil erosion; RUSLE model; Grain for Green Programme; climate change; Yangtze River
LI Boyan , WANG Yunchen . Impact of the Grain-for-Green Programme and climate change on the soil erosion decline in the Yangtze River, China[J]. Journal of Geographical Sciences, 2024 , 34(3) : 527 -542 . DOI: 10.1007/s11442-024-2216-0
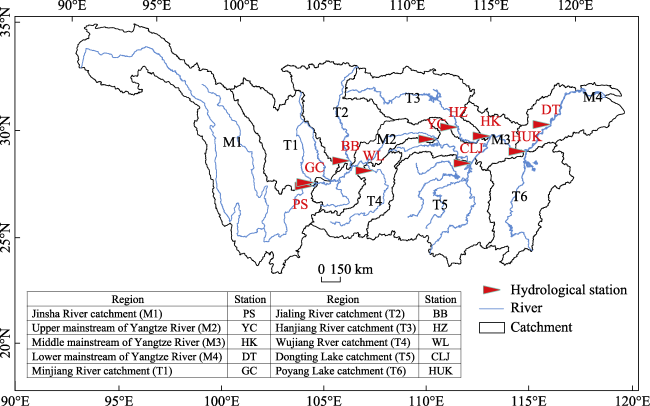
Figure 1 Yangtze River showing major sub-basins and the location of the hydrological stations |
Table 1 The criteria for soil erosion intensity |
| Levels | Average soil erosion modulus (t·ha-1·yr-1) |
|---|---|
| Low | <10 |
| Slight | 10-25 |
| Moderate | 25-50 |
| High | 50-80 |
| Severe | 80-150 |
| Extreme | ≥150 |
Table 2 Comparison of the mean annual soil erosion amount calculated and sediment load observed for the Yangtze River during two periods |
| Periods | Simulated value of soil erosion (×108 t) | Observed value of sediment load (×108 t) | Relative error (%) |
|---|---|---|---|
| Before the GFGP (2000) | 2.15 | 1.91 | 12.57 |
| After the GFGP (2010) | 0.97 | 1.12 | 13.39 |
Table 3 The potential land use scenario settings used in this study |
| Scenario sets | 15° < Slope < 25° | Slope ≥ 25° |
|---|---|---|
| Scenario 1 | Cropland | Cropland |
| Scenario 2 | Cropland | Forest |
| Scenario 3 | Cropland | Shrub |
| Scenario 4 | Cropland | Grassland |
| Scenario 5 | Forest | Forest |
| Scenario 6 | Forest | Shrub |
| Scenario 7 | Forest | Grassland |
| Scenario 8 | Shrub | Shrub |
| Scenario 9 | Shrub | Grassland |
| Scenario 10 | Grassland | Grassland |
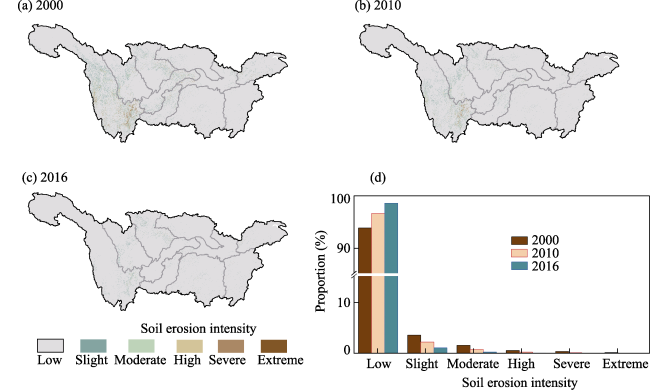
Figure 2 Spatial patterns of the soil erosion intensity in 2000 (a), 2010 (b), and 2016 (c) and comparison of the proportional change rate of the soil erosion intensity in the Yangtze River in 2000, 2010 and 2016 (d) |
Table 4 Changes in the soil erosion moduli of different regions of the Yangtze River between 2000 and 2010 and between 2010 and 2016 |
| Sub-basins | Mean soil erosion modulus (t·ha-1) | Change in soil erosion modulus (%) | |||
|---|---|---|---|---|---|
| 2000 | 2010 | 2016 | 2000-2010 | 2010-2016 | |
| M1 | 6.75 | 3.24 | 0.83 | -52.00 | -74.38 |
| M2 | 2.63 | 0.78 | 0.30 | -70.34 | -61.54 |
| M3 | 1.76 | 0.81 | 0.46 | -53.98 | -43.21 |
| M4 | 9.77 | 1.03 | 0.69 | -89.46 | -33.01 |
| T1 | 2.63 | 2.16 | 1.04 | -17.87 | -51.85 |
| T2 | 2.63 | 1.73 | 1.59 | -34.22 | -8.09 |
| T3 | 0.56 | 0.55 | 0.23 | -1.79 | -58.18 |
| T4 | 2.66 | 1.26 | 0.43 | -52.63 | -65.87 |
| T5 | 0.76 | 0.55 | 0.75 | -27.63 | 36.36 |
| T6 | 1.53 | 0.65 | 0.58 | -57.52 | -10.77 |
| The whole Yangtze River | 3.01 | 1.62 | 0.75 | -46.18 | -53.70 |
| Retired cropland | 2.41 | 1.31 | 0.65 | -45.64 | -50.38 |
| Non-retired cropland | 3.23 | 1.76 | 0.80 | -45.51 | -54.55 |
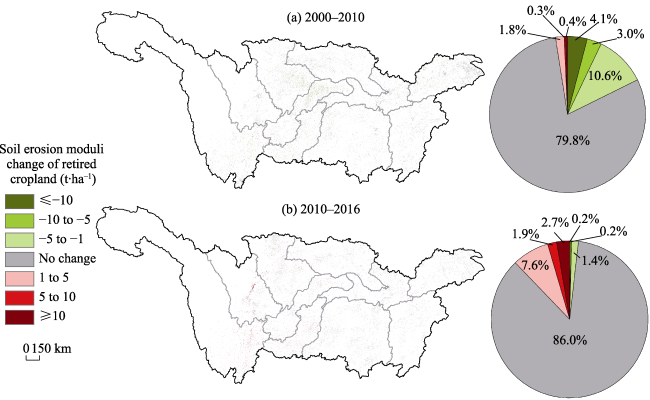
Figure 3 Changes in the soil erosion moduli of retired cropland in the Yangtze River between 2000 and 2010 (a) and between 2010 and 2016 (b) |
Table 5 Changes in soil erosion resulting from retiring cropland in the Yangtze River between 2000 and 2010 and between 2010 and 2016 |
| Type of change | 2000-2010 | 2010-2016 | ||
|---|---|---|---|---|
| Soil erosion (104 t) | Proportion1 (%) | Soil erosion (104 t) | Proportion1 (%) | |
| Cropland→Forest | -688.72 | -52.78 | -351.77 | -56.63 |
| Cropland→Shrub | -77.47 | -55.29 | -30.32 | -72.35 |
| Cropland→Grassland | -169.48 | -46.20 | -106.13 | -56.70 |
| Cropland→Water body | -19.10 | -45.12 | -50.03 | -70.79 |
| Cropland→Barren | 0.00 | -37.98 | -0.01 | -57.27 |
| Cropland→Impervious | -38.87 | -43.77 | -10.20 | -29.63 |
| Total | -993.64 | -548.46 | ||
| Mean | -46.86 | -57.23 | ||
Note: 1 Ratio of soil erosion before to after the change in land use. |
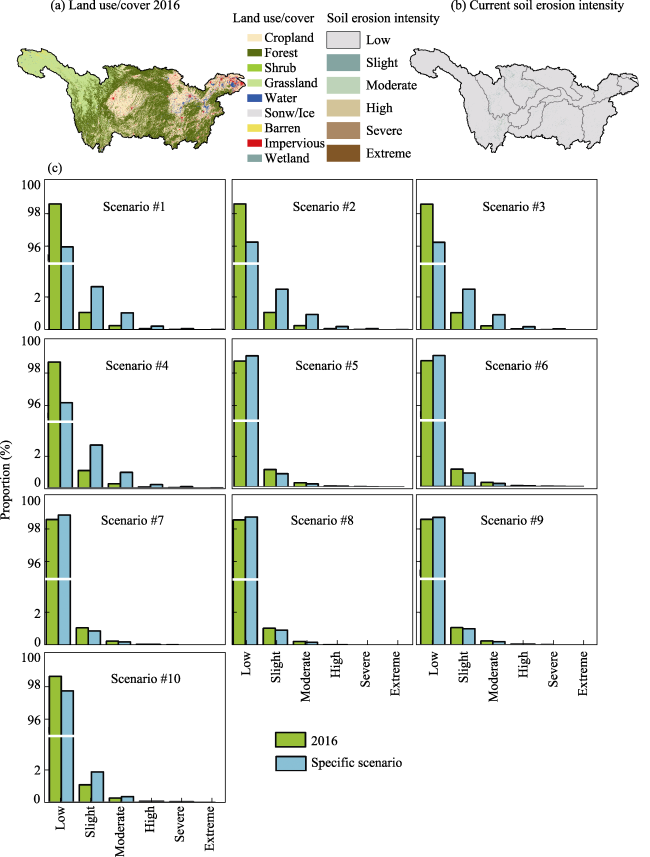
Figure 4 Comparison of the changes in the proportion of the soil erosion intensity between 2016 and the ten potential scenarios. (a) Land use/cover in 2016 on the Yangtze River; (b) The degree of soil erosion of the Yangtze River in 2016; (c) Conversion of retired cropland under the ten potential scenarios |
Table 6 Land use/cover in 2016 and five potential land use scenarios (km2) |
| Land use types | 2016 | Scenario #5 | Scenario #6 | Scenario #7 | Scenario #8 | Scenario #9 | Scenario #10 |
|---|---|---|---|---|---|---|---|
| Cropland | 516965 | 510382 | 510382 | 510382 | 510382 | 510382 | 510382 |
| Forest | 825109 | 858023 | 849618 | 849618 | 749320 | 749320 | 749320 |
| Shrub | 9721 | 8296 | 16701 | 8296 | 116999 | 108594 | 8296 |
| Grassland | 331352 | 308941 | 308941 | 317346 | 308941 | 317346 | 417644 |
| Water | 37829 | 36981 | 36981 | 36981 | 36981 | 36981 | 36981 |
| Snow/Ice | 3074 | 2557 | 2557 | 2557 | 2557 | 2557 | 2557 |
| Barren | 15061 | 14154 | 14154 | 14154 | 14154 | 14154 | 14154 |
| Impervious | 40033 | 39809 | 39809 | 39809 | 39809 | 39809 | 39809 |
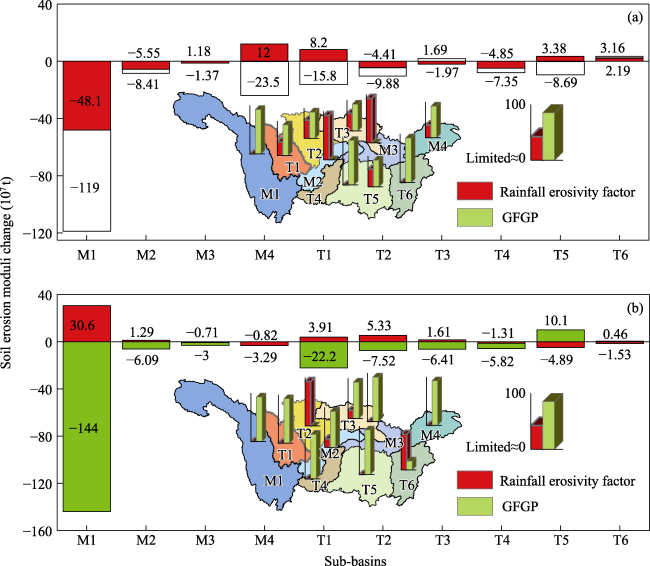
Figure 5 Changes in the GFGP and rainfall erosivity factor and their relative contributions to the change in soil erosion moduli in the ten sub-basins of the Yangtze River during the periods 2000-2010 (a), and 2010-2016 (b) |
| [1] |
|
| [2] |
|
| [3] |
|
| [4] |
|
| [5] |
|
| [6] |
|
| [7] |
|
| [8] |
|
| [9] |
|
| [10] |
|
| [11] |
|
| [12] |
|
| [13] |
|
| [14] |
|
| [15] |
|
| [16] |
|
| [17] |
|
| [18] |
|
| [19] |
|
| [20] |
|
| [21] |
|
| [22] |
|
| [23] |
|
| [24] |
|
| [25] |
|
| [26] |
|
| [27] |
|
| [28] |
|
| [29] |
|
| [30] |
|
| [31] |
|
| [32] |
|
| [33] |
|
| [34] |
|
| [35] |
|
| [36] |
|
| [37] |
|
| [38] |
|
| [39] |
|
| [40] |
|
| [41] |
|
| [42] |
|
| [43] |
|
| [44] |
|
| [45] |
|
| [46] |
|
| [47] |
|
| [48] |
|
| [49] |
|
| [50] |
|
| [51] |
|
/
| 〈 |
|
〉 |