Research Articles

Quantum harmonic oscillator model for simulation of intercity population mobility

  • HU Xu , 1 ,
  • QIAN Lingxin 1 ,
  • NIU Xiaoyu 1 ,
  • GAO Ming 1 ,
  • LUO Wen 1, 2, 3 ,
  • YUAN Linwang 1, 2, 3 ,
  • YU Zhaoyuan , 1, 2, 3, *
Expand
  • 1. School of Geography, Nanjing Normal University, Nanjing 210023, China
  • 2. Key Laboratory of Virtual Geographic Environment, Nanjing Normal University, Ministry of Education, Nanjing 210023, China
  • 3. Jiangsu Center for Collaborative Innovation in Geographical Information Resource Development and Application, Nanjing 210023, China
*Yu Zhaoyuan (1984-), PhD and Professor, specialized in geographic information system (GIS), quantum geography, and urban geography. E-mail:

Hu Xu (1997-), PhD Candidate, specialized in population mobility modeling, urban geography, and quantum models and applications. E-mail:

Received date: 2022-12-10

  Accepted date: 2023-10-23

  Online published: 2024-04-24

Supported by

National Natural Science Foundation of China(42230406)

National Natural Science Foundation of China(42130103)

National Natural Science Foundation of China(41971404)

National Natural Science Foundation of China(42201504)

Abstract

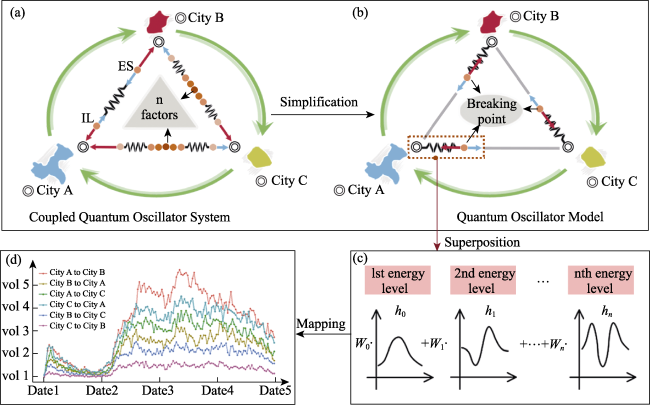
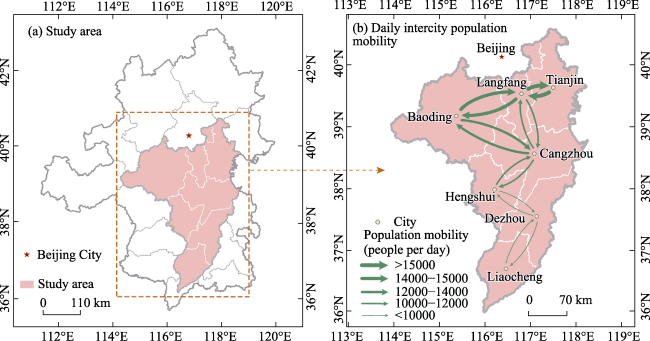
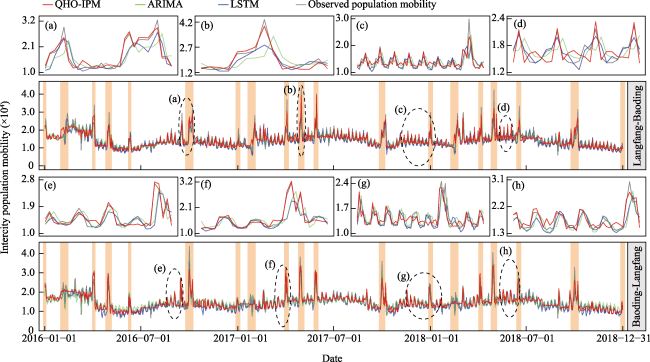
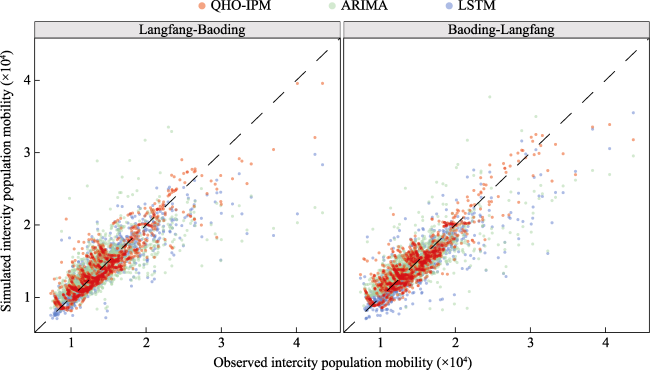
The simulation of intercity population mobility helps to deepen the understanding of intercity population mobility and its underlying laws, which has great importance for epidemic prevention and control, social management, and even urban planning. There are many factors that affect intercity population mobility, such as socioeconomic attributes, geographical distance, and industrial structure. The complexity of the coupling among these factors makes it difficult to simulate intercity population mobility. To address this issue, we propose a novel method named the quantum harmonic oscillator model for simulation of intercity population mobility (QHO-IPM). QHO-IPM describes the intercity population mobility as being affected by coupled driving factors that work as a multioscillator-coupled quantum harmonic oscillator system, which is further transformed by the oscillation process of an oscillator, namely, the breaking point of intercity population mobility. The intercity population mobility among seven cities in the Beijing-Tianjin-Hebei region and its surrounding region is taken as an example for verifying the QHO-IPM. The experimental results show that (1) compared with the reference methods (the autoregressive integrated moving average (ARIMA) and long and short-term memory (LSTM) models), the QHO-IPM achieves better simulation performance regarding intercity population mobility in terms of both overall trend and mutation. (2) The simulation error in the QHO-IPM for different-level intercity population mobility is small and stable, which illustrates the weak sensitivity of the QHO-IPM to intercity population mobility under different structures. (3) The discussion regarding the influence degree of different driving factors reveals the significant “one dominant and multiple auxiliary” factor pattern of driving factors on intercity population mobility in the study area. The proposed method has the potential to provide valuable support for understanding intercity population mobility laws and related decision-making on intercity population mobility control.

Cite this article

HU Xu , QIAN Lingxin , NIU Xiaoyu , GAO Ming , LUO Wen , YUAN Linwang , YU Zhaoyuan . Quantum harmonic oscillator model for simulation of intercity population mobility[J]. Journal of Geographical Sciences, 2024 , 34(3) : 459 -482 . DOI: 10.1007/s11442-024-2213-3

1 Introduction

Intercity population mobility is the spatial movement or geographical flow of the population distribution between cities, and it includes both long-term and short-term population transfers (Smolak et al., 2020; Shi et al., 2022). Intercity population mobility is of great importance to urban development: it facilitates social, economic, and cultural exchanges, shapes the form taken by cities, but also gives rise to traffic congestion and pollution, and fuels the spread of infectious diseases such as COVID-19 (Liu, 2018; Tan et al., 2021). Thus, simulating intercity population mobility is not only crucial to clarify the characteristics of intercity population mobility but also to understand the impact of complex factors on intercity population mobility for supporting intercity population mobility control and urban social governance (Chang et al., 2021; Wang et al., 2022).
Driven by various factors, such as socioeconomic attributes, geographical distance, and industrial structure, intercity population mobility drives population reconfiguration among cities. Whether it is the early classical population mobility theory (e.g., the classic “push- pull” theory and its extensions (Lee, 1966)), the population mobility theory of neoclassical economics (e.g., the Dual Sector theory (Lewis, 1954) and the Todaro model (Todaro, 1969)), or research on the impact mechanism of (intercity) population mobility conducted from the perspectives of economy, society, space, and environment in recent years (Shen and Shen, 2020), these theories have all emphasized the fact that various driving factors jointly contribute to intercity population mobility.
Multiple studies have emphasized the essential role and research value of the relevant driving factors by analyzing the relationship between these driving factors and intercity population mobility. The existing intercity population mobility simulation models rarely consider these driving factors. For example, the traditional mechanism-based model is generally used to construct the relationship between intercity population mobility and variables such as geographical distance and population density from the perspective of spatial interaction to simulate intercity population mobility. On the one hand, the parameter calibration of the traditional mechanism-based model is extremely complex. On the other hand, the preset empirical parameters can only be used to reconstruct the overall or average state of intercity population mobility, making it difficult to rely on the traditional mechanism-based model to simulate the finer structure of intercity population mobility, especially during special events and holidays. Another such model is the data-based model, which includes the traditional statistical model and statistical learning model. This model is a mathematical method for considering intercity population mobility and its relevant variables based on hidden information in historical intercity population mobility data. Obviously, the data-based model requires representative high-quality training data to conduct an accurate simulation. Moreover, the data-based model does not account for the influence of relevant endogenous/exogenous variables or even driving factors on intercity population mobility.
However, population mobility, especially intercity population mobility, is a complex nonlinear process of population transfer among cities that is driven by many coupled factors (Wang et al., 2019; Li et al., 2021). For example, the “push-pull” theory suggests that population mobility is the result of the comprehensive effect of intermediate barriers, personal factors, and factors that flow into and out of areas (Lee, 1966). Population theory, which is based on neoclassical economics, also emphasizes the influence of economic factors such as income inequality and employment rate on population mobility (Lewis, 1954; Todaro, 1969). In recent years, the schools of economics and behavior in the field of population mobility have worked to strengthen our understanding of the mechanism underlying the various driving factors on population mobility from the perspectives of economy, society, space, and environment (Sheng, 2018; Shen and Shen, 2020). These driving factors are related and coupled, and they are the essential reasons for intercity population mobility. Simulating intercity population mobility through the consideration of driving factors is not only conducive to developing an in-depth understanding of intercity population mobility and its laws but also helps to clarify the coupling relationship and coupling strength of the underlying driving factors to provide urban managers with reasonable and effective measures for controlling intercity population mobility. As the coupling relationship and coupling strength of driving factors cannot be directly measured, it is difficult to apply the traditional mathematical statistics method to the construction of the intercity population mobility simulation model based on each driving factor.
In this study, the quantum harmonic oscillator model is introduced to simulate intercity population mobility by regarding these driving factors as quantum oscillators. The quantum harmonic oscillator model is an extension of the classical oscillator model (Biamonte et al., 2019). The quantum harmonic oscillator model describes the dynamic evolution of a system under the action of coupled oscillators, and this evolution law can be expressed through the Schrödinger equation (Quesne, 2015). The probability-time distribution that is solved by the Schrödinger equation represents the evolution of oscillator occurrence probability over time (Hsueh et al., 2020), which can be used to describe the evolution of intercity population mobility over time under the coupling effect of time-varying driving factors. Moreover, the application of the quantum harmonic oscillator model in statistics, physics, and other related fields also provides the foundation for its application in intercity population mobility (Linke et al., 2017; Childs et al., 2018). There are two reasons for providing a reasonable and effective connection for applying the quantum harmonic oscillator model to simulate intercity population mobility from the perspective of coupled driving factors. First, in the quantum harmonic oscillator model, the coupled driving factors can be represented by the metaphor of the multioscillator system connected by virtual springs, and the coupling strength of the driving factors can be indicated by the states of these virtual springs (Hsueh et al., 2020). Second, the probability-time distribution solved by the Schrödinger equation represents the proportion of intercity population mobility (Hu et al., 2022a).
This study is aimed at constructing a quantum harmonic oscillator model for the simulation of intercity population mobility, which is abbreviated as QHO-IPM. First, the intercity population mobility affected by the coupled driving factors is abstracted as a multioscillator-coupled quantum harmonic oscillator system, which is further decoupled into a multioscillator-independent quantum harmonic oscillator system. Next, the QHO-IPM is solved by the energy level superposition principle and stereographic projection. Finally, a mapping mechanism is constructed to map the wave function to intercity population mobility. The remainder of this paper is organized as follows: Section 2 summarizes the related works on the driving factors of population mobility, the intercity population mobility simulation model, and quantum computing and its applications. Section 3 introduces the overall framework of the QHO-IPM. The overall methods are detailed in Section 4. In Section 5, a case study is presented to validate the QHO-IPM. The discussions are presented in Section 6, and conclusions are drawn in Section 7.

2 Related works

2.1 Driving factors of population mobility

The driving factors of population mobility have always been one of the key topics in the field of human geography, and they have attracted widespread attention from scholars both domestically and internationally. Early classical theories posit that uneven regional development is the main driving force behind population mobility. “The Laws of Migration” that was proposed in the late 19th century (Ravenstein, 1885), the classic “push-pull” theory (Lee, 1966), and the hypothesis of population mobility transition (Zelinsky, 1971) all emphasize the fact that regional economic development differences serve as the main driving force for population mobility. With the rapid development of neoclassical economics, population theories such as the Dual Sector theory and the Todaro model have emerged under the assumption that population mobility is affected by economic factors such as income inequality and employment rates (Lewis, 1954; Todaro, 1969). Subsequently, some scholars began to criticize the limitations of the above regional imbalance theory, which only emphasizes economic factors. These scholars hold that the influence of factors such as social networks, culture, climate, public facilities, and services is becoming increasingly important, so economic and behavioral schools of population mobility have emerged.
Therefore, many scholars have gradually begun to pay attention to the influence of factors such as economic scale, income level, employment opportunities, industrial structure, administrative division, population density, city scale, geographical distance, transportation connections, public service, and natural environment on population mobility from the perspectives of economy, society, space, and environment (Sheng, 2018; Shen and Shen, 2020). For example, Zhao et al. (2019) revealed the profound influence of economic development indicators on population mobility based on Baidu population mobility data covering the Spring Festival in 2015. Wang et al. (2012) believed that interprovincial population mobility in China is mainly influenced by macro factors such as the regional structure of the geographical environment, livability conditions, and economic differences. The per capita income of inflow areas and the population size of outflow areas are the main driving factors behind population mobility. Tang et al. (2020) used a gravity model to verify that urban characteristics, such as the time cost of population transfer, industrial structure, and cultural education, shape the pattern of intercity population mobility, and urban characteristics have a greater influence on intercity population mobility than time costs. Wang et al. (2020) analyzed the population mobility of the Yangtze River Delta urban agglomeration during the Spring Festival travel rush and daily hours and revealed the driving factors for intercity population mobility, as well as the relationships between these driving factors and intercity population mobility. Throughout the development of the early classical population mobility theory toward greater alignment with the schools of economics and behavior that has occurred in recent years, the academic community has gradually deepened its understanding of the driving factors of population mobility. Moreover, the consensus that population mobility is a spatial movement or geographical flow of population distribution under the comprehensive influence of many driving factors has been reached in the research on the evolution pattern and impact mechanism of population mobility.

2.2 The intercity population mobility simulation model

The models designed for simulating intercity population mobility can be roughly divided into two major categories: traditional mechanism-based models and data-based models. The traditional mechanism-based model simulates intercity population mobility by constructing the relationship between intercity population mobility and the relevant physical variables (e.g., geographical distance, population density, etc.) based on the physical mechanism or mathematical equation abstracted from intercity population mobility (Barbosa et al., 2018; Toch et al., 2019), such as the gravity model (Zipf, 1946), intervening opportunity model (Stouffer, 1940), radiation model (Simini et al., 2012), field model (Mazzoli et al., 2019), population weighted opportunity (PWO) model (Yan et al., 2014), and their extension models (Yan et al., 2017; Liu and Yan, 2019; Simini et al., 2021). The gravity model is a power rate model based on the assumption that the population mobility between two cities is a decreasing function of their geographical distance. The gravity model and its improved extension models are rough simplifications of intercity population mobility, but they are very sensitive to fluctuations in intercity population mobility (Simini et al., 2021). Moreover, for modern society with its extremely developed forms of transportation, the assumption that the geographical distance between two cities is the main factor affecting intercity population mobility is gradually being invalidated. The intervention opportunity model holds that in addition to the city scale and the geographical distance between the outflow city and the inflow city, the possible “intervention opportunities” between the two cities are also a key to intercity population mobility. The disadvantage of this model is that it is complex and has poor simulation and prediction performance for intercity population mobility between close cities (Liu and Yan, 2020). For situations where detailed population mobility data cannot be obtained, Simini et al. (2012) proposed the radiation model, which is a spatial distribution model for simulating population mobility that does not require calibration with observation data. This model simplifies parameter adjustment operations in modeling but weakens the description of some real intercity population mobility. In addition, some scholars have advanced a field model, which is used to abstract intercity population mobility as a vector field for describing fluid flow and applies theories such as the Gaussian divergence theorem to characterize the integrity and complexity of intercity population mobility.
Based on the above models, scholars proposed the PWO model (Yan et al., 2014), the universal opportunity (UO) model (Yan et al., 2017), and the opportunity priority selection (OPS) model (Liu and Yan, 2019). These emerging models account for both group and individual mobility patterns, transcending the classical gravity law. Most of the above models simulate (intercity) population mobility from the perspective of spatial interaction, revealing the evolution laws, spatiotemporal differentiation, and spatial dependence of (intercity) population mobility. However, these models involve complex parameter calibration, which makes it difficult to scientifically calibrate the parameters across different research objects, spatiotemporal backgrounds, and model settings. Even if some studies adopt preset empirical parameters, these models can reproduce only the overall or average state of intercity population mobility but cannot simulate the finer structures of intercity population mobility, especially when intercity population mobility is affected by special events or holidays.
Another popular data-based model, which includes the traditional statistical model and statistical learning model, has been applied to population mobility prediction (Xie et al., 2020), traffic flow estimation (Avila and Mezić, 2020), and COVID-19 prediction (Zhao et al., 2022). Usually, the traditional statistical model regards intercity population mobility as a random process and then extracts or learns structural patterns from large amounts of intercity population mobility data to simulate intercity population mobility. Due to its simplicity and high computational efficiency, the autoregressive integrated moving average (ARIMA) is widely used in simulation and prediction research on time series data such as population mobility (Ceylan, 2020). However, such models require that the population mobility data is kept at an equilibrium state or satisfies the stationarity assumption. Due to the nonstationary intercity population mobility time series, especially those affected by abnormal events or holidays, the simulation results of the traditional statistical model may have large deviations. The statistical learning model trains or infers a “black box” model to simulate intercity population mobility by continuously adjusting the parameters for processing a large amount of historical data. Time-based statistical learning models (e.g., the recurrent neural networks (RNNs), long and short-term memory (LSTM), and their extended models) and space-based statistical learning models (e.g., the convolutional neural networks (CNNs), the graph convolutional networks (GCNs), and their extended models) are typical statistical learning models (Fu et al., 2018; Zeroual et al., 2020). A statistical learning model can capture the spatiotemporal correlation characteristics of intercity population mobility and has the ability to identify the complexity and nonlinear characteristics of intercity population mobility (Zhang et al., 2018). However, the simulation performance of the statistical learning model is strongly dependent on the quality of the training data. Moreover, the overfitting, complex parameters, and difficulty of explanation also limit their applicability to the simulation of large-scale long-term intercity population mobility (Yuan et al., 2021b). In summary, both the traditional statistical and statistical learning models are data-driven simulation models for intercity population mobility that do not consider the influence of relevant endogenous/exogenous variables or even driving factors on intercity population mobility.
In addition, existing studies on population mobility simulation have mostly focused on intracity population mobility, with relatively little attention given to intercity population mobility. At the same time, existing studies on the modeling and simulation of intercity population mobility have mostly focused on short-term population mobility during leisure travel and home visits during holidays (e.g., the Spring Festival travel rush and the National Day) (Zhao et al., 2017; Zhao et al., 2019), while relevant studies on long-term intercity population mobility, including holidays and nonholidays, are relatively lacking. The multidimensional composite superposition of factors such as intercity business connections, capital flows, and leisure tourism reflected by this long-term intercity population mobility is of great significance for exploring intercity connections and regional spatial organization. Therefore, it is necessary to model and simulate long-term intercity population mobility.

2.3 Quantum computing and its applications

Benefiting from quantum properties such as superposition and entanglement, quantum computing transcends the limitations of traditional computing (Nimbe et al., 2021). Since Deutsch proposed the first quantum algorithm in 1985 (Deutsch, 1985), many scholars have proposed various quantum algorithms, including the large number decomposition algorithm (Shor, 1994), quantum search algorithm (Grover, 1997), quantum random walk algorithm (Kempe, 2003), large linear equations solving algorithm (Harrow et al., 2009), big data least squares fitting algorithm (Wiebe et al., 2012), support vector machine quantum algorithm (Rebentrost et al., 2014), variational quantum eigenvalue solving algorithm (Peruzzo et al., 2014), and quantum approximation optimization algorithm (Medvidović and Carleo, 2021). In recent years, advanced quantum algorithms, such as neural network quantum algorithms and quantum machine learning in the fields of intelligent computing (IC), machine learning (ML), and deep learning (DL) (Chalumuri et al., 2020; Cerezo et al., 2022) have been developed, which has solved some classic computational difficulties (Daley et al., 2022).
In the field of eco-environmental surface modeling, Yue et al. (2022, 2023) creatively combined high accuracy surface modeling (HASM) with the Harrow-Hassidim-Lloyd (HHL) algorithm to form the HASM-HHL quantum machine learning algorithm. HASM-HHL has been successfully applied in the fields of spatial interpolation, spatial upscaling/downscaling, data fusion, and model-data assimilation of eco-environment surfaces. In addition, HASM- HHL provides a general framework for applications such as constructing digital terrain models, simulating climate change, estimating carbon stocks and CO2 concentrations, modeling soil properties, developing COVID-19 scenarios, computing biodiversity dynamics, and analyzing ecosystem responses to climate change. In addition, quantum computing has also demonstrated superiority in addressing specific problems in fields such as traffic computing (simulation and prediction (Yu et al., 2022), feature analysis (Hu et al., 2022b), traffic optimization (Hussain et al., 2020), traffic control (Xiao et al., 2020)), big data retrieval, financial services, artificial intelligence, biochemistry, and aerospace (Dunjko and Briegel, 2018; Gill et al., 2022). The rapid development and widespread application of quantum computing have laid a feasible foundation for the simulation of intercity population mobility. However, there are few empirical studies on population mobility that are based on the quantum harmonic oscillator model. The multilevel and superposition states of the quantum harmonic oscillator model make it widely used in algorithm design, intelligent optimization, spatial search, and even data analysis. Therefore, the quantum harmonic oscillator model may have the potential to model, simulate, and analyze large-scale intercity population mobility scenarios.

3 Basic concept

Taking the one-way intercity population mobility $A \rightarrow B$, $B \rightarrow C$, and $C \rightarrow A$ among cities A, B, and C as an example. It is assumed that these three types of one-way intercity population mobility operate independently and do not affect each other and that they are formed under the coupling effect of many driving factors. The overall framework of QHO-IPM is shown in Figure 1.
Figure 1 The overall framework of QHO-IPM
For intercity population mobility $A \rightarrow B$, it is assumed that this intercity population mobility is only influenced by two driving factors: economic scale (ES) and income level (IL). The ES of city A is smaller than that of city B, but its IL is higher than that of city B. According to the classic “push-pull” theory (Lee, 1966), intercity population mobility results from a comprehensive effect of factors that flow into and out of cities. As a reference, the two driving factors, ES and IL, both produce opposite forces on intercity population mobility, forming the classic oscillator system of intercity population mobility, as shown in the intercity population mobility $A \rightarrow B$ in Figure 1a. The red arrow indicates a larger driving force, and the blue arrow represents the opposite. The attractiveness of ES and IL to the population in city B is greater than that in city A, so the population transfers from city A to city B under the comprehensive effect of ES and IL.
However, the influence of driving factors on intercity population mobility is time-varying, especially when affected by abnormal events or holidays. For example, population density and geographical distance may be the dominant driving factors for intercity population mobility during nonholiday periods, while that during holidays such as National Day may be leisure tourism. Unfortunately, the time-varying characteristics of the driving factors are not yet clear, which limits the ability of the classical oscillator system with fixed parameters to abstract the time-varying driving factors and their driving forces. That is, it is almost impossible for a classical oscillator system to characterize the evolution law between driving factors and intercity population mobility. Therefore, it is necessary to further transform and upgrade the classical oscillator system.
How to consider time-varying driving factors in an elegant way for modelling and simulating intercity population mobility is the key problem in this study. Drawing on the uncertainty of quantum theory, the classical oscillator system can be transformed into a quantum oscillator system to realize the consideration of time-varying driving factors. Then, a quantum harmonic oscillator model for the simulation of intercity population mobility can be constructed accordingly, as shown in the intercity population mobility $B \rightarrow C$ in Figure 1a. In QHO-IPM, the time-varying driving factors are abstracted as quantum oscillators, and the probability-time distribution of the system under the coupling of these quantum oscillators characterizes the time-varying state of intercity population mobility. Specifically, when the driving factors and their driving forces are constant, the virtual spring is in an equilibrium state, and the intercity population mobility is relatively stable. When the driving factors and their driving forces change, the probability-time distribution of the system changes with the stretching/compression of the virtual springs, and therefore, the intercity population mobility changes. In addition, the virtual springs connecting quantum oscillators and their state/elasticity coefficients represent the coupling relationship and coupling strength between driving factors, respectively.
Another difficulty faced by this study is solving the QHO-IPM. The coupling problem of the harmonic oscillator is a classical problem in quantum mechanics, solid physics, etc. (Park, 2019). Thus, the coordinate transformation is applied to decouple the coupled quantum harmonic oscillator system into a multioscillator-independent quantum harmonic oscillator system. Unfortunately, the unclear time-varying characteristics of the driving factors limit the solution of the wave function of the independent oscillators, making it impossible to obtain the system wave function. A feasible approach is simplifying the multioscillator-independent quantum harmonic oscillator system into a single oscillator quantum harmonic oscillator model, and then the system wave function can be described by the wave function of several discrete energy levels of the single harmonic oscillator (Bonezzi et al., 2017). That is, intercity population mobility can be described as the oscillation process of an oscillator connected to the inflow city, namely, the breaking point of intercity population mobility, as shown in Figure 1b. This breaking point continuously oscillates near the equilibrium position, which can approximate the dynamic evolution of intercity population mobility. The oscillation amplitude of the breaking point is used to quantify the scale of intercity population mobility.
The energy level superposition principle provides an idea for solving the above quantum harmonic oscillator model with a single oscillator. The quantum harmonic oscillator model can be solved as a probability-time distribution superimposed with probabilities of different energy levels, which represents the proportion of intercity population mobility under different energy levels to the total intercity population mobility. The influence degree of driving factors can be further estimated, as shown in Figure 1c. Finally, the mapping mechanism between this probability-time distribution and intercity population mobility is established, and the parameter estimation and mapping simulation are realized through the assistance of the observed intercity population mobility data, as shown in Figure 1d.

4 Methodology

In this study, the construction of a quantum harmonic oscillator model for intercity population mobility is attempted to realize the simulation of intercity population mobility affected by coupled driving factors. QHO-IPM includes the following four steps. First, a multioscillator-coupled quantum harmonic oscillator system is constructed by considering the driving factors of intercity population mobility. Next, the decoupling strategy of generalized coordinate transformation is adopted to simplify the above coupled quantum harmonic oscillator system into a quantum harmonic oscillator model. Then, the wave function of the quantum harmonic oscillator model is solved according to the energy level superposition principle and a stereographic projection. Finally, the mapping mechanism between the probability-time distribution and intercity population mobility is constructed to realize the reconstruction and simulation of intercity population mobility.

4.1 The coupled quantum oscillator system

This study regards each driving factor as an oscillator and constructs a multioscillator-coupled quantum harmonic oscillator system. In this system, the driving factors are denoted as mi. According to quantum theory, the Hamiltonian of the above coupled quantum harmonic oscillator system is as follows (Park, 2019):
$\hat{H}=\sum_{i=1}^{n} a_{i} m_{i}^{2}+2 \sum_{i, j=1}^{n} c_{i j} m_{i} m_{j}$
where the quadratic form of the coupled quantum harmonic oscillator system characterizes the intercity population mobility process between cities under the coupling of driving factors mi and mj. Here, ai is the coefficient of the uncoupled term, and cij is the coupling coefficient between the driving factors mi and mj.
Nevertheless, determining how to solve the coupling problem of coupled quantum harmonic oscillator systems is a common problem in some fields (e.g., quantum theory and solid-state physics), so Equation (1) cannot be solved directly. One possible solution is to seek a decoupling strategy to transform the coupled quantum oscillator system into a multioscillator-independent quantum harmonic oscillator system and further construct the quantum harmonic oscillator model to determine the breaking point for intercity population mobility.

4.2 Decoupling the coupled quantum oscillator system

In this study, the generalized coordinate transformation is applied to decouple the above coupled quantum harmonic oscillator system. Under the new base, the Hamiltonian of the coupled quantum harmonic oscillator system is re-expressed in the standard quadratic form to eliminate the coupling term. Then, Equation (1) can be expressed in matrix form as:
$\hat{H}=\left[m_{1}, \ldots, m_{n}\right]\left[\begin{array}{ccccc} a_{1} & c_{12} & c_{13} & \ldots & c_{1 n} \\ c_{21} & a_{2} & c_{23} & \ldots & c_{2 n} \\ c_{31} & c_{32} & a_{3} & \ldots & c_{3 n} \\ \vdots & \vdots & \vdots & \ddots & \vdots \\ c_{n 1} & c_{n 2} & c_{n 3} & \ldots & a_{n} \end{array}\right]\left[\begin{array}{c} m_{1} \\ \vdots \\ m_{n} \end{array}\right]=M^{T} B M$
where MT=[m1, m2, …, mn]. The coupling matrix B is transformed into a diagonal matrix according to quadratic theory. Then, the coupling term in Equation (1) can be eliminated:
$\left(m_{i}^{\prime}\right)=S^{T}\left(m_{i}\right)$
where S, the unitary transformation matrix, comprises eigenvalues {λ1, λ2, …, λn} and the corresponding eigenvectors {A1, A2, …, An} of the matrix B, can be recorded as (Zúñiga et al., 2017):
$S^{T}=\left[A_{1}, A_{2}, \ldots, A_{n}\right]^{T}$
Furthermore, the Hamiltonian $\hat{H}$ of the coupled quantum harmonic oscillator system based on the above transformation can be converted into the following form:
$\hat{H}=M^{T} B M=M^{\prime T}\left(S^{-1}\right)^{T} B S^{-1} M^{\prime}$
where
$\left(S^{-1}\right)^{T} B S^{-1}=\left[\begin{array}{lllll} \lambda_{1} & & & & \\ & \lambda_{2} & & & \\ & & \lambda_{3} & & \\ & & & \ddots & \\ & & & & \lambda_{n} \end{array}\right]$
After decoupling through the above matrix transformation, the Hamiltonian can be further transformed into:
$\hat{H}=\lambda_{1} m_{1}^{\prime 2}+\lambda_{2} m_{2}^{\prime 2}+\ldots+\lambda_{n} m_{n}^{\prime 2}$
Our goal is to solve the wave functions of the above decoupled quantum harmonic oscillator system, namely, the multioscillator-independent quantum harmonic oscillator system. The system wave function $\psi(x)$ can be expressed as the tensor product of the wave functions $\left\{\psi_{1}(x), \psi_{2}(x), \ldots, \psi_{n}(x)\right\}$ of each harmonic oscillator in the multioscillator-independent quantum harmonic oscillator system:
$\psi(x)=\psi_{1}(x) \otimes \psi_{2}(x) \otimes \ldots \otimes \psi_{n}(x)$
However, the number of driving factors for intercity population mobility is unknown, which makes it almost impossible to solve the above system wave function, $\psi(x)$. At this point, further determining how to solve the abovementioned wave functions $\left\{\psi_{1}(x),\right.\left.\psi_{2}(x), \ldots, \psi_{n}(x)\right\}$ efficiently is needed.

4.3 Optimization and solution of the quantum harmonic oscillator model

Inspired by the energy level superposition principle, the multioscillator-independent quantum harmonic oscillator system is approximated as a quantum harmonic oscillator model with a single oscillator, i.e., the quantum harmonic oscillator model of the breaking point for intercity population mobility. Furthermore, the system wave function $\psi(x)$ can be approximated as follows:
$\psi(x)=\sum_{k=0}^{K} \xi_{k} \psi_{k}(x)$
where $\psi_{0}(x), \psi_{1}(x), \ldots, \psi_{K}(x)$ are the wave functions of the 0th (the ground state), 1st, …, kth energy levels, respectively. In quantum theory, $\xi_{k}$ indicates the probability amplitude of the wave function at the kth energy level. Through the Taylor series expansion of the wave function, the wave function of the kth energy level can be expressed as (Grining et al., 2015):
$\psi_{k}(x)=\left(\frac{1}{\sqrt{\pi} 2^{k} k !}\right)^{1 / 2} \cdot e^{-x^{2} / 2} \cdot H_{k}(x)$
And the Hamiltonian basis can be defined as $h_{k}(x)=\left(e^{-x^{2} / 2} /\left(\sqrt{\pi} 2^{k} k !\right)^{1 / 2}\right) \cdot H_{k}(x)$ According to quantum theory, the probability density function f(x) is the square of the wave function $\psi(x)$:
$f(x)=|\psi(x)|^{2}=\left(\sum_{k=0}^{K} \xi_{k} h_{k}(x)\right)^{2}$
where $\sum_{k=0}^{K} \xi_{k}^{2}=1$. In QHO-IPM, $\xi_{k}$ represents the influence degree of the kth type driving factor on intercity population mobility. The distribution of $\xi_{k}$ can reflect the differences in the driving factors of intercity population mobility among different cities, it is an important basis with which urban managers and planners can formulate reasonable intercity population mobility control measures. Therefore, we go on to discuss the spatial and temporal distribution of $\xi_{k}$ to clarify the spatiotemporal characteristics of the driving factors among different cities.
In the quantum harmonic oscillator model, parameter optimization is another problem to be solved. In QHO-IPM, the energy level coefficient $\xi_{k}$ needs to be solved to further study the characteristics of the driving factors among different cities. Given that $\sum_{k=0}^{K} \xi_{k}^{2}=1$ and the sum of the integrals of probability density f(x) is 1, a spherical model is constructed accordingly. The radius of the spherical model is 1, and any point $\left(\xi_{1}, \xi_{2}, \cdots, \xi_{K}\right)$ appears on the sphere. Therefore, a stereographic projection transformation is performed in this study: any point on the sphere is projected onto the two-dimensional plane $\Pi$ through the origin. Hence, $\xi_{k}$ on the sphere is converted to $\vartheta_{k}$ on a plane. Based on the projected area $S=\sum_{k=0}^{K} \vartheta_{k}^{2}$, the probability form can be expressed as:
$P\left(\xi_{k}\right)=v_{k} / S$
Furthermore, based on the optimal $\vartheta_{k}$, the reversed stereographic projection is adopted to optimize $\xi_{k}$:
$P^{-1}\left(\vartheta_{k}\right)=\left\{\begin{array}{l} 1-2 /(S+1), \text { if } k=0 \\ 2 \vartheta_{k} /(S+1), \text { if } 1 \leqslant k \leqslant K \end{array}\right.$
Therefore, the log likelihood at $\left\{x_{1}, x_{2}, \ldots, x_{I}\right\}$ is:
$\ell(\vartheta)=\sum_{i=1}^{I} \log \left(\sum_{k=0}^{K}\left[P^{-1}(\vartheta)\right]_{k} \cdot h_{k}\left(x_{i}\right)\right)^{2}$
Obviously, the monotonic likelihood function $\ell(\vartheta)$ in Equation (14) can be solved using common optimization methods. Finally, the system wave function is solved.

4.4 Mapping time-varying probability to population mobility

The purpose of the intercity population mobility simulation conducted in this study is to simulate the time series of the intercity population mobility between two cities. In QHO-IPM, the oscillation amplitude, i.e., x, of the quantum harmonic oscillator model reflects the scale of intercity population mobility at different times. Then, the probability density f(x) can be further transformed into the time-varying probability f(t), which is proportional to the observed intercity population mobility. Therefore, the mapping mechanism between the time-varying probability fs(t) and intercity population mobility time series Fs(t) can be expressed as follows:
$\left\{\begin{array}{c} F_{1}(t)=\alpha_{1} f_{1}(t)+\beta_{1} \\ F_{2}(t)=\alpha_{2} f_{2}(t)+\beta_{2} \\ \vdots \\ F_{s}(t)=\alpha_{s} f_{s}(t)+\beta_{s} \end{array}\right.$
where αs(βs) is the mapping coefficient, which represents the proportion (number) of intercity population mobility that can (cannot) be captured by fs(t). The least squares method can be applied to estimate the mapping coefficients αs and βs, thus enabling the intercity population mobility to be simulated.

5 Implementation and results

5.1 Data description and experimental configuration

The Beijing-Tianjin-Hebei region is the economic core area of northern China and spans the two municipalities of Beijing and Tianjin as well as Hebei Province (Fan et al., 2022; Yang and Fan, 2022). As one of the three major urban agglomerations in China, the intercity population mobility in the Beijing-Tianjin-Hebei region exhibits the characteristics of multiple patterns and fast frequency, which may characterize the intercity population mobility in most regions of China (Yuan et al., 2021a; Huang et al., 2022).
In this study, seven cities at different levels, namely, five cities in the Beijing-Tianjin- Hebei region (i.e., Tianjin, Langfang, Baoding, Cangzhou, and Hengshui) and two surrounding cities (i.e., Dezhou and Liaocheng), are selected as the study area, as shown in Figure 2a. The daily intercity population mobility data of the intercity population mobility network, including Tianjin-Langfang, Langfang-Baoding, Langfang-Cangzhou, Baoding- Cangzhou, Cangzhou-Hengshui, Hengshui-Dezhou, and Dezhou-Liaocheng, are collected from the Tencent location big data platform (https://heat.qq.com/). The time range runs from January 1, 2016, to December 31, 2018 (1096 days in total). Furthermore, according to the “2023 China Mobile Internet Half Year Report” (https://www.questmobile.com.cn/research/report/1686624886410285058), as of June 2023, the number of Tencent APP users among mobile internet users reached 1.213 billion. Tencent population mobility data have the advantages of a large number of users and a high spatiotemporal resolution. These data have been widely used in research on intercity population mobility, urban agglomeration identification, and intercity travel networks, and their effectiveness has been verified (Pan and Lai, 2019). The average daily intercity population mobility in the study area is shown in Figure 2b. Obviously, the above intercity population mobility among different-level cities gradually increases from the south to the north of the study area, showing significant spatial heterogeneity, which may demonstrate the sensitivity and generalizability of QHO-IPM for modeling and simulating intercity population mobility at different scales.
Figure 2 Study area and average intercity population mobility
Based on the above intercity population mobility data, the following experiments and data analysis are performed: (1) The first is a QHO-IPM simulation experiment applied to model and simulate intercity population mobility in the above intercity population mobility network. (2) The next is a simulation performance comparison of different methods. The autoregressive integrated moving average (ARIMA) model and the long and short-term memory (LSTM) networks are selected as reference methods, and they are applied to the same intercity population mobility data. The simulation performances of QHO-IPM, ARIMA, and LSTM are further analyzed and compared. (3) The third is an error analysis of the different methods. The error distribution characteristics of the different methods are analyzed, and the modeling characteristics and application of different methods are explained accordingly. In addition to these experiments and analysis, the following discussion is supplemented: The distribution of the influence degree of driving factors is further discussed using the monthly influence degree of three driving factors on intercity population mobility. In addition, the possible improvements of QHO-IPM are also discussed.
Specifically, for the simulation and performance comparison experiments, i.e., experiments (1) and (2), the daily intercity population mobility data from 2016 to 2018 are applied to fit the QHO-IPM. For experiment (1), a 3-order quantum harmonic oscillator model is selected to model and simulate the intercity population mobility. For experiment (2), the d-order difference is applied to transfer the daily intercity population mobility data into a stationary time series. Then, the parameters p and q are obtained by analyzing the autocorrelation function (ACF) and partial autocorrelation function (PACF) of the transformed stationary time series. The optimal ARIMA(p,d,q) is finally determined by applying the Bayesian Information Criterion (BIC). In addition, the optimal network structure of LSTM is a two-layer network structure, including four neurons in the hidden layer and one neuron in the output layer. Adam is used as the optimizer, and the mean square error (MSE) is selected as the loss function. The epochs and batch size are 100 and 30, respectively.
Three criteria are selected to evaluate the simulation performance of the QHO-IPM, namely, the mean absolute error (MAE), root mean square error (RMSE), and coefficient of determination (R2). The MAE, RMSE, and R2 are defined in Table 1. In Table 1, $M_{i}$, $\bar{M}_{i}$, and $\hat{M}_{i}$ are used to indicate the observed intercity population mobility, the mean observed intercity population mobility, and the simulated intercity population mobility, respectively. m is the time series length of intercity population mobility.
Table 1 Definition of evaluation criteria
Evaluation criteria Definition
Mean absolute error (MAE) $M A E=\frac{1}{m} \sum_{i=1}^{m}\left|M_{i}-\hat{M}_{i}\right|$
Root mean square error (RMSE) $R M S E=\sqrt{\frac{1}{m} \sum_{i=1}^{m}\left(M_{i}-\hat{M}_{i}\right)^{2}}$
Coefficient of determination (R2) $R^{2}=1-\sum_{i=1}^{m}\left|M_{i}-\hat{M}_{i}\right|^{2} / \sum_{i=1}^{m}\left|M_{i}-\bar{M}_{i}\right|^{2}$

5.2 Simulation results of intercity population mobility

For the simulation of intercity population mobility, the application of different methods should simulate the average state of intercity population mobility. In addition, whether the intercity population mobility caused by abnormal events or holidays can be accurately simulated is another important indicator when testing the performance of the method.
For two typical cities, Langfang and Baoding, the simulated intercity population mobility of QHO-IPM is compared with that of ARIMA and LSTM, respectively, as shown in Figure 3. In Figure 3, the lines with different colors represent the observed intercity population mobility and the simulation results of different methods. The orange part indicates the intercity population mobility mutation caused by holidays. These holidays are New Year's Day, Qingming Festival, Dragon Boat Festival, Labor Day, National Day, Mid-Autumn Festival, and Spring Festival. On the long-term scale, these three methods can be used to roughly simulate the overall trend of intercity population mobility and reveal its fluctuation law over time. With the assistance of the 1:1 diagram between the simulated intercity population mobility of different methods and the observed intercity population mobility (Figure 4), it is clear that while the simulation results of the reference methods are concentrated on both sides of the 1:1 line, the simulation results of QHO-IPM, especially those points with larger intercity population mobility, are generally closer together and concentrated on the 1:1 line. Therefore, the simulation effect of QHO-IPM on the overall trend and law of intercity population mobility is better than that of the reference methods. This is because QHO-IPM models intercity population mobility from the perspective of driving factors, which reflects the large-scale structure and overall change characteristics of intercity population mobility from the essential mechanisms of intercity population mobility.
Figure 3 The simulated intercity population mobility using different methods
Figure 4 The 1:1 diagram between the simulated intercity population mobility and the observed intercity population mobility
In addition, the simulated intercity population mobility of QHO-IPM, ARIMA, and LSTM show significant differences on the small time scale. In particular, QHO-IPM can capture the intercity population mobility mutation caused by holidays, as shown by the orange shading in Figure 3. Taking the National Day in 2016, Labor Day in 2017, and New Year's Day in 2018 as examples, as shown in Figures 3a, 3b and 3g, it is obvious that the intercity population mobility simulated by QHO-IPM has almost the same trend and extreme value as the observed intercity population mobility, while the simulation results of the reference methods for intercity population mobility on holidays are relatively worse. QHO-IPM can also simulate small peaks well, as shown in Figures 3c-3h. In these six attached figures, QHO-IPM accurately simulates all high-frequency oscillations and sudden changes. Further, ARIMA and LSTM are slightly less capable of capturing high-frequency oscillations and mutations, especially irregular small peaks. QHO-IPM, the mechanism model for intercity population mobility, can be used to accurately reveal the relationship between intercity population mobility and the driving factors, even under abnormal situations. However, ARIMA and LSTM are highly dependent on the quantity and quality of training data. Both need to learn the structures and patterns through these data. In the case of a small amount of intercity population mobility mutation data, insufficient learning, and even structural errors, generally result. Therefore, ARIMA and LSTM are slightly worse than QHO-IPM in simulating the intercity population mobility mutation caused by abnormal events, especially that caused by holidays.
The evaluation indicators of the different methods are shown in Table 2. For all intercity population mobility assessed in this study, QHO-IPM shows a higher R2 and lower MAE and RMSE. This result illustrates the strong ability of QHO-IPM to capture the irregular fluctuations of intercity population mobility. The simulation accuracy (R2) of the intercity population mobility of Dezhou-Liaocheng is 0.9108, which is the highest among all considered instances of intercity population mobility. For the simulated intercity population mobility of Dezhou-Liaocheng, compared with that of ARIMA and LSTM, the MAE of QHO- IPM is decreased by 28.4% and 14.5%, the RMSE of QHO-IPM is reduced by 32.9% and 21.5%, and the R2 of QHO-IPM is improved by 13.5% and 7.8%, respectively. For all intercity population mobility, compared with ARIMA and LSTM, the average MAE of QHO-IPM is decreased by 30.0% and 5.1%, the average RMSE is reduced by 42.7% and 15.8%, and the average simulation accuracy (R2) is increased by 16.7% and 7.6%, respectively. The above analysis also demonstrates that QHO-IPM shows remarkable simulation performance compared with the reference methods.
Table 2 The evaluation indicators of different methods
Origin-Destination QHO-IPM ARIMA LSTM
MAE RMSE R2 MAE RMSE R2 MAE RMSE R2
Tianjin-Langfang 2150.11 3078.72 0.8385 (↑) 3277.05 4682.17 0.6265 2116.94 3380.70 0.7943
Langfang-Tianjin 1958.65 2633.53 0.8804 (↑) 2204.80 3588.58 0.7780 1958.15 3182.78 0.8124
Langfang-Baoding 1423.74 1996.32 0.8046 (↑) 2140.35 3164.85 0.5089 1442.95 2358.47 0.7306
Baoding-Langfang 1402.61 1869.96 0.8159 (↑) 1901.29 2849.91 0.5723 1506.91 2400.10 0.6993
Langfang-Cangzhou 919.85 1291.55 0.8701 (↑) 1223.93 1888.65 0.7223 1062.79 1603.53 0.7833
Cangzhou-Langfang 865.24 1195.73 0.8859 (↑) 1043.80 1706.09 0.7676 876.13 1476.18 0.8069
Baoding-Cangzhou 1105.96 1624.13 0.8978 (↑) 1485.26 2425.42 0.7722 1230.12 2040.40 0.8170
Cangzhou-Baoding 1074.19 1544.63 0.9036 (↑) 1340.90 2197.49 0.8048 1167.37 1910.61 0.8303
Cangzhou-Hengshui 810.82 1147.95 0.9009 (↑) 1035.55 1551.71 0.8189 972.41 1413.72 0.8404
Hengshui-Cangzhou 872.09 1209.49 0.8845 (↑) 1005.11 1525.32 0.8163 937.35 1359.53 0.8452
Hengshui-Dezhou 623.81 912.34 0.8960 (↑) 663.17 1088.31 0.8520 591.43 930.64 0.8837
Dezhou-Hengshui 604.51 956.79 0.8947 (↑) 612.57 1040.43 0.8755 620.31 957.81 0.8863
Dezhou-Liaocheng 604.81 932.21 0.9108 (↑) 844.78 1388.26 0.8021 707.25 1187.19 0.8449
Liaocheng-Dezhou 628.42 932.13 0.9107 (↑) 787.05 1338.48 0.8158 665.63 1137.78 0.8565
Mean 1074.63 1523.25 0.8782 (↑) 1397.54 2173.98 0.7524 1132.55 1809.96 0.8165

Note: ↑(↓) indicates that the simulation accuracy (R2) of QHO-IPM is superior to (inferior to) that of the reference methods.

5.3 Error analysis

The error distribution of the different methods considered is shown in Figure 5. Obviously, the simulation error of the QHO-IPM is small, and most of such errors are concentrated at approximately 0. It can be seen from the violin plot and the box plot that the simulation error distribution range of ARIMA is the widest among these three methods. The reason for this is that ARIMA is a traditional statistical method that usually learns structures and patterns for simulation and prediction from historical intercity population mobility data. However, limited training data may result in ARIMA's insufficient learning of the above structures and patterns, especially in regard to mutations caused by abnormal events, making it difficult to accurately reconstruct the fluctuations of intercity population mobility. Moreover, LSTM usually adjusts its parameters at the intersection of peaks and troughs, which causes the simulation effect to be slightly worse. That is, ARIMA and LSTM can almost only simulate the average state of intercity population mobility but cannot accurately respond to the intercity population mobility mutations that are caused by abnormal events. Therefore, the simulation error of QHO-IPM is evenly distributed at approximately 0, and its maximum error is smaller than that of ARIMA and LSTM. The error analysis of the simulation results of the three methods further illustrates the strong simulation ability of QHO-IPM for intercity population mobility.
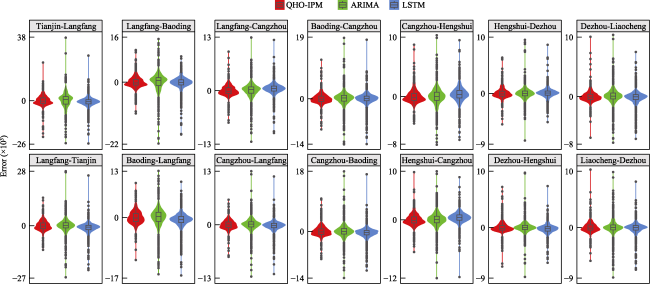
Figure 5 Error distribution of the different methods

6 Discussion

6.1 Influence degree of the different factors

The QHO-IPM is further applied to explore the monthly influence degree of the three factors considered in this study on intercity population mobility in the study area, as shown in Figure 6. Figures 6a, 6b, and 6c are the monthly influence degrees of factor 1, factor 2, and factor 3 on intercity population mobility, respectively. The color ranging from blue to red indicates the influence degree ranging from weak to strong.
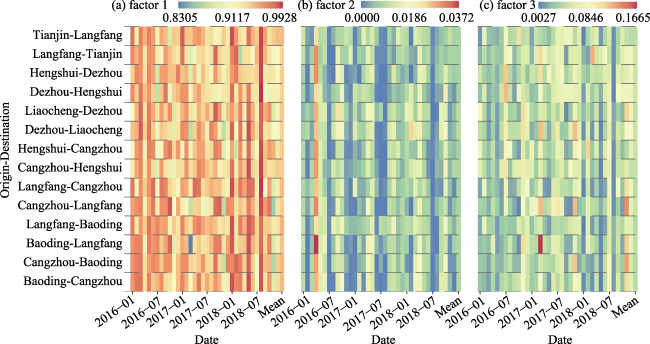
Figure 6 Distribution of the monthly influence degree of different factors
The influence degree of factor 1 (Figure 6a) is 0.8305-0.9928, which shows the leading role of this factor in intercity population mobility. On an annual scale, the influence degree of factor 1 on intercity population mobility is relatively stable in 2016, while its influence degree changed slightly in 2017 and 2018 (the standard deviations of the influence degree of factor 1 in 2016, 2017, and 2018 are 0.024, 0.026, and 0.029, respectively). This is because the traffic integration layout of roads and railways in the Beijing-Tianjin-Hebei region was gradually formed in 2016. Travel in the study area is less limited by objective factors, such as time and location constraints, but is more likely to be influenced by individual subjective factors. Therefore, the traffic integration layout in the Beijing-Tianjin-Hebei region makes the influence of factor 1 on intercity population mobility relatively stable in 2016. In particular, in March 2017, the influence of factor 1 on the intercity population mobility of Baoding-Langfang was relatively small (0.8306). This is because the influence of policy factors on intercity population mobility increased after the implementation of the Langfang household registration policy in January 2017, so the influence of factor 1 weakened over a short time. In August 2018, factor 1 had a significant influence on all intercity population mobility in the study area, verifying that the “one-hour life circle” in the Beijing-Tianjin- Hebei region is gradually making some achievements. In addition, the change in the monthly influence degree of factor 1 demonstrates that under the dominance of this factor, intercity population mobility is also affected by other factors. That is, intercity population mobility is a dynamic and nonlinear process that is affected by many driving factors.
Furthermore, factor 2 (Figure 6b) and factor 3 (Figure 6c) are the secondary driving factors of intercity population mobility in the study area. Compared with the other two monthly influence degrees, factor 2 was particularly significant in April 2016, especially for Baoding-Langfang. Affected by major holidays, such as New Year's Day, Spring Festival, and winter and summer vacations, factor 2 had little influence on intercity population mobility at the beginning, middle, and end of the year, so the influence of factor 2 is low around January, July, and December of every year. Factor 3, aside from its weak influence in August 2018, is relatively stable in other periods. This may be because August 2018 marked the end of the summer vacation, the peak tourism season in the Beijing-Tianjin-Hebei region, and the opening season for many schools. At the same time, the operation of tourist trains in the Beijing-Tianjin-Hebei region in August 2018 affected people's travel, resulting in the frequency and pattern of intercity population mobility differing from those in other periods, so the influence of factor 3 in August 2018 is abnormal.
Overall, the average influence degree of factor 1 (0.9455) is significantly higher than that of factor 2 (0.0077) and factor 3 (0.0468). This result demonstrates that (1) factor 1 is the main driving factor of intercity population mobility in the study area and (2) intercity population mobility is mostly dominated by a single driving factor and assisted by many other driving factors. Therefore, a significant “one dominant and multiple auxiliary” factor pattern of the driving factors of intercity population mobility is gradually taking shape.

6.2 Possible improvements in the QHO-IPM

This study applies Tencent population mobility data to model and simulate intercity population mobility and verifies the feasibility and effectiveness of the QHO-IPM. In future research, the following limitations should be further considered:
For research data, most static statistical data, such as traditional population mobility census data and statistical yearbooks, only reflects the general state of population mobility. These data are updated slowly and with poor timeliness, with a temporal resolution of more than one year. In contrast, Tencent population mobility data record the cities where people move in (out) at a more fine-grained spatiotemporal resolution, reflecting the dynamic process of population mobility between different cities and providing data support for modeling and simulating intercity population mobility at a fine-grained spatiotemporal resolution. However, Tencent population mobility data have shortcomings in regard to data integrity. Despite the popularity of smartphones, they still do not fully cover all regions (especially remote mountainous areas) and populations (especially children, elderly individuals, etc.), which has a certain impact on the integrity of the data. The population mobility formed by some user groups who have not been connected to the Tencent platform has not been recorded, which inevitably leads to certain errors in the research results. In addition, due to the temporal resolution, some population mobility across two adjacent time units may be decomposed, making it impossible to obtain their origin and destination. This also influences the state and spatiotemporal pattern of intercity population mobility. Therefore, integrating vehicle GPS positioning data, railway travel data, and air travel data related to intercity population mobility and using these multimode intercity population mobility data for more accurate model training, parameter estimation, and result simulation are promising future research topics.
The correlation analysis between intercity population mobility and its driving factors should also be strengthened. QHO-IPM models intercity population mobility from the perspective of coupling driving factors, and it is finally solved by use of an optimized strategy. The driving factors have not yet been analyzed in depth. These driving factors are the key to promoting intercity population mobility, which may be of great significance in revealing the evolution pattern and impact mechanism of intercity population mobility. Therefore, we need to further strengthen the correlation analysis between intercity population mobility and its driving factors to verify the role of QHO-IPM in revealing the mechanism of intercity population mobility. Moreover, the construction of a dataset of the coupling relationship and coupling strength of the driving factors and the further exploration of the travel patterns and laws of intercity population mobility are future research objects. We will also strive to carry out more related research to further explore the potential of quantum models in the modeling and simulation of intercity population mobility.

7 Conclusions

This paper is primarily focused on the simulation of intercity population mobility as affected by complex coupling driving factors, and in the paper a quantum harmonic oscillator model for the simulation of intercity population mobility (QHO-IPM) is proposed. QHO-IPM realizes the correlation modeling between intercity population mobility and driving factors through a coupled quantum harmonic oscillator system. Optimization strategies are adopted to realize the optimal solution of the QHO-IPM. The case study shows that compared with the reference methods (ARIMA and LSTM), QHO-IPM achieves better simulation performance that results in small and stable simulation errors. Furthermore, the significant “one dominant and multiple auxiliary” factor pattern of the driving factors is revealed. In other words, QHO-IPM is not only of great importance for deepening the understanding of intercity population mobility and its laws but also for helping to provide a basis for intercity population mobility control from the perspective of driving factors.

Acknowledgments

We are grateful to the Tencent location big data platform for providing the data used in this study. Data source: The Tencent location big data platform (https://heat.qq.com/). We also wish to acknowledge WANG Jiaxian for collecting experimental data and for helpful comments on the paper.

Conflicts of interest

The authors declare no conflicts of interest.

Data availability statement

Some or all data, models, or code that support the findings of this study are available from the corresponding author upon reasonable request.
[1]
Avila A M, Mezić I, 2020. Data-driven analysis and forecasting of highway traffic dynamics. Nature Communications, 11(1): 2090.

DOI PMID

[2]
Barbosa H, Barthelemy M, Ghoshal G et al., 2018. Human mobility: Models and applications. Physics Reports, 734: 1-74.

DOI

[3]
Biamonte J, Faccin M, De Domenico M, 2019. Complex networks from classical to quantum. Communications Physics, 2(1): 53.

DOI

[4]
Bonezzi R, Corradini O, Latini E et al., 2017. Quantum mechanics and hidden superconformal symmetry. Physical Review D, 96(12): 126005.

DOI

[5]
Cerezo M, Verdon G, Huang H Y et al., 2022. Challenges and opportunities in quantum machine learning. Nature Computational Science, 2(9): 567-576.

DOI PMID

[6]
Ceylan Z, 2020. Estimation of COVID-19 prevalence in Italy, Spain, and France. Science of The Total Environment, 729: 138817.

DOI

[7]
Chalumuri A, Kune R, Manoj B S, 2020. Training an artificial neural network using qubits as artificial neurons: A quantum computing approach. Procedia Computer Science, 171: 568-575.

DOI

[8]
Chang S, Pierson E, Koh P W et al., 2021. Mobility network models of COVID-19 explain inequities and inform reopening. Nature, 589(7840): 82-87.

DOI

[9]
Childs A M, Maslov D, Nam Y et al., 2018. Toward the first quantum simulation with quantum speedup. Proceedings of the National Academy of Sciences, 115(38): 9456-9461.

DOI

[10]
Daley A J, Bloch I, Kokail C et al., 2022. Practical quantum advantage in quantum simulation. Nature, 607(7920): 667-676.

DOI

[11]
Deutsch D, 1985. Quantum theory, the Church-Turing principle and the universal quantum computer. Proceedings of the Royal Society of London Series A: Mathematical and Physical Sciences, 400(1818): 97-117.

[12]
Dunjko V, Briegel H J, 2018. Machine learning and artificial intelligence in the quantum domain: A review of recent progress. Reports on Progress in Physics, 81(7): 074001.

DOI

[13]
Fan J, Lian Y, Zhao H, 2022. Review of the research progress in Beijing-Tianjin-Hebei region since 1980. Acta Geographica Sinica, 77(6): 1299-1319. (in Chinese)

DOI

[14]
Fu J, Yang H, Liu P et al., 2018. A CNN-RNN neural network join long short-term memory for crowd counting and density estimation. 2018 IEEE International Conference on Advanced Manufacturing (ICAM): 471-474.

[15]
Gill S S, Kumar A, Singh H et al., 2022. Quantum computing: A taxonomy, systematic review and future directions. Software: Practice and Experience, 52(1): 66-114.

[16]
Grining T, Tomza M, Lesiuk M et al., 2015. Many interacting fermions in a one-dimensional harmonic trap: A quantum-chemical treatment. New Journal of Physics, 17(11): 115001.

DOI

[17]
Grover L K, 1997. Quantum mechanics helps in searching for a needle in a haystack. Physical Review Letters, 79(2): 325-328.

DOI

[18]
Harrow A W, Hassidim A, Lloyd S, 2009. Quantum algorithm for linear systems of equations. Physical Review Letters, 103(15): 150502.

DOI

[19]
Hsueh Y W, Hsueh C H, Wu W C, 2020. Thermalization in a quantum harmonic oscillator with random disorder. Entropy, 22(8): 855.

DOI

[20]
Hu X, Li D, Yu Z et al., 2022a. Quantum harmonic oscillator model for fine-grained expressway traffic volume simulation considering individual heterogeneity. Physica A: Statistical Mechanics and Its Applications, 605: 128020.

DOI

[21]
Hu X, Niu X, Qian L et al., 2022b. Analyzing the multi-scale characteristic for online car-hailing traffic volume with quantum walk. IET Intelligent Transport Systems, 16(10): 1328-1341.

DOI

[22]
Huang Y, Sheng K, Sun W, 2022. Influencing factors of manufacturing agglomeration in the Beijing-Tianjin-Hebei region based on enterprise big data. Journal of Geographical Sciences, 32(10): 2105-2128.

DOI

[23]
Hussain H, Javaid M B, Khan F S et al., 2020. Optimal control of traffic signals using quantum annealing. Quantum Information Processing, 19(9): 1-18.

DOI

[24]
Kempe J, 2003. Quantum random walks: An introductory overview. Contemporary Physics, 44(4): 307-327.

DOI

[25]
Lee E S, 1966. A theory of migration. Demography, 3(1): 47-57.

DOI

[26]
Lewis W A, 1954. Economic development with unlimited supplies of labour. The Manchester School, 22(2): 139-191.

DOI

[27]
Li T, Wang J, Huang J et al., 2021. Exploring the dynamic impacts of COVID-19 on intercity travel in China. Journal of Transport Geography, 95: 103153.

DOI

[28]
Linke N M, Maslov D, Roetteler M et al., 2017. Experimental comparison of two quantum computing architectures. Proceedings of the National Academy of Sciences, 114(13): 3305-3310.

DOI

[29]
Liu E, Yan X, 2019. New parameter-free mobility model: Opportunity priority selection model. Physica A: Statistical Mechanics and Its Applications, 526: 121023.

DOI

[30]
Liu E, Yan X, 2020. Research advances in intervening opportunity class models for predicting human mobility. Acta Physica Sinica, 69(24): 248901.

DOI

[31]
Liu Y, 2018. Research on the urban-rural integration and rural revitalization in the new era in China. Acta Geographica Sinica, 73(4): 637-650. (in Chinese)

DOI

[32]
Mazzoli M, Molas A, Bassolas A et al., 2019. Field theory for recurrent mobility. Nature Communications, 10(1): 3895.

DOI PMID

[33]
Medvidović M, Carleo G, 2021. Classical variational simulation of the Quantum Approximate Optimization Algorithm. NPJ Quantum Information, 7(1): 101.

DOI

[34]
Nimbe P, Weyori B A, Adekoya A F, 2021. Models in quantum computing: A systematic review. Quantum Information Processing, 20(2): 80.

DOI

[35]
Pan J, Lai J, 2019. Spatial pattern of population mobility among cities in China: Case study of the National Day plus Mid-Autumn Festival based on Tencent migration data. Cities, 94: 55-69.

DOI

[36]
Park D, 2019. Dynamics of entanglement in three coupled harmonic oscillator system with arbitrary time-dependent frequency and coupling constants. Quantum Information Processing, 18(9): 282.

DOI

[37]
Peruzzo A, Mcclean J, Shadbolt P et al., 2014. A variational eigenvalue solver on a photonic quantum processor. Nature Communications, 5(1): 4213.

DOI

[38]
Quesne C, 2015. An update on the classical and quantum harmonic oscillators on the sphere and the hyperbolic plane in polar coordinates. Physics Letters A, 379(26): 1589-1593.

DOI

[39]
Ravenstein E G, 1885. The laws of migration. Journal of the Statistical Society of London, 48(2): 167-227.

DOI

[40]
Rebentrost P, Mohseni M, Lloyd S, 2014. Quantum support vector machine for big data classification. Physical Review Letters, 113(13): 130503.

DOI

[41]
Shen S, Shen G, 2020. Analysis on the spatial structure of inter-provincial migrant in China. Population Journal, 42(4): 103-112. (in Chinese)

[42]
Sheng G, 2018. Study on the evolution and explanation of inter-provincial population flow network in China. China Population, Resources and Environment, 28(11): 1-9. (in Chinese)

[43]
Shi X, Wang S, Wang D et al., 2022. Characteristics and influencing factors of daily population flow among cities in China. Scientia Geographica Sinica, 42(11): 1889-1899. (in Chinese)

DOI

[44]
Shor P W, 1994. Algorithms for quantum computation: Discrete logarithms and factoring. In:Proceedings 35th Annual Symposium on Foundations of Computer Science, 124-134.

[45]
Simini F, Barlacchi G, Luca M et al., 2021. A Deep Gravity model for mobility flows generation. Nature Communications, 12(1): 6576.

DOI PMID

[46]
Simini F, González M C, Maritan A et al., 2012. A universal model for mobility and migration patterns. Nature, 484(7392): 96-100.

DOI

[47]
Smolak K, Rohm W, Knop K et al., 2020. Population mobility modelling for mobility data simulation. Computers, Environment and Urban Systems, 84: 101526.

[48]
Stouffer S A, 1940. Intervening opportunities: A theory relating mobility and distance. American Sociological Review, 5(6): 845-867.

DOI

[49]
Tan S, Lai S, Fang F et al., 2021. Mobility in China, 2020: A tale of four phases. National Science Review, 8(11): nwab148.

DOI

[50]
Tang J, Zhang W, Wang Y, 2020. The pattern and influencing factors of daily population movement network in the Yangtze River Delta. Geographical Research, 39(5): 1166-1181. (in Chinese)

DOI

[51]
Toch E, Lerner B, Ben-Zion E et al., 2019. Analyzing large-scale human mobility data: A survey of machine learning methods and applications. Knowledge and Information Systems, 58(3): 501-523.

DOI

[52]
Todaro M P, 1969. A model of labor migration and urban unemployment in less developed countries. The American Economic Review, 59(1): 138-148.

[53]
Wang G, Pan Z, Lu Y, 2012. China's inter-provincial migration patterns and influential factors: Evidence from year 2000 and 2010 population census of China. Chinese Journal of Population Science, 32(5): 2-13. (in Chinese)

[54]
Wang J, Dong L, Cheng X et al., 2019. An extended exploration and preferential return model for human mobility simulation at individual and collective levels. Physica A: Statistical Mechanics and Its Applications, 534: 121921.

DOI

[55]
Wang S, Fei T, Li W et al., 2022. Incorporation of intra-city human mobility into urban growth simulation: A case study in Beijing. Journal of Geographical Sciences, 32(5): 892-912.

DOI

[56]
Wang X, Ding S, Cao W et al., 2020. Research on network patterns and influencing factors of population flow and migration in the Yangtze River Delta urban agglomeration, China. Sustainability, 12(17): 6803.

DOI

[57]
Wiebe N, Braun D, Lloyd S, 2012. Quantum algorithm for data fitting. Physical Review Letters, 109(5): 050505.

DOI

[58]
Xiao H, Chronopoulos A T, Zhang Z, 2020. An efficient security scheme for vehicular communication using a quantum secret sharing method. IEEE Transactions on Vehicular Technology, 69(1): 1101-1105.

DOI

[59]
Xie P, Li T, Liu J et al., 2020. Urban flow prediction from spatiotemporal data using machine learning: A survey. Information Fusion, 59: 1-12.

DOI

[60]
Yan X, Wang W, Gao Z et al., 2017. Universal model of individual and population mobility on diverse spatial scales. Nature Communications, 8(1): 1639.

DOI

[61]
Yan X, Zhao C, Fan Y et al., 2014. Universal predictability of mobility patterns in cities. Journal of The Royal Society Interface, 11(100): 20140834.

DOI

[62]
Yang K, Fan B, 2022. The innovative geographical foundation of the relative decline of economic growth in Beijing-Tianjin-Hebei region. Acta Geographica Sinica, 77(6): 1320-1338. (in Chinese)

DOI

[63]
Yu Z, Li D, Hu X et al., 2022. Modeling small-granularity expressway traffic volumes with quantum walks. IEEE Transactions on Intelligent Transportation Systems, 23(10): 17077-17086.

DOI

[64]
Yuan T, Cao W, Chen M et al., 2021a. Research on the spatial pattern of population agglomeration and dispersion in Bejing-Tianjin-Hebei Region from a multidimensional perspective. World Regional Studies, 30(3): 520-532. (in Chinese)

[65]
Yuan Y, Zhang Z, Yang X T et al., 2021b. Macroscopic traffic flow modeling with physics regularized Gaussian process: A new insight into machine learning applications in transportation. Transportation Research Part B: Methodological, 146: 88-110.

DOI

[66]
Yue T, Liu Y, Du Z et al., 2022. Quantum machine learning of eco-environmental surfaces. Science Bulletin, 67(10): 1031-1033.

DOI PMID

[67]
Yue T, Wu C, Liu Y et al., 2023. HASM quantum machine learning. Science China Earth Sciences, 66(9): 1937-1945.

DOI

[68]
Zelinsky W, 1971. The hypothesis of the mobility transitio. Geographical Review, 61: 219-249.

DOI

[69]
Zeroual A, Harrou F, Dairi A et al., 2020. Deep learning methods for forecasting COVID-19 time-series data: A comparative study. Chaos, Solitons & Fractals, 140: 110121.

[70]
Zhang J, Zheng Y, Qi D et al., 2018. Predicting citywide crowd flows using deep spatio-temporal residual networks. Artificial Intelligence, 259: 147-166.

DOI

[71]
Zhao D, Zhang R, Zhang H et al., 2022. Prediction of global omicron pandemic using ARIMA, MLR, and Prophet models. Scientific Reports, 12(1): 18138.

DOI PMID

[72]
Zhao Z, Wei Y, Pang R et al., 2017. Spatiotemporal and structural characteristics of interprovincial population flow during the 2015 spring festival travel rush. Progress in Geography, 36(7): 952-964. (in Chinese)

[73]
Zhao Z, Wei Y, Yang R et al., 2019. Gravity model coefficient calibration and error estimation: Based on Chinese interprovincial population flow. Acta Geographica Sinica, 74(2): 203-221. (in Chinese)

DOI

[74]
Zipf G K, 1946. The P1 P2/D hypothesis: on the intercity movement of persons. American Sociological Review, 11(6): 677-686.

DOI

[75]
Zúñiga J, Bastida A, Requena A, 2017. Quantum solution of coupled harmonic oscillator systems beyond normal coordinates. Journal of Mathematical Chemistry, 55(10): 1964-1984.

DOI

Outlines

/