
Journal of Geographical Sciences >
How does land consolidation affect rural development transformation?
|
Chen Kunqiu (1992-), PhD and Associate Professor, specialized in land use and urban-rural development. E-mail: chenkq@hnu.edu.cn |
Received date: 2023-03-06
Accepted date: 2023-11-09
Online published: 2024-04-24
Supported by
National Natural Science Foundation of China(42201209)
Hunan Provincial Natural Science Foundation Project of China(2022JJ40053)
Research Foundation of the Department of Natural Resources of Hunan Province(20230109DC)
The Open Research Fund of Hunan Key Laboratory of Sciences of Urban and Rural Human Settlements in Hilly Areas(HNU-SAP-KF220205)
Youth Humanities and Social Sciences Project of the Ministry of Education of China(19YJC840060)
China's rural territory is entering a critical stage of transformation and development. Promoting rural development and transformation is an important path to achieve rural vitalization, and land consolidation is expected to become the starting point to boost rural transformation. To clarify the internal relationship between land consolidation and rural development transformation is an important scientific proposition. This paper constructs a theoretical framework of rural land consolidation (RLC) affecting rural development transformation (RDT), and analyzes the historical evolution process and characteristics of RLC and rural development in China. Based on government interviews and household surveys, this paper analyzes the impact of RLC on RDT under different geographic types and different consolidation models from a multi-subject perspective, and empirically tests the effects using the econometric model. China's rural land consolidation has also gradually transformed to multi-type and multi-functional comprehensive consolidation. The results show that there are many explicit and implicit mechanisms of the influence of RLC on RDT in China, such as mechanism of promotion of industrial development, mechanism of integration of development factors, mechanism of urbanization and mechanism of urban-rural interaction. And the results of different modes of RLC impact on RDT are different. Farmers have a high degree of support and satisfaction with RLC since RLC has improved their production and living conditions as well as household and village income. Besides, the effects of various types of RLC on RDT are positive. The authors argue that constructing human-land early warning mechanisms, optimizing the layout and performance evaluation of RLC and promoting multi-type development and multisystem coordination of RLC can elevate the effect of RLC on RDT. This paper provides reference for scientific decision-making of RDT from the perspective of RLC.
CHEN Kunqiu , CHEN Yunya , LONG Hualou , LI Ninghui . How does land consolidation affect rural development transformation?[J]. Journal of Geographical Sciences, 2024 , 34(3) : 417 -438 . DOI: 10.1007/s11442-024-2211-5
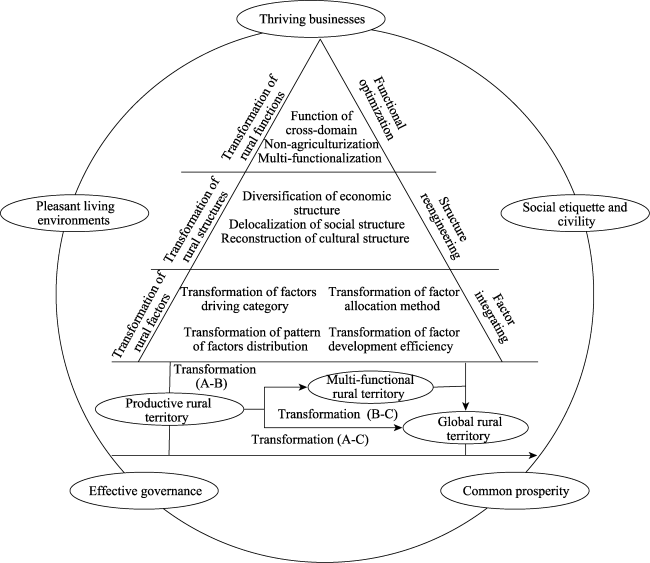
Figure 1 Conceptual framework of rural development transformation |
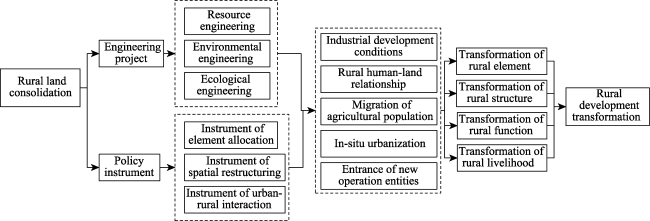
Figure 2 Theoretical framework of rural land consolidation promoting rural development transformation |
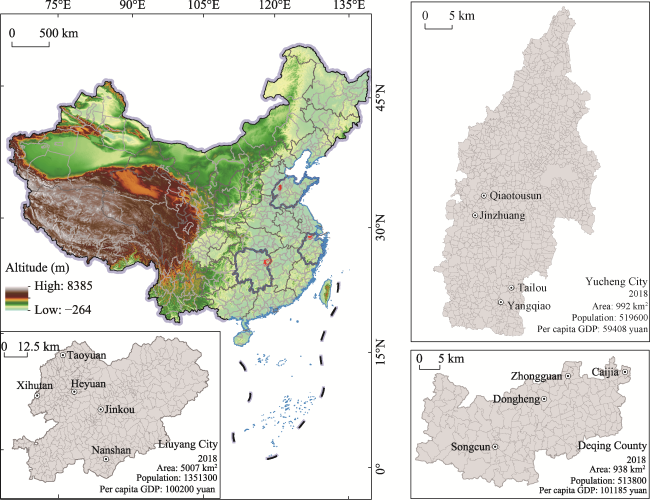
Figure 3 Typical study areas in this study |
Table 1 Patterns of RLC and its impacts on RDT |
| Farmland consolidation | Homestead consolidation | RDT | |||
|---|---|---|---|---|---|
| Mode | Main measures | Mode | Main measures | Characteristics | |
| Deqing county | Territorial RLC | Land leveling; Squaring the field; Infrastructure support | Territorial RLC | 1. Demolish old houses and build new houses; 2. Centralized residences; 3. Standard housing area | 1. Scale of ploughland; 2. Nonagricultural employment of villagers; 3. In-situ urbanization |
| Liuyang city | High-standard farmland construction | Project-based consolidation; High-standard farmland construction | Demolish old houses | 1. Demolish old houses for reclamation; 2. Financial compensation; 3. Pay for the excess area; 4. Replacement land | 1. Increase in agricultural production and income; 2. Intergenerational division of forces; 3. Transformation of residents’ livelihood |
| Yucheng city | Unused land consolidation | Unused land consolidation; Land reallocation by the village collective | Demolish old houses | 1. Demolish old houses; 2. Financial compensation not available for most farmers; 3. Replacement land | 1. Enrich the collective economy; 2. Transformation of rural governance |
Table 2 Details of the selected villages |
| Location | Total population | Labor population | Agricultural labor population | Annual per capita income (10,000 yuan) | The main source of income | Village collective income (10,000 yuan) | Arable land (mu) | Number of homesteads | |
|---|---|---|---|---|---|---|---|---|---|
| Deqing county | Dongheng village | 3909 | 1600 | 200 | 4.8 | Work, land share, company share | 2577 | 8900 | 785 |
| Zhongguan village | 3892 | 2200 | 95 | 3.5 | Work | 97 | 3000 | 997 | |
| Caijie village | 3250 | 1800 | 2 | 3.7 | Work, materials processing, private enterprise | 276 | 5000 | 750 | |
| Yucheng city | Jinzhuang village | 510 | 311 | 291 | 3 | vegetable greenhouse | 15 | 937 | 143 |
| Qiaotou village | 540 | 300 | 140 | 1.8 | Work, farming | 17 | 1354 | 150 | |
| Yangqiao village | 404 | 120 | 60 | 2 | Work, farming | 3.5 | 348 | 125 | |
| Tailou village | 679 | 440 | 260 | 1.5 | Work, farming | 7 | 1979 | 183 | |
| Liuyang city | Nanshan village | 3698 | 2400 | 200 | 2.8 | Fireworks industry | 12 | 1480 | 1090 |
| Jinkou village | 5320 | 2500 | 1000 | 4 | Work, business, transportation, family workshop | 80 | 2500 | 1000 | |
| Taoyuan village | 1942 | 500 | 300 | 1.3 | Work, farming, transfer payment | 20 | 1200 | 600 | |
| Xihutan village | 3400 | 2300 | 1000 | 2.8 | Work, farming, collective share | 90 | 4100 | 800 | |
| Heyuan village | 10000 | 4400 | 1000 | 2.1 | Work, business, farming | 20 | 7000 | 2144 | |
Note: The data come from interviews with village officials in each village. The labor force includes “half labor,” which is workers older than 65 that are still working and can engage in simple handicraft operations or agricultural planting. The labor force includes part-time farmers. |
Table 3 The summary statistics of variables |
| Obs. | Mean | Std. dev | Min | Max | |
|---|---|---|---|---|---|
| Per capita income of household (10,000 yuan) | 441 | 3.746 | 5.392 | 0.200 | 71.429 |
| Proportion of agricultural income of household | 441 | 0.146 | 0.286 | 0 | 1 |
| Farmland consolidation | 441 | 0.605 | 0.489 | 0 | 1 |
| Homestead consolidation | 441 | 0.596 | 0.491 | 0 | 1 |
| Human capital | 441 | 2.144 | 0.834 | 0 | 5 |
| Farmland transfer (mu) | 441 | -0.525 | 10.859 | -20 | 196 |
| Labor force ratio | 441 | 0.605 | 0.244 | 0 | 1 |
| Terrain | 441 | 0.626 | 0.484 | 0 | 1 |
Source: Based on the questionnaire data. |
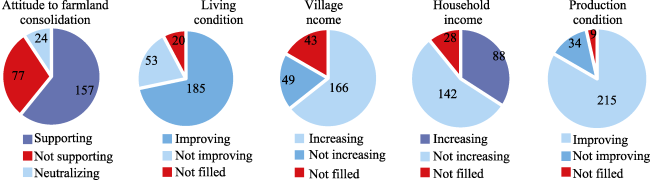
Figure 4 Effect of farmland consolidation on living and production condition and income |
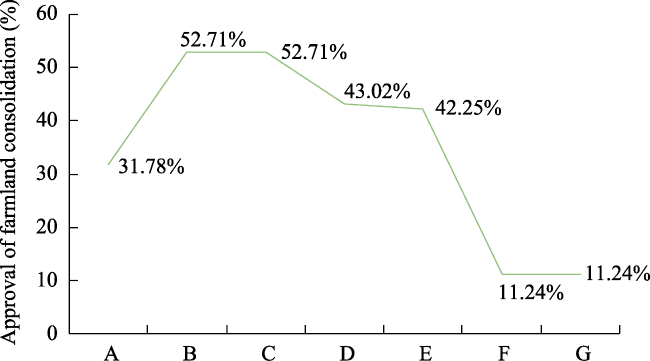
Figure 5 Effect of farmland consolidation on agricultural productionNote: A, B, C, D, E, F, and G represent “increase the area of farmland,” “improve the flatness of farmland,” “improve the tractor road,” “optimize irrigation conditions,” “facilitate mechanized operations,” “improve the soil quality,” and “reduce drought and flood disasters,” respectively. |
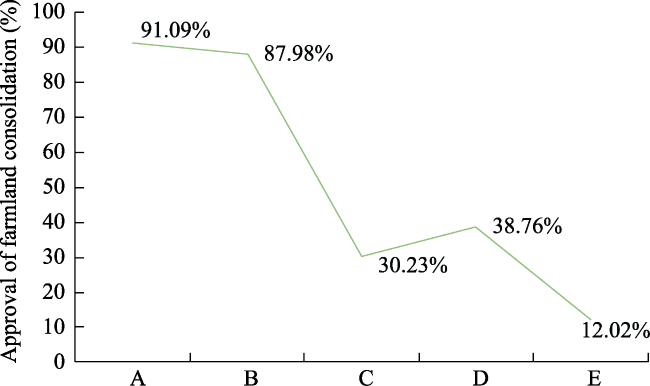
Figure 6 Effect of farmland consolidation affecting the household living conditionNote: A, B, C, D and E represent “beautify village landscape,” “improve infrastructure,” “increase production and income,” “liberate the labor force” and “enhance democratic participation,” respectively. |
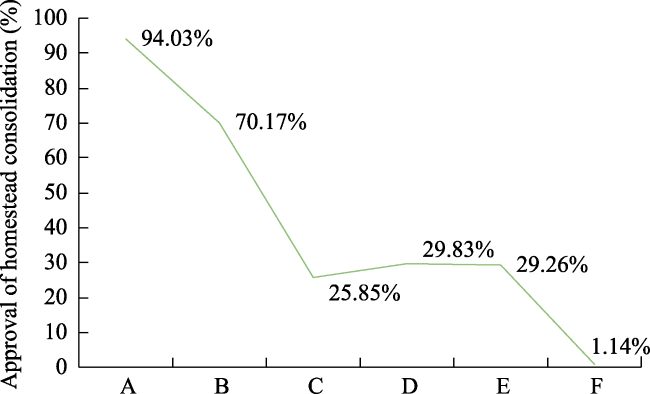
Figure 7 Effect of homestead consolidationNote: A, B, C, D, E, and F represent “improve human settlements,” “promote intensive land use,” “guarantee food security,” “achieve prosperous life,” “promote local civilization,” and “I do not know,” respectively. |
Table 4 Regression results |
| (1) | (2) | (3) | (4) | (5) | (6) | (7) | (8) | |
|---|---|---|---|---|---|---|---|---|
| Per capita income of the household | Proportion of agricultural income of the household | |||||||
| Farmland consolidation | 1.5906*** | 1.7233*** | 0.2409*** | 0.6149*** | ||||
| (3.06) | (3.28) | (9.47) | (12.44) | |||||
| Homestead consolidation | 1.6214*** | 1.5632*** | 0.2066*** | 0.1763*** | ||||
| (3.13) | (3.00) | (7.95) | (6.83) | |||||
| Human capital | 0.7407*** | 0.8164*** | 0.0293** | 0.0468*** | ||||
| (2.41) | (2.68) | (1.95) | (3.2) | |||||
| Farmland transfer | 0.0527** | 0.0528** | -0.0032*** | -0.0031*** | ||||
| (2.17) | (2.17) | (-2.74) | (-2.72) | |||||
| Ratio of labor | 1.0640 | 1.3921*** | -0.0990* | -0.0558 | ||||
| (1.02) | (1.32) | (-1.93) | (-0.11) | |||||
| Terrain | -0.0862 | -0.1388 | 0.1061*** | 0.0982*** | ||||
| (-0.16) | (-0.26) | (4.11) | (3.89) | |||||
| Constant | 2.7791*** | 2.7830*** | -0.4727 | 0.0329 | 0.7307*** | 0.7081*** | 0.6778*** | 0.6149*** |
| (6.94) | (6.87) | (6.47) | (0.030) | (36.4) | (35.79) | (13.86) | (12.44) | |
| Observations | 441 | 441 | 441 | 441 | 441 | 441 | 441 | 441 |
| R2 | 0.022 | 0.021 | 0.049 | 0.053 | 0.126 | 0.170 | 0.189 | 0.227 |
Note: *, **, and *** represent 10%, 5%, and 1% significance levels, respectively; t values are in parentheses. |
| [1] |
|
| [2] |
|
| [3] |
|
| [4] |
|
| [5] |
|
| [6] |
|
| [7] |
|
| [8] |
|
| [9] |
|
| [10] |
|
| [11] |
|
| [12] |
|
| [13] |
|
| [14] |
|
| [15] |
|
| [16] |
|
| [17] |
|
| [18] |
|
| [19] |
|
| [20] |
|
| [21] |
|
| [22] |
|
| [23] |
|
| [24] |
|
| [25] |
|
| [26] |
|
| [27] |
|
| [28] |
|
| [29] |
|
| [30] |
|
| [31] |
|
| [32] |
|
| [33] |
|
| [34] |
|
| [35] |
|
| [36] |
|
| [37] |
|
| [38] |
|
| [39] |
|
| [40] |
|
| [41] |
|
| [42] |
|
| [43] |
|
/
| 〈 |
|
〉 |