Research Articles

Lake surface water-heat flux variation and its correlations with meteorological factors on multiscale in the Yamzhog Yumco, south Tibet

  • ZHANG Xueqin , 1 ,
  • JIN Zheng 2 ,
  • SHEN Pengke 3 ,
  • ZHENG Du 1
Expand
  • 1. Key Laboratory of Land Surface Pattern and Simulation, Institute of Geographic Sciences and Natural Resources Research, CAS, Beijing 100101, China
  • 2. Department of Atmospheric and Oceanic Sciences, Fudan University, Shanghai 200438, China
  • 3. National Climate Center, China Meteorological Administration, Beijing 100081, China

Zhang Xueqin, specialized in climatic change and its impacts. E-mail:

Received date: 2023-11-05

  Accepted date: 2023-12-07

  Online published: 2024-02-06

Supported by

The Second Tibetan Plateau Scientific Expedition and Research Program (STEP)(2019QZKK0202-02)

National Natural Science Foundation of China(41471064)

Abstract

Lake surface water-heat exchange and its climatic attribution critically influence alpine lakes’ evaporation mechanism and water storage balance with climate change. Here, this paper first explored the hourly, daily, and monthly water-heat flux variations of the lake surface and their correlations with meteorological factors based on the eddy covariance turbulent flux observation over the Yamzhog Yumco, an alpine lake in south Tibet in the non-freezing period (April-December) in 2016 and 2017. We found that the average latent heat flux was much higher than the sensible heat flux on the lake surface from April to December. Meanwhile, the water-heat flux exhibited remarkable seasonal variation, with a prominent role of higher air temperature and humidity in summer jointly controlling the lake-air energy exchange. Moreover, the main controlling meteorological factors for the water-heat flux variation of the lake surface differed with diversified timescales. First, the lake-air temperature difference was the most significant meteorological factor related to sensible heat flux on the half-hourly, daily, and monthly timescales. Second, the latent heat flux was strongly positively correlated with wind speed and the synergies of wind speed and water vapor pressure deficit on the daily and half-hourly timescales. Third, the lake surface heat flux was significantly negatively correlated with net radiation flux on the daily and monthly scales. The negative correlation can be attributed to the seasonal variation of the water surface net radiation, and the phase difference in heat flux intensity caused by the lake-air temperature difference and heat capacity contrast. Our findings will hopefully improve the understanding of energy exchange and evaporation mechanisms for alpine lakes in a warming climate.

Cite this article

ZHANG Xueqin , JIN Zheng , SHEN Pengke , ZHENG Du . Lake surface water-heat flux variation and its correlations with meteorological factors on multiscale in the Yamzhog Yumco, south Tibet[J]. Journal of Geographical Sciences, 2024 , 34(2) : 397 -414 . DOI: 10.1007/s11442-024-2210-6

1 Introduction

Lakes, an essential component of the global-scale water cycle and the climate system, have remarkable impacts on large-scale circulations and precipitation (Hack et al., 2006). As a heat source/sink and water vapor source in the atmospheric boundary layer, lakes drive local atmospheric thermal circulation through land-water thermal differences, thus modulating the in-situ microclimate characteristics surrounding the water body, especially in the downwind areas (Segal and Arritt, 1992). However, the atmospheric numerical model is weak in simulating the lake surface process (Ren et al., 2013). Besides, the thermodynamic and physicochemical properties of lake water bodies differ significantly from those of land surfaces. With the scale refinement development of numerical prediction models and climate models (Dutra et al., 2010), the parameter optimization of lake surface models relies on the long-term observations of lake-air water-heat exchange on a broader scale. The water-heat flux observations are a fundamental scientific basis for exploring lake-air evaporation mechanisms, among which the high-accuracy estimation of flux intensity is the key (Tanny et al., 2008).
Specifically, the long-term observations of lakes on the Qinghai-Tibet Plateau are crucial for global climate change studies. The plateau lakes account for 51.4% of the total lake area in China and are relatively unaffected by human activities, making alpine lakes an indicator of global climate change (Schindler et al., 1996; Ma et al., 2011; Zhu et al., 2020). The water cycle on the plateau has been enhanced with climate change (Chen et al., 2015). Meanwhile, the lake change exhibits a notable spatial heterogeneity, with lake expansion in the northern plateau and shrinkage in the southern plateau during 1976−2010 (Yao et al., 2017). Therefore, from a watershed water balance perspective, it is necessary to quantitatively identify the contribution of water balance components (i.e., input inflow from catchment, lake surface precipitation, and evaporation) to alpine lake area or water storage changes.
As one of the fundamental tools for terrestrial evapotranspiration measurements (Liu et al., 2021), the Eddy Covariance (EC) method has been widely used to study lake water-heat turbulent flux, such as Nam Co (Biermann et al., 2014), Erhai Lake (Liu et al., 2015), Taihu Lake (Lee et al., 2014), Poyang Lake (Zhao et al., 2014; Zhao and Liu, 2017, 2018; Cui et al., 2020), and Logan’s Dam in Australia (McGloin et al., 2014). However, the EC observation research conducted for alpine lakes is relatively inadequate. The previous EC observations revealed the temporal variation and its environmental controls of water-heat turbulence fluxes in several larger lakes in the northern plateau, including Nam Co (Zhou et al., 2010; Biermann et al., 2014; Wang et al., 2015; Wang et al., 2017), Ngoring Lake (Li et al., 2015), Qinghai Lake (Li et al., 2016), and Serling Co (Zhu et al., 2019).
In contrast, the EC observations in lakes of the southern plateau are even rarer. Notably, the turbulent flux observation began in April 2016 to explore the lake surface evaporation mechanism for the Yamzhog Yumco, one representative alpine valley lake in south Tibet. We preliminarily disclosed the characteristics of atmospheric turbulence at the lake surface and verified the applicability of the similarity theory of atmospheric turbulence transport in the near-surface layer (Shen, 2018; Shen and Zhang, 2019).
Previous studies on the lake evaporation and water level changes in the Yamzhog Yumco suggest that the lake’s water level declined with remarkable fluctuation due to the joint influence of evaporation, precipitation, and human activities during 1974−2019 (Tang et al., 2021). Meanwhile, the lake’s surface area has reduced, with the significant role of precipitation and evaporation in water storage changes based on remote sensing inversion and field observations (Chu et al., 2012; Laba et al., 2012). However, human influences on lake water storage and environmental conditions have far outweighed the impact of climatic change since 1998, when the hydroelectric station in the Yamzhog Yumco began to operate (Sang et al., 2020; Han et al., 2023).
Considering the research gap in the terrain effect on regional-scale lake evaporation, unveiling the lake evaporation mechanism is indispensable to elucidate the lake water balance in the Yamzhog Yumco. Hence, we initially explore the variability of water-heat flux and its correlation with the main meteorological factors (i.e., net radiation flux over the water surface, water vapor pressure deficit, lake-air temperature difference, and wind speed) on multiple timescales, utilizing the flux data interpolated by an artificial neural network. Our efforts will provide a localized scheme for the parameter optimization of land surface process modeling in the Qinghai-Tibet Plateau, improving the understanding of the physical mechanism behind the water-heat flux variation in alpine lakes.

2 Methods

2.1 Study region and EC observation system

The Yamzhog Yumco, with a watershed area of about 9064 km2 and a zigzag lake shore, is the largest closed inland lake in the northern Himalayas (Zhang et al., 2012). The EC observation site (Figure 1, 29°07′28″N, 90°26′27″E, 4420.6 m above sea level), located in the shallow water area near the lake shore, is adjacent to the Baidi Hydrometric Station during the non-freezing period from April to December 2016 and 2017. There is an elevation gradient of more than 500 m within the horizontal range less than 2 km from the observation point.
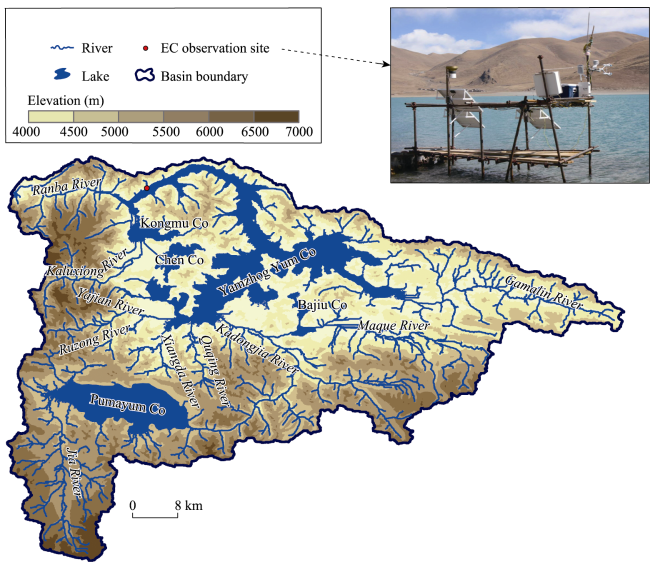
Figure 1 Topography and the observation site of eddy covariance flux in the Yamzhog Yumco basin, Tibet

Note: The photo was taken by Zhang Xueqin at the EC flux observation site on December 31, 2016.

The EC observation system installed in the Yamzhog Yumco consists of four types of electronic sensors. (1) A three-dimensional ultrasonic anemometer (CSAT3, Campbell Scientific®, Inc.) integrated with an open-circuit infrared carbon-water gas analyzer (IRGASON, Campbell Scientific®, Inc.) with a sampling frequency of 10 Hz and installation orientation angles of 170° in 2016 and 178° in 2017. The anemometer was installed 2.1 m above the water surface and calibrated once a year. Besides, the annual fluctuations in lake level were 0.86 m in 2016 and 0.63 m in 2017. (2) Air temperature and humidity sensor (HMP155A, Campbell Scientific®, Inc.), with the integrated circuit of a high-precision moisture-sensitive and temperature-sensitive resistor as the core, allowing stable and continuous humidity and temperature monitoring. (3) Infrared temperature sensor (SI-111, Apogee Instruments®, Inc.) to observe the water surface temperature, calibrated using instrument body temperature monitoring. (4) A four-component radiation sensor (CNR4, Kipp & Zonen®, Netherlands) was installed approximately 1.5 m above the water surface for longwave and shortwave radiation flux observations in both upward and downward directions. The data collector was CR3000-NB-XT (Campbell Scientific®, Inc.), with data recorded in Beijing time.
The EC observation system recorded comprehensive variables such as water-heat flux, turbulence parameters, three-dimensional wind speeds, air temperature, humidity, water surface temperature, and water surface radiation in the Yamzhog Yumco during the non-freezing period (April-December) in 2016 and 2017. Each variable totaled 26,208 records. Specifically, the latent heat flux records were invalid from November to December 2016 when the water vapor sensor failed.

2.2 Methods

2.2.1 Calculation of the turbulent fluxes

The time window of flux calculation was 30 min, i.e., the value of each data point represented the average over the last 30 min. We utilized EddyPro® (LI-COR®, Inc., Version 6.2.0), an eddy covariance calculation software, to carry out the flux calculation and footprint analysis of the raw eddy covariance data (e.g., three-dimensional wind speed, temperature, and water vapor density). Meanwhile, the data processing adopted a series of turbulence dynamics corrections, including wind speed axis rotation (Lee et al., 2004), ultrasonic virtual temperature correction (Van et al., 2004; Lee and Massman, 2011), Webb- Pearman-Leuning density fluctuation correction (Webb et al., 1980), and full-frequency filtered spectrum correction (Fratini et al., 2012). Then, the flux data quality was graded according to the atmospheric steady-state and turbulence condition tests (Göckede et al., 2006): Grade 0 (high quality), Grade 1 (medium quality), and Grade 2 (low quality). Among the observations, the sensible and latent heat flux data in Grade 2 accounted for 16% and 5% of the whole, respectively, and were excluded from this study.
Footprint analysis and source area classification were implemented to obtain water-heat flux data of the lake surface. We selected the footprint analysis method based on the Lagrangian three-dimensional sidewind integral model (Kljun et al., 2004) to extract the flux source area information using EddyPro software. The model is highly reliable when the following preconditions are met. (1) The observed height is lower than the atmospheric boundary layer height; (2) The dynamic and thermal properties of the underlying surface are relatively uniform on the observation scale; (3) The Obukhov stability parameter (Monin and Obukhov, 1954) is within the interval of −200 to 1; (4) The turbulent friction velocity is greater than the threshold value (usually u* ≥ 0.2 m s−1); and (5) The observation height above the surface is greater than 1 m. Here, 2.1% of data that failed to satisfy the above criteria were removed.
The flux representative source region of the lake surface was chosen as the range away from land within 70º to 270º clockwise of the magnetic north of the observation site (Figures 2a and 2b) based on the flux footprint analysis. The distribution patterns of the flux source areas were generally similar in two years. In detail, 90% of the cumulative flux contribution points were mainly distributed within a radius of 400 m from the observation point. Beyond 400 m, 90% of the cumulative flux contribution points decreased sharply and were concentrated in three directions: north by west, west by north, and northeast (Figures 2c and 2d).Besides, the frequency of north-by-west wind direction was higher in 2016 (8%) and 2017 (12%), yet the wind speed was weak. Meanwhile, the strong wind was mainly westerly.
Figure 2 Regional footprints of 90% cumulative flux contribution (2a, 2b) and wind speed and direction distribution (2c, 2d) during the observation period in 2016 and 2017

Note: The red dot in Figures 2a and 2b is the EC observation site, and the inner and outer circles represent the radii at 400 m and 800 m from the observation point, respectively. The percentages in Figures 2c and 2d are the frequencies of wind direction.

Based on source area division and data filtering, the effective sensible heat flux data of the lake surface accounted for 38% (2016) and 37% (2017) of the total observations, with the effective latent heat flux of 26% (2016) and 37% (2017).

2.2.2 Neural network-based interpolation of water-heat flux data

The reliability of the lake surface EC flux data was improved with quality control and source area division processing while reducing the continuity of flux time series. Therefore, we designed the simulation interpolation and validation scheme of Artificial Neural Networks (ANN) for EC turbulence flux data of the lake surface in the Yamzhog Yumco from the perspective of information utilization (Jin and Zhang, 2020). An ultra-wide structure ANN model was constructed for flux interpolation under a Linux environment based on Google’s TensorFlow open-source machine learning framework (Abadi et al., 2016) and CUDA scheme (Garland et al., 2008) parallel computing techniques. Then, we adopted the ten-fold cross-validation method (Kohavi, 1995) to test the flux simulation performance of the ANN model.
Unlike the fixed variable relationship of a dynamic model, the ANN model is trained from samples and has no restrictions on the original form of the input data. All the measured synchronous observation data can be input into the ANN model via the processing of statistical normalization, regardless of data’s diversified differences in time synchronization, spatial scale, dimension, accuracy, sampling rate, and noise level. The variation of input sample combinations will change the model, bringing uncertainties to the simulation results. Therefore, when choosing the information of characteristic variables input to the ANN model, we adopted the principle of combining background forcing information of thermal and dynamic synchronous observations in the turbulent transport process as far as possible. Namely, all observed variables physically related to the turbulent transport process were input into the ANN model, including wind speed, lake surface temperature, air temperature, water vapor pressure, saturated water vapor pressure, turbulent mean kinetic energy, stability, air pressure, and water surface radiation.
Consequently, the ANN model interpolation effectively optimized the temporal consistency of the turbulent flux data over the surface of the Yamzhog Yumco. The temporal coverage of the interpolated flux data improved to over 0.98 from less than 0.40 of the raw flux observation (Jin and Zhang, 2020). Notably, the interpolated flux data was still missing less than 2% due to a lack of water vapor records in November and December 2016 caused by the sensor failure of the EC observation system.
Furthermore, the simulation of the ANN model was robust. On the one hand, the fluxes of effective observations for sensible heat, latent heat, and water vapor at the lake surface of the Yamzhog Yumco averaged 18.8 W m−2, 81.5 W m−2, and 1.84 mmol/(s·m2), respectively. Meanwhile, the mean errors of the three simulated variables were only 5.4 W m−2, 15.7 W m−2, and 0.35 mmol/(s·m2), respectively. On the other hand, the magnitude of error fluctuations among the ten cross-validation groups did not exceed 1 W m−2, 2 W m−2, and 0.05 mmol/(s·m2), respectively. Accordingly, the mean expected errors between the averaged observations and simulations of the cross-validation groups were 2.0%, 1.3%, and 1.8%, respectively. Hence, the flux simulation performance of the ultra-wide ANN model was stable, with low fluctuations in each cross-validation group and the homogeneous symmetry of simulation errors (Jin and Zhang, 2020).
Moreover, the short-term anomalous fluctuation in flux intensity induced by the uneven distribution of raw data was significantly corrected after data interpolation (Figure 3). Remarkably, the interpolated latent heat flux with the fluctuation of ±10 W m−2 on a half-hourly scale disappeared. For the two periods of 0:00−10:00 and 20:00−24:00, both sensible and latent heat fluxes dropped obviously after interpolation, with a more significant diurnal variation. Although there was no substantial change in sensible heat flux during 10:00−20:00, the latent heat flux tended to rise slightly. Overall, the two-year average diurnal variation curve of water-heat flux intensity was smoother after interpolation, demonstrating the improved analyzability of interpolated flux data based on the ANN method to a certain degree. Noteworthy, the fluctuation of the mean value of raw data was attributed to the uneven temporal distribution of the missing observation, and the interpolation model had passed the independent sample test, so the ANN interpolation did not mask the signal of the raw data.
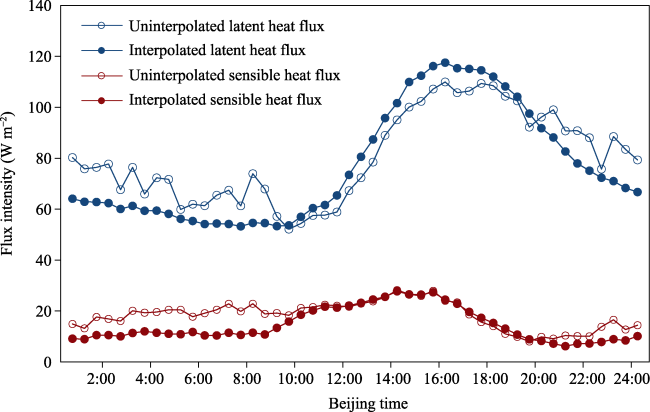
Figure 3 Comparison of the ensembled diurnal variation of water-heat fluxes on a half-hourly scale between the raw and interpolated time series during April-December 2016 and 2017

3 Results

3.1 Water-heat flux variation at the lake surface

We first calculated the monthly average diurnal variation of flux: the half-hourly scale flux averaged over 30 or 31 days per month from April to December 2016 and 2017. On the one hand, the intensity and range of daily fluctuations of latent heat flux were significantly higher than the sensible heat flux at the lake surface of the Yamzhog Yumco (Figure 4). On the other hand, the diurnal average of latent heat flux (sensible heat flux) at the lake surface during the nine-month observation period was 79.2 W m−2 (14.8 W m−2) in 2016 and 74.3 W m−2 (14.3 W m−2) in 2017. The monthly average diurnal variation of latent heat flux at the lake surface fluctuated between 27.3 and 174.9 W m−2, compared with sensible heat flux ranging from −15.4 to 50.7 W m−2.
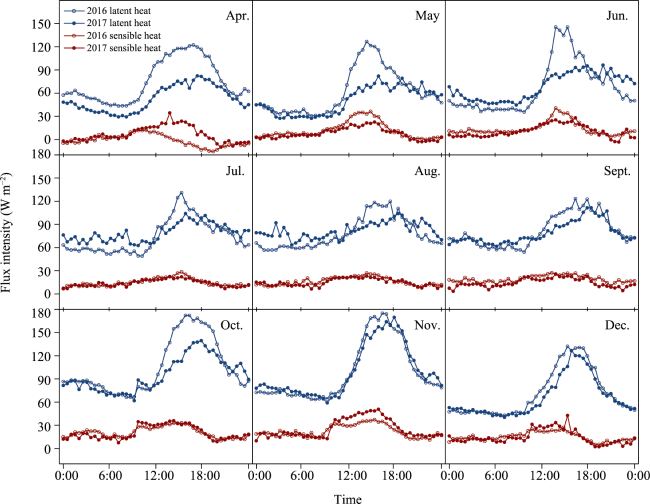
Figure 4 Diurnal variation of monthly average sensible and latent heat flux intensity from April to December 2016 and 2017, with the temporal resolution of 30 minutes
Regarding monthly differences, the diurnal variation of water-heat flux at the lake surface was more considerable during April-June and October-December than during July-September (Figures 4 and 5). The corresponding standard deviations for the diurnal variation of sensible heat flux (latent heat flux) were 10.0 W m−2 (25.9 W m−2), 9.5 W m−2 (34.4 W m−2), and 5.2 W m−2 (17.2 W m−2), respectively. The magnitude and average intensity of the diurnal variation of the water-heat fluxes reached the peaks of the non-freezing period in October and November (Figures 4 and 5) when the lake surface temperature, air temperature, and relative humidity began to decline (Figure 6). Moreover, the average monthly sensible and latent heat fluxes peaked at 25.7 W m−2 (November 2017) and 105.0 W m−2 (October 2016), respectively (Figure 5), roughly lagging one or two months compared to the changes in lake surface temperature (Figure 6c) and humidity (Figure 6b). Notably, April 2016 was the only month with negative values of the water-heat flux during the observation period, with a sensible heat flux of −1.2 W m−2 (Figure 5).
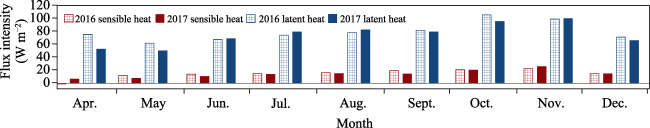
Figure 5 Monthly average intensity variation of sensible and latent heat fluxes from April to December 2016 and 2017
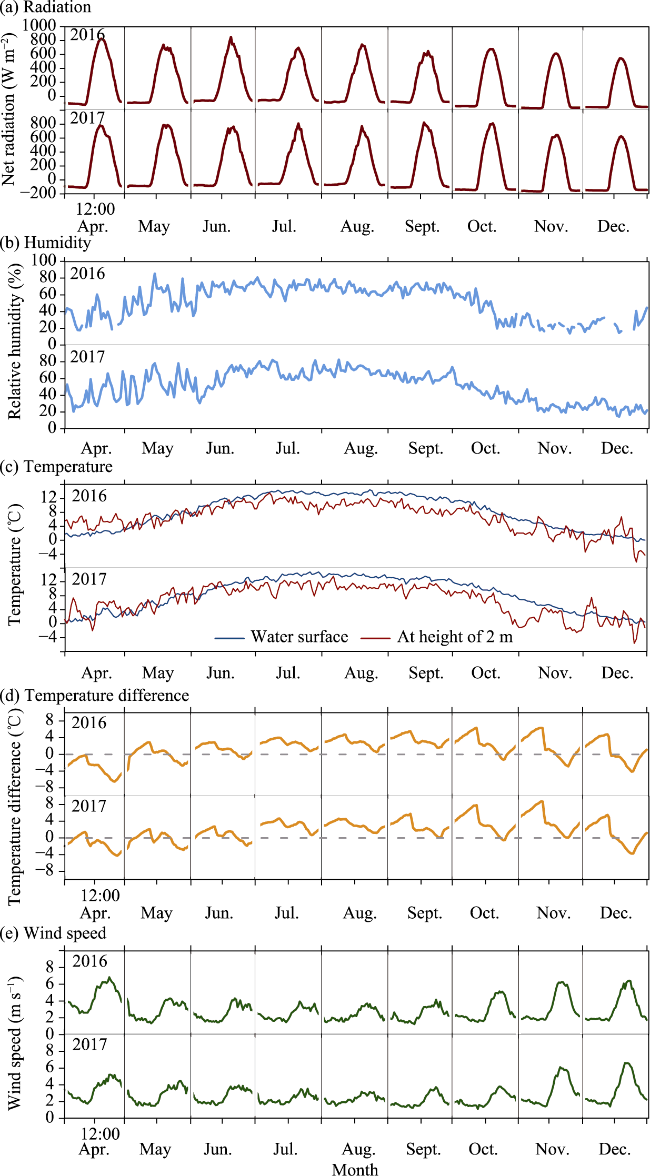
Figure 6 Diurnal variation of lake surface meteorological factors from April to December 2016 and 2017: net radiation intensity (a), relative humidity (b), lake surface temperature and air temperature (c), lake-air temperature difference (d), and wind speed (e)

Note: The time resolution was 30 min for the daily variation of net radiation intensity, lake-air temperature difference, and wind speed, with the 1-d time resolution for relative humidity and temperature. Besides, relative humidity was partially missing in November and December 2016 because of sensor failure.

The diurnal variation of latent heat flux was larger in 2016 than in 2017 (Figure 4). In particular, the peak diurnal variation of latent heat flux exceeded 122 W m−2 in April 2016, compared to less than 83 W m−2 in 2017. Moreover, the average intensity of latent heat flux in April-May 2016 (68.5 W m−2) was significantly higher than the same period in 2017 (51.3 W m−2) (Figure 5). Specifically, the latent heat flux was considerably higher in 2016 (107.9 W m−2) than in 2017 (68.7 W m−2) during 12:00−18:00 (Figure 4). Despite no significant differences in net radiation and temperature gradient between 2016 and 2017, there was a remarkable variation in latent heat flux, which might be attributed to the discrepancy in wind speed at the lake surface in the afternoon (post-12:00). Specifically, the wind speed in the afternoon were notably higher from April to June and October 2016 compared to the same period in 2017 (Figure 6e).

3.2 Variation of meteorological factors at the lake surface

Water surface net radiation, relative humidity, water surface temperature, and air temperature are the critical meteorological factors affecting water-heat flux intensity variation at the lake surface (Nordbo et al., 2011).

3.2.1 Water surface net radiation

The diurnal variation of water surface net radiation is mainly controlled by the solar altitude angle variation, with significant diurnal fluctuations. On the one hand, the monthly average diurnal variation of net radiation over the Yamzhog Yumco was generally consistent during April-December 2016 and 2017, showing a single-peaked distribution and apparent diurnal differences. The peak and trough of the monthly average diurnal variation were concentrated at 12:00−16:00 and 22:00−08:00, respectively (Figure 6a). The average net radiations on the water surface during April-December was 127.4 W m−2 in 2016 and 139.9 W m−2 in 2017, with fluctuations of −110.9 to 706.7 W m−2 in 2016 and −112.8 to 757.1 W m−2 in 2017. The highest diurnal variation peaks of net radiation appeared in June 2016 (852.4 W m−2) and September 2017 (822.5 W m−2), respectively. Besides, the minimum was detected in November 2016 (−169.8 W m−2) and 2017 (−167.9 W m−2).
On the other hand, there was no evident trend for the diurnal variation peak of net radiation on the water surface during the observation period. In contrast, the minimum of net radiation in the period of 22:00−08:00 decreased from September and reached the lowest in October and November. Namely, the energy transported to the atmosphere at night reached its maximum through longwave radiation, corresponding to the remarkable growth of the lake-air temperature difference (Figure 6d) and the wind speed (Figure 6e).

3.2.2 Relative humidity

The characteristics of relative humidity variation were similar during the observation period of two years, with large fluctuations and prominent phase changes within the year (Figure 6b). The average relative humidity was 52.3% (2016) and 50.3% (2017). Moreover, the maximum (minimum) daily relative humidity was 85.5% (14.0%) in 2016 and 82.3% (14.2%) in 2017. The relative humidity fluctuated sharply from early April to early June, rising or falling frequently by as much as 30%−50% within 4-6 days. Then, the relative humidity fluctuations slowed down from mid-June and remained at a high level of about 60%−70% until early October, followed by a decline in late October and a lower level of about 20%−25% until the end of the year.

3.2.3 Lake surface temperature and lake temperature

The changes in temperature near the lake surface were generally close to temperature at a height of 2 m above the water surface (air temperature for short) in the Yamzhog Yumco during the observation period. However, the air temperature fluctuated more dramatically, especially during the warming phase from April to May and the cooling phase from late October to December (Figure 6c). The lake surface temperatures (air temperatures) of average, minimum, and maximum were 8.1℃ (6.7℃), −0.3℃ (−6.2℃), and 14.4℃ (13.5℃) in 2016, respectively. Correspondingly, the mean, minimum, and maximum lake surface temperatures (air temperatures) were 8.3℃ (6.6℃), 0℃ (−5.7℃), and 14.8℃ (13.5℃) in 2017, respectively.
In detail, the air temperature was overall higher than the lake surface temperature from April to May 2016 and 2017, compared with apparently higher lake surface temperature than the air temperature from June to November. Since mid-June, the lake surface temperature had remained above 8℃, higher than the air temperature. In contrast, it had dropped slowly since late October. Nevertheless, the air temperature in both years experienced a significant fluctuation of quick decline from roughly 8.0℃ to around −1℃ and then a rapid rise within just 20 days from late October to early November, sharply contrasting with the simultaneously stable decline of lake surface temperature. Consequently, a maximum lake-air temperature difference of 6.3℃ (2016) and 8.1℃ (2017) were detected throughout the observation period.
There was a striking diurnal variation of lake-air temperature difference in the Yamzhog Yumco (Figure 6d). The air above the lake surface warmed up faster than the lake surface since 10:30, leading to the declined lake-air temperature difference. The air temperature exhibited a fluctuating warming lasting one or two hours around noon. Subsequently, the lake-air temperature difference dropped rapidly until 23:00, reaching the lowest. Then, the air temperature dropped faster than the lake surface temperature, resulting in a larger lake-air temperature difference until sunrise the next day.

3.2.4 Wind speed

The daily variation of the horizontal mean wind speed at the height of 2 m above the lake surface (Figure 6e) was similar to that of water-heat flux in the Yamzhog Yumco (Figure 4). The fluctuation of daily wind speed variation was more prominent in April-June and October-December than in July-September. Besides, the wind speed generally shifted from a slow decline to a sharp rise around noon in months with considerable fluctuations of daily variation in April, May, November, and December, which was close to the daily variation of water-heat fluxes in April-June and October-December.
The similarity between the daily variation in wind speed and water-heat flux can be explained by the dynamical and thermodynamic conditions under which atmospheric turbulence occurs. The dynamical and thermodynamic conditions refer to the apparent wind shear and certain instability in the air layer, respectively. The height of about 2 m is already the near-boundary layer of the lake surface, which is smoother than the land surface. Thus, the wind kinetic energy required to trigger turbulence is relatively more tremendous. For instance, the peak of daily variation of the mean wind speed reached 5 m s−1 or even over 6 m s−1 in April, May, November, and December (Figure 6e). When the wind speed at the lake surface increases sharply, the wind shear provides the dynamic conditions for the atmospheric turbulent motion, with higher wind speed accelerating the turbulent transport process. Notably, such a dynamical effect on the intensity of turbulent flux is much higher than that of the thermodynamic factors.

3.3 Meteorological controls of water-heat flux variation at the lake surface

3.3.1 Half-hourly scale

We utilized the Pearson correlation coefficient to measure the linear relationship between meteorological factors and the intensity variations of water-heat fluxes on multiple timescales of half-hour, daily average, and monthly average (Table 1). On the half-hourly scale, the water-heat fluxes on the lake surface of the Yamzhog Yumco were statistically positively correlated with each meteorological factor and passed the significance test of p = 0.01 during the observation period (April-December 2016 and 2017). Specifically, only the latent heat flux showed a strong statistically positive correlation with wind speed and e-U synergy, with correlation coefficients of 0.71 and 0.67, respectively. Meanwhile, the correlation coefficients of sensible and latent heat fluxes with other meteorological factors were less than 0.5.
Table 1 Pearson correlation coefficients between flux intensity and meteorological factors on the half-hourly, daily, and monthly average timescales
Flux Factor Half-hourly Daily Monthly
Sensible heat Wind speed 0.18** −0.04 −0.46
Lake-air temperature difference 0.27** 0.68** 0.87**
Net radiation 0.29** −0.41** −0.65**
Latent heat Wind speed 0.71** 0.42** −0.13
Water vapor pressure deficit 0.42** 0.27** 0.26
Net radiation 0.30** −0.22** −0.53
e-U synergy 0.67** 0.44** 0.02

Note: ** indicates that the correlation coefficient passed the significance test of p = 0.01. The e-U synergy is the variable multiplied by the water vapor pressure deficit and wind speed.

Compared with previous observational studies of alpine lakes in the northern Qinghai-Tibet Plateau (Li et al., 2015; Wang et al., 2015; 2017), the statistical correlation of latent heat flux and wind speed (0.71) was slightly higher than that of latent heat flux and e-U synergy (0.67), on the half-hourly scale in the Yamzhog Yumco, southern plateau. On the same scale, the correlation coefficients of latent heat flux with wind speed and e-U synergy were 0.48 and 0.67 in Nam Co, respectively (Wang et al., 2015). Additionally, the latent heat flux correlation coefficient with e-U synergy was 0.75 in Ngoring Lake, significantly higher than that solely correlated to wind speed (Li et al., 2015).
At the same time, there were weak statistically positive correlations on the half-hourly scale between surface lake sensible heat flux and wind speed, lake-air temperature difference, and net radiation. Remarkably, the statistical correlations of sensible heat flux with lake-air temperature difference or net radiation flux were slightly more significant than wind speed (Table 1). Therefore, the diurnal variation of sensible heat flux on the half-hourly scale resulted from the combined effects of multiple meteorological factors such as lake surface net radiation intensity, lake-air temperature difference, and wind speed.

3.3.2 Daily scale

Except for the relationship between sensible heat flux and wind speed, the lake surface water-heat flux on a daily scale was statistically correlated with all other meteorological factors and passed the significance test of p=0.01 during the observation period of April-December 2016 and 2017 in the Yamzhog Yumco. Among them, the highest correlation coefficient (0.68) was found between sensible heat flux and lake-air temperature difference, reflecting their solid statistical positive correlation. Compared to the half-hourly scale, the correlation coefficients of latent heat flux on the daily scale with meteorological factors (i.e., wind speed, water vapor pressure deficit, and e-U synergy) were significantly lower (Table 1). Moreover, the sensible and latent heat fluxes were negatively correlated to the water surface net radiation in the Yamzhog Yumco during the observation period, with correlation coefficients of −0.41 and −0.22, respectively.

3.3.3 Monthly scale

During the observation period (April-December 2016 and 2017), only the sensible heat flux strongly correlated with lake-air temperature difference and lake surface net radiation at monthly scale and passed the significance test of p = 0.01 (Table 1). In particular, lake surface sensible flux was most significantly correlated with lake-air temperature difference with a correlation coefficient of 0.87. Besides, a strong negative correlation (−0.65) at the significance level of p= 0.01 was detected between the sensible heat flux and the lake surface net radiation.

3.3.4 Meteorological controls of water-heat fluxes on different timescales

Among meteorological factors, the lake-air temperature difference was the most significantly positively correlated with the sensible heat flux, followed by net radiation flux; the main meteorological controls were wind speed and e-U synergy for the latent heat flux on half-hourly and daily scales (Table 1). Then, based on Table 1, we performed a regression analysis between water-heat fluxes and meteorological factors with the highest correlation coefficients on multiple timescales (Figure 7).
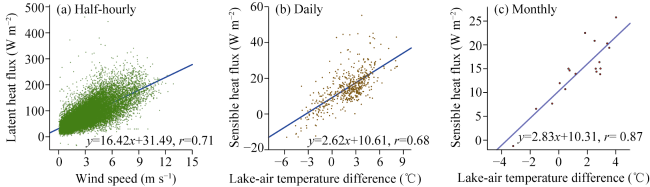
Figure 7 Regression relationship between half-hourly scale latent heat flux and wind speed (a), daily average scale sensible heat flux and the lake-air temperature difference (b), and monthly average scale sensible heat flux and the lake-air temperature difference (c) during April-December 2016 and 2017

Note: The sample sizes on half-hourly, daily, and monthly scales are 26208, 546, and 18, respectively.

The statistical correlation between latent heat flux and wind speed was the highest on the half-hourly scale (Figure 7a). The wind speed ranging from 0 m s−1 to 6 m s−1 was relatively more concentrated in the fitting line, while the fitting degree gradually declined with the increasing wind speed over 6 m s−1. On the daily scale, the sensible heat flux was the highest statistically correlated with the lake-air temperature difference, with the more uniform fitting relationships within −6℃ to 6℃ (Figure 7b). Meanwhile, the most significant statistical correlations were found for sensible heat flux and lake-temperature difference on the monthly scale, which fit well in the range of −1.5℃ to 4℃ (Figure 7c).

4 Discussion

Notably, the lake surface net radiation intensity was significantly negatively correlated with the lake surface sensible and latent heat fluxes on a daily scale and with the sensible heat flux on a monthly scale in the Yamzhog Yumco, with correlation coefficients of −0.41, −0.22, and −0.65, respectively (Table 1). Previous studies on other alpine lakes have not reported the negative correlations between the water-heat fluxes and the net radiation disclosed here. Here, we tried to explore the possible physical mechanism behind the unique phenomenon qualitatively.
On the daily scale, the lake surface net radiation exhibited remarkable diurnal variation (Figure 6a). We can discuss the negative relationship between lake face heat flux and net radiation from the following two assumptions. The first assumption is to keep the sunshine constant (i.e., the downward solar radiation reaching the lake surface is stable) and the lake surface temperature drop. As we know, the intensity of upward longwave radiation at the lake surface primarily depends on the temperature of the lake body itself. So, under the first assumption, the water body’s longwave radiation to the atmosphere will fall, resulting in rising downward net radiation. Meanwhile, the decline of lake surface water temperature will lead to the intensity reduction of sensible and latent heat flux. Thus, a statistically negative correlation between reduced lake surface heat flux and rising net radiation will be established. A similar relationship is also observed in the case of Poyang Lake in the lowland areas of East China (Cui et al., 2021).
The second assumption is to consider reducing solar radiation, leading to a decline in lake surface net radiation and the lake surface temperature and air temperature. According to thermodynamic theory, air temperature drops faster than water temperature because of the discrepancy in lake-air heat capacity (Howell et al., 2015). Consequently, the lake-air temperature difference and the water-heat flux intensity at lake surface will rise. In this case, the water-heat flux intensity will negatively correlate with the lake surface net radiation flux. Therefore, the daily water-heat flux intensity and lake surface net radiation will negatively correlate, whether only assuming decreased lake surface temperature or simultaneously with air temperature, and vice versa.
On the monthly average scale, the lake surface net radiation was relatively higher from June to August (Figure 6a). Nevertheless, jointly controlled by higher relative humidity and air temperature (Figures 6b and 6c), the water-heat transport from the lake surface to the atmosphere remained low (Figures 4 and 5). Besides, the lake surface net radiation weakened and was even negative at night in October and November (Figure 6a). Yet the water-heat flux intensity reached the highest within the observation period (Figures 4 and 5) because of the striking rise in the lake-air temperature difference (Figure 6d). Hence, the statistically negative correlation between sensible heat flux and lake surface net radiation was reasonable on a monthly scale (Table 1).
To sum up, the statistically negative correlation between the lake surface water-heat flux and the net radiation flux can be explained by the seasonal variation of lake surface net radiation, and the phase discrepancy of water-heat flux intensity variation jointly caused by the lake-air temperature difference and the lake-air heat capacity contrast in the Yamzhog Yumco.

5 Conclusions

This paper explored for the first time the water-heat flux variation and its correlation with meteorological factors on half-hourly, daily, and monthly scales in the Yamzhog Yumco, based on the eddy-covariance turbulent flux and meteorological factor observation during the non-freezing period (April-December) 2016 and 2017, with flux source area delineation and artificial neural network data interpolation.
Firstly, the average latent heat flux at the lake surface was significantly higher than the average sensible heat flux in the Yamzhog Yumco, namely, 79.2 W m−2 and 14.8 W m−2 in 2016, and 74.3 W m−2 and 14.3 W m−2 in 2017, respectively. The diurnal variation of water-heat flux was more considerable in April-June and October-December than in July- September. Specifically, both monthly average sensible (25.76 W m−2 in November 2017) and latent heat fluxes (105.07 W m−2 in October 2016) peaked, with a 1−2 month lag behind the change in lake surface temperature. The time-lag effect demonstrates the dominant control of higher temperature and relative humidity and larger heat capacity of the lake itself on the lake-air energy exchange during July-September.
Secondly, the sensible heat flux of the lake surface significantly correlated to the lake-air temperature difference and lake surface net radiation in the Yamzhog Yumco on half-hourly, daily, and monthly scales, with a significance level of p = 0.01. In particular, the lake-air temperature difference had the most statistically significant and stable correlation with the sensible heat flux. Meanwhile, the latent heat flux was significantly correlated with wind speed, e-U synergy, water vapor pressure deficit, and net radiation on half-hourly and daily scales at the significance level of p = 0.01, with statistically significant positive correlations with wind speed and e-U synergy.
Remarkably, the lake surface net radiation intensity was significantly negatively correlated with the lake surface sensible and latent heat fluxes on a daily scale and with the sensible heat flux on a monthly scale in the Yamzhog Yumco, with the correlation coefficients of −0.41, −0.22, and −0.65, respectively. The statistically negative correlation between the lake surface water-heat flux and the net radiation can be explained by the seasonal variation of lake surface net radiation, and the phase discrepancy of water-heat flux intensity variation caused by the lake-air temperature difference and the lake-air heat capacity contrast.
[1]
Abadi M, Agarwal A, Barham P et al., 2016. TensorFlow: Large-scale machine learning on heterogeneous distributed systems. Proceedings of the 12th USENIX Symposium on Operating Systems Design and Implementation, USA,265−283.

[2]
Biermann T, Babel W, Ma W Q et al., 2014. Turbulent flux observations and modelling over a shallow lake and a wet grassland in the Nam Co basin, Tibetan Plateau. Theoretical and Applied Climatology, 116(1/2): 301−316.

[3]
Chen D L, Xu B Q, Yao T D et al., 2015. Assessment of past, present and future environmental changes on the Tibetan Plateau. Chinese Science Bulletin, 60(32): 3025−3035. (in Chinese)

[4]
Chu D, Pu Q, Laba Z et al., 2012. Remote sensing analysis on lake area variation of Yamzho Yumco in Tibetan Plateau over the 40a. Journal of Lake Sciences, 24(3): 494−502.

[5]
Cui Y F, Liu Y B, Gan G J et al., 2020. Hysteresis behavior of surface water fluxes in a hydrologic transition of an ephemeral lake. Journal of Geophysical Research: Atmospheres, 125: e2019JD032364. doi: 10.1029/2019JD032364.

[6]
Cui Y F, Zhang X Q, Liu Y B, 2021. Radiative and aerodynamic contribution to evaporation: Eddy-covariance comparison between a plain and a plateau lake. Earth and Space Science, 8: e2021EA001913. doi: 10.1029/2021EA001913.

[7]
Dutra E, Stepanenko V M, Balsamo G et al., 2010. An offline study of the impact of lakes on the performance of the ECMWF surface scheme. Boreal Environment Research, 15(2): 100−112.

[8]
Fratini G, Ibrom A, Arriga N et al., 2012. Relative humidity effects on water vapor fluxes measured with closed-path eddy-covariance systems with short sampling lines. Agricultural and Forest Meteorology, 165: 53−63.

[9]
Garland M, Le Grand S, Nickolls J et al., 2008. Parallel computing experiences with CUDA. IEEE Micro Conference, USA, 28(4): 13−27.

[10]
Göckede M, Markkanen T, Hasager C B et al., 2006. Update of a footprint-based approach for the characterization of complex measurement sites. Boundary-Layer Meteorology, 118(3): 635−655.

[11]
Hack J J, Caron J M, Yeager S G et al., 2006. Simulation of the global hydrological cycle in the CCSM Community Atmosphere Model version 3 (CAM3): Mean features. Journal of Climate, 19(11): 2199-2221.

DOI

[12]
Han W, Zhang E L, Sun W W et al., 2023. Anthropogenic activities altering the ecosystem in Lake Yamzhog Yumco, southern Qinghai-Tibetan Plateau. Science of The Total Environment, 904: 166715. doi: 10.1016/j.scitotenv.2023.166715.

[13]
Howell J R, Mengüç M P, Siegel R, 2015. Thermal Radiation Heat Transfer. 6th ed. USA: CRC Press, 70−78.

[14]
Jin Z, Zhang X Q, 2020. Optimization method for alpine lake turbulent flux data based on micro-meteorological information utilization. Journal of Lake Sciences, 32(3): 877−886. (in Chinese)

[15]
Kljun N, Kastner-Klein P, Fedorovich E et al., 2004. Evaluation of Lagrangian footprint model using data from wind tunnel convective boundary layer. Agricultural and Forest Meteorology, 127(3/4): 189−201.

[16]
Kohavi R, 1995. A study of cross-validation and bootstrap for accuracy estimation and model selection. International Joint Conference on Artificial Intelligence, USA, 14(2): 1137−1145.

[17]
Laba Z, Ci Z, La B et al., 2012. Characteristics of climate change at Yamdrog Yumtso lake during the 1971−2009. Journal of Tibet University (Natural Science Edition), 27(1): 15−19.

[18]
Lee X, Finnigan J, Paw U, K T, 2004. Coordinate systems and flux bias error. In: Lee X, Massman W, Law B (eds). Handbook of Micrometeorology. Atmospheric and Oceanographic Sciences Library, Vol 29. Dordrecht: Springer. doi: 10.1007/1-4020-2265-4_3.

[19]
Lee X H, Liu S D, Xiao W et al., 2014. The Taihu eddy flux network: An observational program on energy, water, and greenhouse gas fluxes of a large freshwater lake. Bulletin of the American Meteorological Society, 95(10): 1583−1594.

[20]
Lee X H, Massman W J, 2011. A perspective on thirty years of the Webb, Pearman and Leuning density corrections. Boundary-Layer Meteorology, 139(1): 37−59.

[21]
Li X Y, Ma Y J, Huang Y M et al., 2016. Evaporation and surface energy budget over the largest high-altitude saline lake on the Qinghai-Tibet Plateau. Journal of Geophysical Research: Atmospheres, 121(10): 470-485.

[22]
Li Z G, Lyu S H, Ao Y H et al., 2015. Long-term energy flux and radiation balance observations over Lake Ngoring, Tibetan Plateau. Atmospheric Research, 155: 13−25.

[23]
Liu H Z, Feng J W, Sun J H et al., 2015. Eddy covariance measurements of water vapor and CO2 fluxes above the Erhai lake. Science China Earth Sciences, 58(3): 317−328.

[24]
Liu Y B, Qiu G Y, Zhang H S et al., 2022. Shifting from homogeneous to heterogeneous surfaces in estimating terrestrial evapotranspiration: Review and perspectives. Science China Earth Sciences, 65(2): 197−214.

[25]
Ma R H, Yang G S, Duan H T et al., 2011. China’s lakes at present: Number, area and spatial distribution. Science China Earth Sciences, 54(2): 283−289.

[26]
Monin A S, Obukhov A M, 1954. Basic laws of turbulent mixing in the surface layer of the atmosphere. Contributions to Geophysics Institute of Academy Sciences, 24(151): 163−187.

[27]
McGloin R, McGowan H, McJannet D et al., 2014. Quantification of surface energy fluxes from a small water body using scintillometry and eddy covariance. Water Resources Research, 50(1): 494−513.

[28]
Nordbo A, Launiainen S, Mammarella I et al., 2011. Long-term energy flux measurements and energy balance over a small boreal lake using eddy covariance technique. Journal of Geophysical Research: Atmospheres, 116(2): D02119. doi: 10.1029/2010JD014542.

[29]
Ren X Q, Sun S F, Chen W et al., 2013. A review of researches on the lake numerical modeling. Advances in Earth Sciences, 28(3): 347−356. (in Chinese)

[30]
Sang Y F, Chen D, Gong T, 2020. What caused the decline of water level of Yamzho Yumco during 1975-2012 in the southern Tibetan Plateau? Journal of Geophysical Research: Atmospheres, 125, e2019JD031121. doi: 10.1029/2019JD031121.

[31]
Schindler D W, Bayley S E, Parker B R et al., 1996. The effects of climatic warming on the properties of boreal lakes and streams at the Experimental Lakes Area, northwestern Ontario. Limnology and Oceanography, 41(5): 1004−1017.

[32]
Segal M, Arritt R W, 1992. Nonclassical mesoscale circulations caused by surface sensible heat-flux gradients. Bulletin of the American Meteorological Society, 73(10): 1593−1604.

[33]
Shen P K, 2018. Observations and analyses of atmospheric turbulence in the Yamzhog Yumco Basin, south Tibet[D]. Beijing: University of Chinese Academy of Sciences, 1−72 (in Chinese)

[34]
Shen P K, Zhang X Q, 2019. Observation of atmospheric turbulence characteristics over the Yamzhog Yumco, south Tibet. Journal of Lake Sciences, 31(1): 243−255. (in Chinese)

[35]
Tang H D, Cidan Y, Zeng C et al., 2021. Characteristics of the lake water level changes and influencing factors in Yamzhog Yumco in Tibet from 1974−2019. Journal of Arid Land Resources and Environment, 35(4): 83−89.

[36]
Tanny J, Cohen S, Assouline S et al., 2008. Evaporation from a small water reservoir: Direct measurements and estimates. Journal of Hydrology, 351(1/2): 218−229.

[37]
Van Dijk A, Moene A F, De Bruin H A, 2004. The principles of surface flux physics: Theory, practice and description of the ECPACK library. Netherlands: Meteorology and Air Quality Group, Wageningen University, 99: 525.

[38]
Wang B B, Ma Y M, Chen X L et al., 2015. Observation and simulation of lake-air heat and water transfer processes in a high-altitude shallow lake on the Tibetan Plateau. Journal of Geophysical Research: Atmospheres, 120(24): 12327−12344.

[39]
Wang B B, Ma Y M, Ma W Q et al., 2017. Physical controls on half-hourly, daily, and monthly turbulent flux and energy budget over a high-altitude small lake on the Tibetan Plateau. Journal of Geophysical Research: Atmospheres, 122(4): 2289−2303.

[40]
Webb E K, Pearman G I, Leuning R, 1980. Correction of flux measurements for density effects due to heat and water vapor transfer. Quarterly Journal of Royal Meteorological Society, 106(447): 85−100.

[41]
Yao T D, Piao S L, Shen M G et al., 2017. Chained impacts on modern environment of interaction between westerlies and Indian monsoon on Tibetan Plateau. Bulletin of Chinese Academy of Sciences, 32(9): 976−984. (in Chinese)

[42]
Zhang X Q, Sun R, Zhu L P, 2012. Lake water in the Yamzhog Yumco basin in south Tibetan region: Quality and evaluation. Journal of Glaciology and Geocryology, 34(4): 950−958. (in Chinese)

[43]
Zhao X S, Liu Y B, 2017. Phase transition of surface energy exchange in China’s largest freshwater lake. Agricultural and Forest Meteorology, 244: 98−110.

[44]
Zhao X S, Liu Y B, 2018. Variability of surface heat fluxes and its driving forces at different time scales over a large ephemeral Lake in China. Journal of Geophysical Research: Atmospheres, 123: 4939−4957.

[45]
Zhao X S, Wang S G, Li M et al., 2014. Energy flux measurements and environmental controls in summer over the Poyang Lake, China. Journal of Lake Sciences, 26(6): 955−962. (in Chinese)

[46]
Zhou S, Kang S, Gao T et al., 2010. Response of Zhadang Glacier runoff in Nam Co Basin, Tibet, to changes in air temperature and precipitation form. Chinese Science Bulletin, 55: 2103-2110.

DOI

[47]
Zhu L P, Peng P, Zhang G Q et al., 2020. The role of Tibetan Plateau lakes in surface water cycle under global changes. Journal of Lake Sciences, 32(3): 597−608. (in Chinese)

[48]
Zhu L P, Wang J B, Ju J T et al., 2019. Climatic and lake environmental changes in the Serling Co region of Tibet over a variety of timescales. Science Bulletin, 64(7): 422−424.

Outlines

/