Research Articles

Spatiotemporal differentiation and attribution of land surface temperature in China in 2001-2020

  • TIAN Hao , 1, 2, 3 ,
  • LIU Lin , 1, 2, * ,
  • ZHANG Zhengyong 1, 2 ,
  • CHEN Hongjin 1, 2 ,
  • ZHANG Xueying 1, 2 ,
  • WANG Tongxia 1, 2 ,
  • KANG Ziwei 1, 2
Expand
  • 1. Shihezi University, Shihezi 832000, Xinjiang, China
  • 2. Key Laboratory of Oasis Town and Mountain-basin System Ecology of Xinjiang Bingtuan, Shihezi 832003, Xinjiang, China
  • 3. Key Laboratory of Modern Water-Saving Irrigation of Xinjiang Production & Construction Group, Shihezi 832003, Xinjiang, China
*Liu Lin (1981-), Professor, specialized in GIS application and remote sensing research of resources and environment. E-mail:

Tian Hao (1996-), PhD Candidate, specialzed in GIS analysis and geoscience application research. E-mail:

Received date: 2023-10-30

  Accepted date: 2023-12-08

  Online published: 2024-02-06

Supported by

National Natural Science Foundation of China(41461086)

National Natural Science Foundation of China(41761108)

Abstract

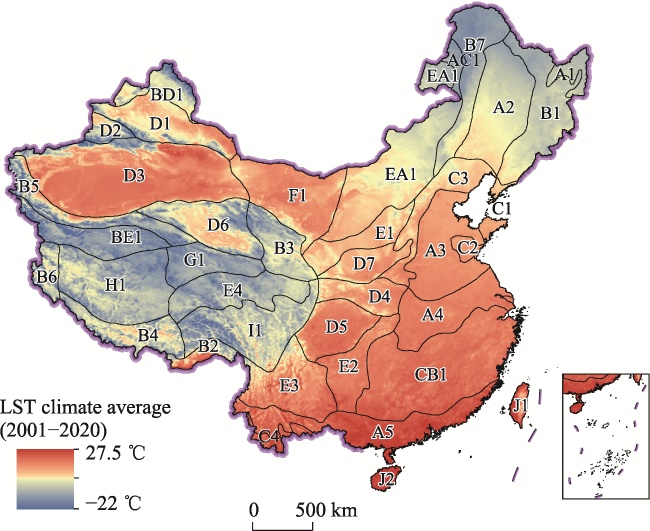
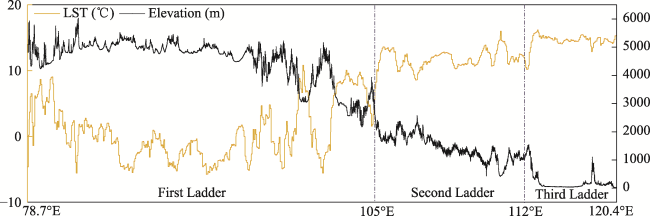
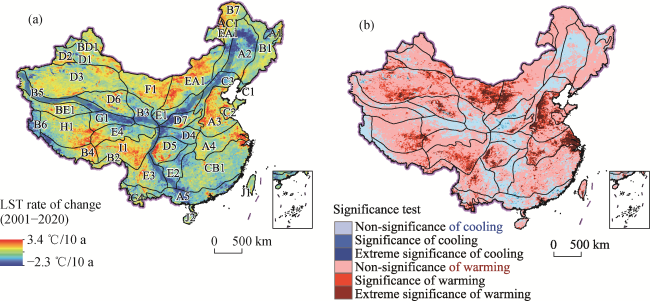
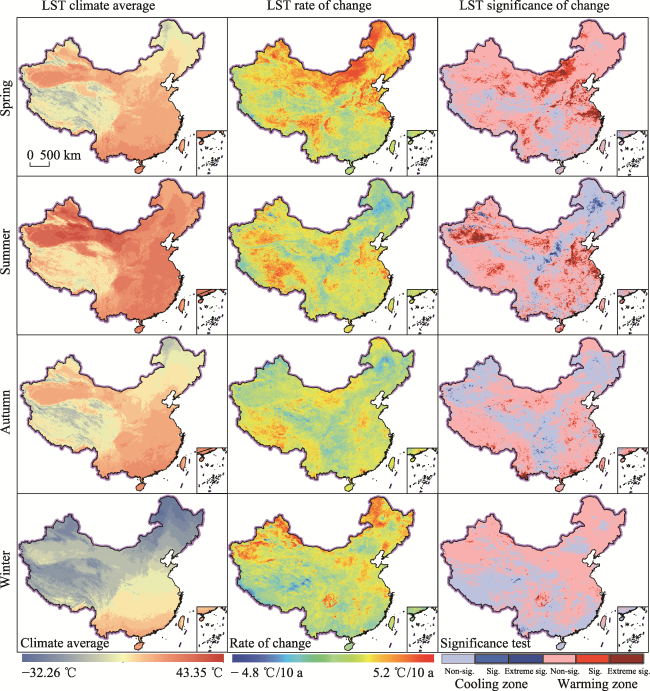
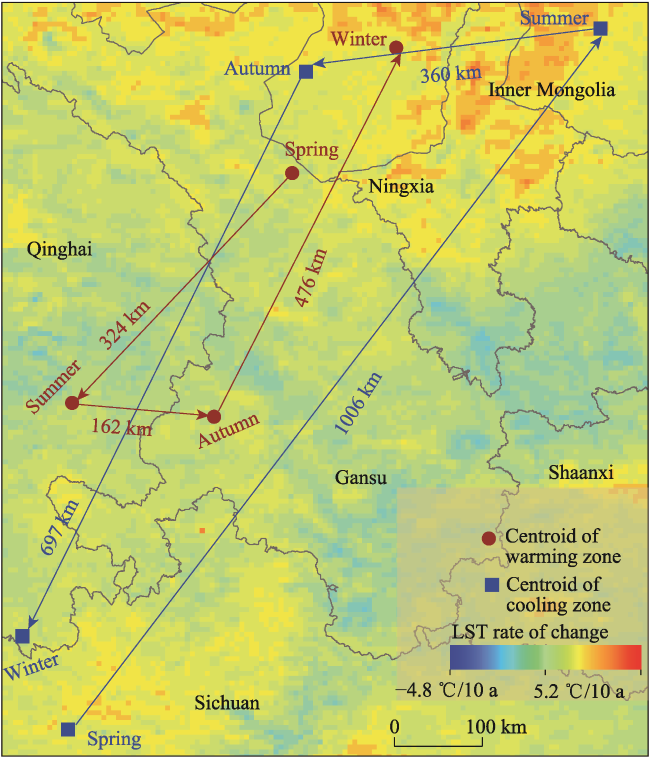
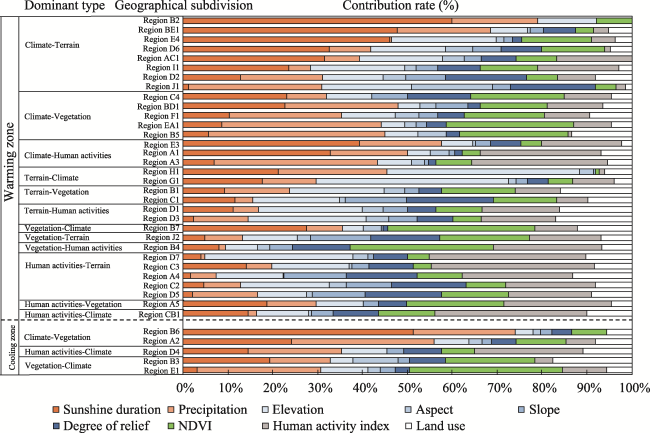
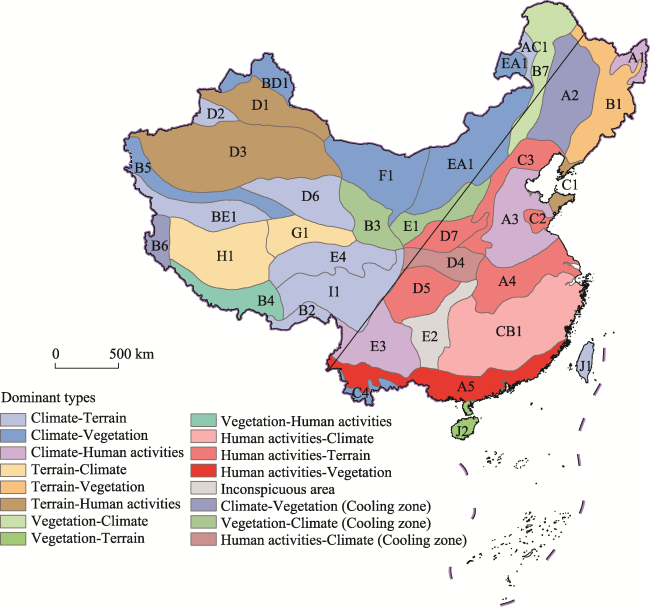
The variation of land surface temperature (LST) has a vital impact on the energy balance of the land surface process and the ecosystem stability. Based on MDO11C3, we mainly used regression analysis, GIS spatial analysis, correlation analysis, and center-of -gravity model, to analyze the LST variation and its spatiotemporal differentiation in China from 2001 to 2020. Furthermore, we employed the Geodetector to identify the dominant factors contributing to LST variation in 38 eco-geographic zones of China and investigate the underlying causes of its pattern. The results indicate the following: (1) From 2001 to 2020, the LST climate average in China is 9.6℃, with a general pattern of higher temperatures in the southeast and northwest regions, lower temperatures in the northeast and Qinghai-Tibet Plateau, and higher temperatures in plains compared to lower temperatures in mountainous areas. Generally, LST has a significant negative correlation with elevation, with a correlation coefficient of -0.66. China’s First Ladder has the most pronounced negative correlation, with a correlation coefficient of -0.76 and the lapse rate of LST is 0.57℃/100 m. (2) The change rate of LST in China during the study is 0.21℃/10 a, and the warming area accounts for 78%, demonstrating the overall spatial pattern a “multi-core warming and axial cooling”. (3) LST’s variation exhibits prominent seasonal characteristics in the whole country. The spatial distribution of average value in winter and summer differs significantly from other seasons and shows more noticeable fluctuations. The centroid trajectory of the seasonal warming/cooling area is close to a loop shape and displays corresponding seasonal reverse movement. Cooling areas exhibit more substantial centroid movement, indicating greater regional variation and seasonal variability. (4) China’s LST variation is driven by both natural influences and human activities, of which natural factors contribute more, with sunshine duration and altitude being key factors. The boundary trend between the two dominant type areas is highly consistent with the “Heihe-Tengchong Line”. The eastern region is mostly dominated by human activity in conjunction with terrain factors, while the western region is predominantly influenced by natural factors, which enhance/weaken the change range of LST through mutual coupling with climate, terrain, vegetation, and other factors. This study offers valuable scientific references for addressing climate change, analyzing surface environmental patterns, and protecting the ecological environment.

Cite this article

TIAN Hao , LIU Lin , ZHANG Zhengyong , CHEN Hongjin , ZHANG Xueying , WANG Tongxia , KANG Ziwei . Spatiotemporal differentiation and attribution of land surface temperature in China in 2001-2020[J]. Journal of Geographical Sciences, 2024 , 34(2) : 375 -396 . DOI: 10.1007/s11442-024-2209-z

1 Introduction

Land surface temperature (LST) directly affects the energy balance of the Earth’s land surface system. It is a critical parameter in the geophysical cycle process and an essential indicator in the research fields of environment, ecology, climate, hydrology, agriculture, and more (Hu, 2013; Qiao and Tian, 2015; Qiao et al., 2019; Shen and Zeng, 2021).
Currently, research on LST predominantly focuses on urban heat island effect (Qiao et al., 2014; Li et al., 2016a; Ren et al., 2021; Yang et al., 2021), local drought monitoring (Bao et al., 2014; Wang et al., 2017), frozen soil freezing and thawing characteristics analysis (Yue et al., 2021), regional ecological environment quality assessment, and other related aspects. However, there is a notable gap in the research of spatiotemporal pattern differentiation and change-driving mechanisms at larger scales such as the national and global levels, especially comprehensive and in-depth studies on the zonal similarities and regional differences in large-scale regions are lacking. China’s diverse climate and terrain topography, influenced by various natural geographical environments and varying levels of human activities, make LST show distinct regional characteristics and spatiotemporal differences (Huang et al., 2011; Jiang et al., 2016; Zhao et al., 2020). These differences have a significant impact on the formation and evolution of the regional ecological environment and the transformation and transformation of production mode. Therefore, a comprehensive analysis of the spatiotemporal distribution pattern of LST in China can provide a scientific basis for regional resource conservation and development, agricultural production distribution, meteorological disaster prevention, and other aspects. Additionally, exploring the spatial heterogeneity and evolution characteristics of LST in China’s eco-geographic zones will provide essential theoretical support for climate change monitoring and solution, surface environmental model analysis, etc.
The actual measurement of meteorological stations is a precise and reliable means of obtaining LST data. However, due to the limited number of stations and their uneven distribution, it is challenging to detailed characterizations of LST in complex terrains or remote areas. With the development and application of remote sensing technology, remote sensing quantitative inversion based on various satellite data sources such as Landsat, MODIS, AVHRR, ASTER, and others provide a new approach for acquiring large-scale, spatiotemporally continuous LST rapidly. Among them, the MODIS land surface temperature product, with its excellent spatiotemporal resolution, meets the requirements for research at large and medium scales (Li et al., 2016b; Ma et al., 2017; Wang, 2017). It has achieved promising results in temperature inversion studies in regions such as the Heihe River Basin, permafrost region of Northeast China, and Tianshan Mountains (Zhou et al., 2009; Guan et al., 2011; Wang et al., 2012; Yao et al., 2012; Yang et al., 2015; Liu et al., 2017), demonstrating its scientific and reliable characterization for surface energy in complex terrains. In previous studies, LST was often used as a research focus to analyze its changing characteristics or as an essential indicator to explore the internal mechanisms of other geographical phenomena or processes. However, due to differences in data sources and types, time series, processing methods, there exists some uncertainty or even difficulty in comparing the spatiotemporal heterogeneity of LST across regions among different studies. Therefore, using data with the same processing standard, the same scale, and appropriate accuracy is the premise and key to conducting nationwide-scale LST research. By employing consistent spatiotemporal datasets and change drivers, it is possible to objectively investigate and compare the spatiotemporal heterogeneity and underlying pattern causes of LST at the national scale.
China’s diverse geographical characteristics, such as diverse climate types, complex terrain topography and geomorphology, varied ecological environment, and varying degrees of human activities, result in distinct combinations of factors influencing LST changes within different eco-geographic zones. The interaction and combination of these factors contribute to the diversity and complexity of LST variation (Sun et al., 2014; Jiang et al., 2018; Hu et al., 2020). Therefore, based on a comprehensive consideration of various geographical space and ecological environment factors, it is essential to seek appropriate geostatistical analysis methods for identifying and interpreting the dominant factors and types of LST changes within different regions. Geodetector can comprehensively characterize the spatial heterogeneity of geographical things and objectively reflect the priority of each element’s impact within geographical complexes (Wang and Xu, 2017). They have achieved substantial success in fields such as quantitative analysis of driving forces, spatial division of ecological geography, and health risk assessment (Dong et al., 2017; Kou et al., 2020; Pan et al., 2020; Ding and Xing, 2021; Dong et al., 2021; Gao et al., 2021; Zhang et al., 2021). The core hypothesis of Geodetector, which states that “if the independent variable has a significant influence on the dependent variable, they have a certain similarity in spatial distribution” (Wang and Xu, 2017), provides an objective and robust theoretical basis for the identification and analysis of the leading factors of LST heterogeneity. This study, based on MODIS surface temperature data, quantitatively characterizes LST’s spatiotemporal differentiation in China in the past 20 years (2001-2020). Leveraging Geodetector, it identifies the leading factors and process mechanisms of LST changes in different eco-geographic zones, which can provide scientific references for coping with climate change, coordinating human-land relationships, and facilitating regional sustainable development.

2 Data and methods

2.1 Data source and preprocessing

We choose seventeen MOD11C3 products covering the whole China from January 2001 to February 2021 to study the spatiotemporal differentiation characteristics of LST. Additionally, a range of data, including precipitation, sunshine duration, population, NDVI, DEM and land use, selected for the analysis of LST heterogeneity attribution (Table 1).
Table 1 Data introduction
Data Time resolution Spatial resolution Data sources Introduction
China’s Ecological Geography Division (Zheng, 2008) - - Resource and Environment Science and Data Center (http://www.resdc.cn/) A total of 48 zones are divided based on temperature and humidity. To facilitate analysis, these zones are restructured into 38 zones (in SHAPE format, Figure 1) based on geomorphic characteristics and spatial adjacency relationships.
LST
(K)
2001.01- 2021.02, Monthly 5500 m LAADS DAAC
(https://ladsweb.nascom.nasa.gov/search/)
MOD11C3 (HDF format), embedded and reprojected by MRT software.
Sunshine
duration (h)
2001- 2020
Daily
1000 m The China Meteorological Data Service Center (http://data.cma.cn/) A total of 833 meteorological stations across China provided daily sunshine duration data. After removing invalid and anomalous values, the annual data is synthesized with ArcGIS, and the raster data (TIFF format) is obtained by spline spatial interpolation.
Precipitation
(mm)
2001- 2020
Annually
1000 m Resource and Environment Science and Data Center (http://www.resdc.cn/) Based on daily observation data from over 2400 meteorological stations nationwide, a spatial interpolation dataset of annual average temperatures in China since 1980 is generated (GRID format) by sorting, processing, and using ANUSPLIN interpolation software.
Population (Xu, 2017)
(person/km²)
2015 1000 m Based on the weighted calculation of the population statistics of administrative units combined with land use type, nighttime light intensity, and residential density, the kilometer grid dataset of China’s population spatial distribution is obtained (GRID format). This dataset can characterize the spatial distribution of China’s population and quantitatively depict the intensity of human activities.
Land use
(Xu, 2018)
2020 1000 m China Multi-Temporal Land Use and Land Cover Change Remote Sensing Monitoring Dataset (CNLUCC) is generated based on the interpretation of 2020 Landsat 8 satellite images (GRID format). This dataset follows a primary classification system with cultivated land, forestland, grassland, water bodies, urban and rural/industrial and mining/residential land, unused land, and marine areas.
DEM
(m)
- 250 m The spatial distribution data of China’s elevation (DEM) is generated by resampling SRTM V4.1 data (GRID format). Using ArcGIS 10.3, slope, aspect, and degree of relief data were extracted.
NDVI
(Xu, 2018)
2001- 2018 Annually 1000 m The spatial distribution data set of China’s annual vegetation index (NDVI) is synthesized by the MVC method (TIFF format) based on SPOT/VEGETATION and MODIS data.

Note: All data, except for land use data, are resampled to 5.5 km × 5.5 km resolution.

(1) Unit conversion of MOD11C3 data
$LST=DN\times 0.02-273.15$
where LST is the land surface temperature value (℃), and DN is the pixel grayscale value (K).
(2) Synthesis of monthly, seasonal, and annual average LST data
MOD11C3 includes both daytime and nighttime land temperature data. The LST daily, monthly, quarterly, and yearly averages are calculated using the arithmetic mean method. Specifically, March to May is the spring, June to August is the summer, September to November is the autumn, and December to February of the following year is the winter.

2.2 Research methods

2.2.1 Spatiotemporal differentiation analysis of LST

LST is one of the critical parameters for studying the surface energy balance and changes in resources and environment, which can objectively reflect the changes in the geospatial energy budget (Hu, 2013; Qiao and Tian, 2015; Qiao et al., 2019; Shen and Zeng, 2021). In this paper, LST change characteristics are analyzed using various techniques, including simple linear regression, significance test, correlation analysis, and centroid model.
(1) Change rate of LST
Regression analysis can determine the quantitative relationship of interdependence between two or more variables. The tendency rate is calculated by using the simple linear regression method to analyze the change range of LST over time.
$slope=\frac{\sum\limits_{i=1}^{n}{LS{{T}_{i}}{{T}_{i}}}-\frac{1}{n}\left( \sum\limits_{i=1}^{n}{LS{{T}_{i}}} \right)\left( \sum\limits_{i=1}^{n}{{{T}_{i}}} \right)}{\sum\limits_{i=1}^{n}{{{T}^{2}}_{i}}-\frac{1}{n}{{\left( \sum\limits_{i=1}^{n}{{{T}_{i}}} \right)}^{2}}}$
where slope is the slope of the one-variable linear regression equation; Ti is the time variable, n is the research period, with a value of 20 in this paper. LSTi is the land surface temperature value of China in the i year. slope < 0 and slope > 0, respectively, indicate that LST decreases and increases over the study period. The larger the absolute value, the faster the rate of LST rise/fall.
(2) Significance test and analysis
The significance test is used to describe the potential difference in equation fitting caused by sampling errors and can be used to verify and describe the fitting effect of LST with time in equation (2). The slope obtained in equation (2) is tested for significance by using the F test. The larger the F is, the better the fitting effect is, and the more precise the LST change trend is.
$F=U\frac{n-2}{Q}$
$U=\sum\limits_{n=1}^{n}{{{\left( {{{\hat{y}}}_{i}}-\bar{y} \right)}^{2}}}$
$Q=\sum\limits_{n=1}^{n}{{{\left( {{y}_{i}}-{{{\hat{y}}}_{i}} \right)}^{2}}}$
where U is the sum of regression squares, Q is the sum of residual squares, yi is the land surface temperature value of the i-th year, ${{\hat{y}}_{i}}$ is its regression value, $\bar{y}$ is the LST climate average. The significance level is 0.01 and 0.05. According to the distribution table, F0.01 = 8.28, F0.05 = 4.41. When FF0.01, it is considered that the difference is extreme significance. When F0.05 < F0.01, it is considered that the difference is significance. If FF0.05, it is considered that the difference is non-significance.
(3) Correlation analysis
The correlation coefficient is employed to characterizes the strength of the relationship between LST and factors such as altitude, NDVI and other variables.
${{r}_{xy}}=\frac{\sum\limits_{i=1}^{n}{\left( {{x}_{i}}-\bar{x} \right)\left( {{y}_{i}}-\bar{y} \right)}}{\sqrt{\sum\limits_{i=1}^{n}{{{\left( {{x}_{i}}-\bar{x} \right)}^{2}}}}\sqrt{\sum\limits_{i=1}^{n}{{{\left( {{y}_{i}}-\bar{y} \right)}^{2}}}}}$
where rxy is the correlation coefficient, which ranges [-1, 1]. When rxy > 0, it indicates a positive correlation between the two variables; When rxy < 0, it suggests a negative correlation between the two variables. The larger the absolute value of rxy, the stronger the correlation.
(4) Centroid model
Use the warming and cooling zones’ centroid position and offset to analyze its seasonal movement distance, speed, and direction.
${{\bar{X}}_{w}}=\frac{\sum\limits_{i=1}^{n}{{{w}_{i}}{{x}_{i}}}}{\sum\limits_{i=1}^{n}{{{w}_{i}}}},{{\bar{Y}}_{w}}=\frac{\sum\limits_{i=1}^{n}{{{w}_{i}}{{y}_{i}}}}{\sum\limits_{i=1}^{n}{{{w}_{i}}}}$
where n is the total number of elements, wi and yi are the coordinates of the element i, wi is the weight at element i, which is the LST change rate of the corresponding pixel, ${{\bar{X}}_{w}}$ and ${{\bar{Y}}_{w}}$ is the coordinate of the centroid.

2.2.2 Geodetector

Geodetector is an effective means to test the spatial differentiation of single-factor and the coupling of multiple factors. In this paper, the factor detection module of the Geodetector is used to quantitatively detect whether factors affect the spatial heterogeneity of LST changes and determine the extent of their impact. The formula is as follows:
$q=1-\frac{\sum\limits_{h=1}^{L}{{{N}_{h}}{{\sigma }_{h}}^{2}}}{N{{\sigma }^{2}}}=1-\frac{SSW}{SST}$
where h = 1, 2, …, L is the strata of variable Y or factor X, i.e., classification or partition; Nh and N are the number of units in stratum h and the total number of units in the entire region, respectively; ${{\sigma }_{h}}^{2}$ and ${{\sigma }^{2}}$ is the variance of stratum h and the whole region Y. SSW and SST are the sum of variance within stratum and the total variance of the whole region.
The factors influencing LST change are diverse, and their process mechanism is complex. These factors can generally be classified into two main groups: natural and anthropogenic factors (Liu, 2021; Yan, 2021; Zhu et al., 2021). Natural factors mainly include climate and vegetation. Among them, climate factors such as sunshine duration and precipitation can directly affect the total amount of solar radiation received by the surface. Terrain factors such as elevation, slope, aspect, and degree of relief affect the amount of solar radiation received by the surface at different heights and directions (Yao et al., 2021b). NDVI is an essential factor of vegetation coverage on the land surface. Vegetation can directly block solar radiation from reaching the surface and also humidify and cool the surrounding environment through transpiration (Zhou et al., 2015; Li et al., 2017; Cheng et al., 2021). The intensity of human activities and the way of land use jointly characterize the anthropogenic factor. The former is characterized by the population density data weighted by the demographic data of the Chinese Academy of Sciences in combination with data such as nighttime light intensity, and residential density (Xu, 2017). The intensity of transformation to the natural environment is mainly characterized by the degree of human aggregation. The latter includes explicitly changes in physical/chemical properties of the underlying surface caused by human changes in surface land use type, thus enhancing/weakening surface absorption/reflection of solar radiation, leading to warming/cooling effects. Both of these factors can objectively describe the disturbance degree of anthropogenic factors on surface heat distribution (Gwenaël et al., 2020; Montaner et al., 2020).
The factor detection of the Geodetector is used to calculate and sort the q value of the mentioned factors in each geographical division. The higher the q value, the stronger the explanatory power of the factor for LST changes (Wang and Xu, 2017). After eliminating the factors that do not have statistical significance, the two factors with the strongest explanatory power are taken as the division criteria of the dominant type. The first factor becomes the dominant factor, and the second becomes the additional factor. If these two factors are in the same dominant type, then the third-ranking factor is selected as the additional factor, and so on. Finally, according to the contribution rate, the LST variation driving factors for each region are identified, and an attribution analysis is conducted.

3 Result and analysis

3.1 Spatiotemporal pattern and change characteristics of LST in China

3.1.1 Spatiotemporal pattern of LST in China

LST is controlled by the zonal variation of solar radiation and generally presents a macro tone of gradual decrease from south to north. The LST climate average of China in the past 20 years (2001-2020) is 9.6℃, showing significant spatial difference.
The overall pattern indicates higher LST in the southeast and northwest arid regions, lower LST in the northeast and Qinghai-Tibet Plateau, higher in plains, and lower in mountains regions (Figure 1 and Table 2). Except for D3, China’s high-value LST areas are located in the southeast, and the climate average is generally above 15℃. The highest LST value area is J2, with the climate average as high as 24℃. The north-central part of China is mainly the moderate LST area (with a climate average of 5-15℃), and the low LST area is distributed primarily in the southwest, northeast, and northwest. Only the climate average of BE1, G1, and AC1 is below 0℃, of which BE1 has the lowest temperature, at -3℃. LST decreases from the high-value areas along the southeast coast (e.g., J2, A5, C4, J1), to the low-value regions in the north of northeast (e.g., A1, B7) and northern Xinjiang (e.g., BD1) from south to north. The gradual vertical change law also restricts LST distribution. Most of the Qinghai-Tibet Plateau and the large mountains such as the Tianshan Mountains and the Da Hinggan Range have significantly low temperatures, especially the climate average of the Qinghai-Tibet Plateau is considerably lower than that of the central and eastern regions of the same latitude. D3, F1, and other zones also belong to relatively high-value areas at the same latitude due to sparse vegetation and exposed surfaces. In summary, solar radiation determines the macroscopic pattern of LST, and the altitude and underlying surface characteristics will directly affect the local surface thermal properties and heat distribution, thereby intensifying the spatial heterogeneity of LST.
Figure 1 Spatial distribution of LST climate average in China in 2001-2020

Note: Based on the production of standard map GS (2020) No.4630 on the normal map service website of the Ministry of Natural Resources of the People’s Republic of China, the boundary of the base map is not modified.

Table 2 Eco-geographic zones of China
Code and Partition name
A1: Sanjiang Plain CB1: Jiangnan Hills and Lingnan Mountains
A2: Northeast China Plain D1: Junggar Basin
A3: North China Plain D2: Ili Basin
A4: Huainan and Middle-Lower Yangtze Plain D3: Tarim and Turpan Basins
A5: Mountains, Hills and Plains of Fujian,
Guangdong and Guangxi
D4: Hanzhong Basin
AC1: Sanhe (Three Rivers) Piedmont Plain and Hills D5: Sichuan Basin
B1: Eastern Mountains of Northeast China D6: Qaidam Basin
B2: South Slope of Eastern Himalayas D7: Southern Shanxi and Guanzhong Basins
B3: Eastern Qinghai-Qilian Mountains E1: Plateau Areas in Central Shanxi, Northern Shaanxi
and Gansu
B4: South-Xizang Mountains E2: Guizhou Plateau
B5: North Slope of Kunlun Mountains E3: Yunnan Plateau
B6: Ngari Mountains E4: Golog and Nagqu Hilly Plateau
B7: Da Hinggan Range EA1: Inner Mongolia High Plain
BD1: Altay Mountains and Tacheng Basin F1: Alxa Region and Hexi Corridor
BE1: Mountains and Plateaus of Kunlun Mountains G1: Southern Qinghai Plateau and Wide Valley
C1: Mountains and Hills in Liaodong and Jiaodong
Peninsulas
H1: Qiangtang Plateau and Lake Basins
C2: Mountains and Hills in central Shandong I1: High Mountains and Deep Valleys in Western Sichuan and Eastern Xizang
C3: Mountains and Hills in North China J1: Taiwan Islands
C4: Valley and Hills in Southern Yunnan J2: Lei (Leizhou Peninsula)-Qiong (Hainan Island) Islands
To further explore the spatial correlation between LST and DEM of the three steps of China’s terrain along the latitude, section lines of LST and DEM along the 34°N latitude line adjacent to the “Qinling Mountains-Huaihe River Line” are created (Figure 2). Obviously, LST is significantly negatively correlated with altitude, with a correlation coefficient of -0.66. This means that as the altitude gradually ascends from the Third Ladder to the First Ladder, LST shows a significant decreasing trend. The negative correlation between them is the most pronounced in the First Ladder, followed by the Second Ladder, while it appears weaker in the Third Ladder. Taking 100 meter as the altitude gradient, the LST lapse rate of each step is calculated through regional statistics (Table 3). According to the altitude gradient zone, the average lapse rate of LST in China is 0.41℃/100 m. The Second Ladder, mainly characterized by plateaus and large basins, contains a series of mountains in adjacent regions to the First and the Third ladders, with significant terrain relief. As a result, the LST decrease with altitude is most pronounced, reaching up to 0.57℃/100 m. The First Ladder, which includes the Qinghai-Tibet Plateau, with an average elevation of over 4000 m, experiences a lower LST change rate of 0.44℃/100 m than the Second Ladder. This is because the peripheral areas like the mountains and valleys in Sichuan-Xizang region and Qilian Mountains have severe surface fluctuation with a large elevation drop, while the Qiangtang Plateau, southern Tibetan valleys, and Qaidam Basin have relatively low terrain relief. The Third Ladder, characterized by flat and open terrain, exhibits limited impact from altitude on LST change. Here, LST changes are mainly affected by underlying surface factors like human activities and vegetation. As a result, the vertical lapse rate of LST is only 0.15℃/100 m. The overall spatial pattern of LST in China shows significant regional differences according to topography and landforms, especially in mountain-basin regions and high-altitude areas. The altitude factor weakens the decreasing trend of LST along the latitude of solar radiation in China, resulting in the spatial differentiation pattern with low temperature or high temperature in the same latitude.
Figure 2 Section line at 34°N about LST and DEM
Table 3 Correlation between LST and DEM
Region Correlation coefficient The decline rate of altitude gradient (℃/100 m)
China -0.66 0.41
The First Ladder -0.76 0.44
The Second Ladder -0.29 0.57
The Third Ladder -0.17 0.15

3.1.2 China’s LST interannual change

Over the 20 years period, the LST change rate of China is 0.21℃/10 a, and the warming area accounts for 78% of the land area, demonstrating a spatial characteristic of “multi-core warming and axial cooling” (Figure 3a).
Figure 3 Spatial variation and statistical results of LST in China

Note: Based on the production of standard map GS (2020) No.4630 on the standard map service website of the Ministry of Natural Resources of the People’s Republic of China, the map boundaries remain unaltered.

The warming zone is primarily concentrated in regions like the Yangtze River Delta, North China Plain, Sichuan Basin, southeastern Xizang, and most of Inner Mongolia, among which AC1 (0.54℃/10 a) has the extreme significance of warming trend. The cooling area is concentrated along three axes of “Kunlun Mountains-Qaidam Basin’s southern margin”, “Circum-Northeast China Plain-Da Hinggan Range-Taihang Mountains-Qinling Mountains” and “Circum-Sichuan Basin-eastern margin of Yunnan-Guizhou Plateau”. These cooling axes intersect to form a “Y” shape in the western part of the Hanzhong Basin. Additionally, the Ngari Mountains and South-Xizang Mountains experienced significant cooling. The cooling areas are predominantly located in areas adjacent to mountain ranges and plateaus, with the highest cooling range being B6 (-0.13℃/10 a). The LST change rate of the Guizhou Plateau is only 0.002℃/10 a, which can be classified as a stable LST area and will not be discussed further in this context.
In terms of the distribution characteristics of the warming areas, the warming/cooling characteristics of A4, A3, and A5 are similar (Figure 3a), with urban clusters such as the Yangtze River Delta, Beijing-Tianjin-Hebei Urban Agglomeration and Pearl River Delta as their warming cores. The significance test reaches significance/extreme significance (FF0.01) (Figure 3b), of which A4 has the most intense warming effect at 0.3℃/10 a. There are also two warming zones in the high plains in the northern and southwestern central of China, mainly located in F1, EA1 of Inner Mongolia and Northeast China, and I1, E4, B4, and H1 in the southern and central parts of the Qinghai-Tibet Plateau. The cooling zone in China mainly occurs in mountain areas. However, it is worth noting that there are many warming patches (Figure 3a) in the Tianshan Mountains area of Xinjiang, with extreme significance (FF0.01) (Figure 3b), especially in the western part of D2. This phenomenon may be attributed to accelerated glacier melting and increased rock exposure in the context of climate warming, which results in the absorption of more solar radiation and generates localized warming in these areas (Guan et al., 2015). Especially, D5 Sichuan Basin, as a typical warming core, is embedded in the central-southern part of China’s “Y”-shaped cooling zone. Its LST change rate is 0.24℃/10 a, and its warming core area is positioned in the southwestern part of the basin in the shape of “the last quarter moon”. This distribution feature is closely attributed to the specific characteristic of its mountain-basin topography.
The LST in China, as a whole, is in a warming state characterized by high intensity and extensive coverage. The “Y” shaped cooling belt along the mountain ranges divides the warming areas into three main parts: the northern basin-high plain belt warming area, the southwest plateau-embedded valley warming area, and the simple eastern plain-basin multi-core gathering warming area. There is a trend that the multi-core diffusion is in a zonal region, the cooling power is low, and the distribution is in the direction of fragmentation and marginalization.

3.1.3 Seasonal differentiation of LST in China

LST and its variation in China have significant seasonal differences (Figure 4). The LST climate averages for spring and autumn are 11.08℃ and 10.05℃, respectively (Table 4). Their spatial distribution is similar, with low values distributed in the Qinghai-Tibet Plateau and Northeast China. The LST climate average of summer is 21.02℃, indicating a high-temperature area except for the Qinghai-Tibet Plateau, especially evident in the northwest arid region. The LST climate average of winter is -4.39℃, characterized by “high in the south and low in the north”, with the “Qinling Mountains-Huaihe River Line” area as the boundary. The standard deviation of LST in winter is 10.38 (Table 4), which is the season with the most pronounced regional temperature difference among all four seasons.
Figure 4 Spatial distribution and variation of LST in different seasons

Note: Based on the production of standard map GS (2020) No.4630 on the normal map service website of the Ministry of Natural Resources of the People’s Republic of China, the map boundaries remain unaltered.

Table 4 Seasonal average value and change rate of LST in China
Season Spring Summer Autumn Winter
LST climate average (℃) 11.080 21.020 10.050 -4.390
Standard deviation of average temperature 8.030 8.640 7.730 10.380
LST rate of change (℃/10 a) 0.450 0.164 0.080 0.157
Standard deviation of propensity 0.045 0.048 0.038 0.050
Climate averages in warming zone (℃/10 a) 0.610 0.440 0.330 0.450
Climate averages in cooling zone (℃/10 a) -0.230 -0.360 -0.280 -0.310
Proportion of warming zone (%) 80.210 65.770 60.070 61.220
Proportion of cooling zone (%) 18.790 34.230 39.930 38.780
Despite the seasonal variations in LST across China, the dominant trend remains warming, with each season’s warming zone covering more than 60% of the total land area (Figure 4). The most significant warming effect is observed in spring (4.5℃/10 a), followed by summer, while autumn is the weakest, at just 0.08℃/10 a (Table 4). The spring warming area accounts for 80%, with the northern regions experiencing higher warming amplitude and coverage compared to the southern regions, mainly including the Da Hinggan Range, Taihang Mountains, Yinshan Mountains, Qilian Mountains, and the northern part of Tianshan Mountains. Additionally, the North China Plain, Shandong Peninsula, Jianghuai Plain, and Southwest Mountain and Basin also exhibit a higher significance level (F0.05 < F < F0.01). In summer, the warming zone decreases notably to 65%, with relatively minor changes in the eastern areas compared to spring. However, the warming intensity increases in the basins and plateaus west of the Qilian Mountains and Hengduan Mountains, with a higher significance level, while the warming intensity of the Sichuan Basin decreases compared to spring, but remains at a relatively high significance level (Figure 4). The notable cooling in the Northeast China Plain may be closely related to the Northeast Cold Vortex, which leads to increased and intensified continuous rainy and overcast days during the summer (Liu et al., 2015), contributing to a significant cooling effect on LST. In autumn, the warming zone further reduces to 60.07%, with more prominent cooling observed in the Sichuan Basin and Xinjiang, especially in northern Xinjiang. In winter, the size of warming areas increases slightly, such as Xinjiang, Northeast China, and the Sichuan Basin. However, the Qinghai-Tibet Plateau experiences significant cooling, especially in South-Xizang Mountains and Golog-Nagqu Regions.
On the whole, LST changes in most regions of China fluctuate slightly with seasons. The seasonal warming/cooling trends of LST in the Qinghai-Tibet Plateau, Xinjiang, and Northeast China can provide valuable insights into climate sensitivity and indicative patterns.
The trajectory of the centroid provides an intuitive representation of the seasonal transfer patterns of China’s LST warming/cooling zones. From 2001 to 2020, the centroids of both warming and cooling regions follow circular trajectories with a corresponding seasonal reversal in direction (Figure 5). The centroid of the warming area moves southwest from spring to summer, while the centroid of the cooling area moves toward the northeast. The centroid of the warming area exhibits a predominant seasonal northward movement, with the largest displacement observed from autumn to winter. This indicates that the warming amplitude in the northern regions is greater than that in the southern regions, resulting in more significant warm winters at higher latitudes. On the other hand, the centroid of the cooling zone mainly moves seasonally southward, with the largest displacement from spring to summer. This suggests that the northeastern regions experience more significant cooling during the summer, particularly in comparison to the southern areas. The centroids of both warming and cooling regions exhibited minimal displacement from summer to autumn, and the centroids of spring and winter are also relatively close. Considering the magnitude of centroid displacement, the cooling zone shows a greater extent of movement, indicating significant regional differences and seasonal variations, which are associated with the dispersion and fragmentation of its spatial distribution. In contrast, the warming area exhibits lower levels of regional variation and seasonal variability, further confirming the prevailing warming trend of LST across China.
Figure 5 Trajectory of centroid in warming/cooling zones in different seasons, China

3.2 Identification of dominant factors of LST change in China

Utilizing Geodetector and sorting factor q value, we can determine the dominant factors, types, and their interactions contributing to LST changes in China. The analysis reveals that the dominant factors affecting LST changes in China can be categorized into natural factors (climate, terrain, vegetation) and human-induced factors (Figure 6). Simultaneously, influenced by combinations, superposition, and intensities of these factors, the enhancing/weakening of LST in different geographical regions presents specific differences and regularity.
Figure 6 The factor detection results of LST change rate and the division of dominant types
The pattern and evolution of LST of different regions result from the interaction of many factors. The number of warming regions of China dominated by climate factors reaches up to 16, and areas dominated by human activities, vegetation cover, and terrain are 7, 3, and 6, respectively (Figure 6). Considering the overall impact of different combinations of climatic-dominant factors, it is observed that the contribution rate of sunshine duration to LST change is slightly higher than that of precipitation. For instance, in the B2 zone, sunshine duration has an overwhelmingly dominant effect, contributing 59.95% to LST change. However, in some zones, there are cases where the contribution rates of sunshine duration and precipitation are close or where precipitation exhibits a slightly significant effect. For example, in BD1 and D2 zones, the contribution rates of sunshine duration are 22.76% and 12.74%, while precipitation contribution rates are 25.18% and 18.28%, indicating a comparable influence of both factors on LST. In the B5 zone, the contribution rate of precipitation is notably higher at 39.37% compared to sunshine duration. Additionally, climate factors often combine with terrain factors to jointly influence regional warming. Among these terrain factors, elevation stands out as having a more prominent contribution, with E4 and I1 zones having elevation contribution rates as high as 23.32% and 21.06%, respectively. Furthermore, precipitation in climate factors are closely related to vegetation coverage. In zones like F1, A1, and B5, vegetation coverage contribution rate is more than 18%, indicating a dual impact of precipitation and vegetation coverage on LST increases. Among the climate-human activity combination types, except for the A3 zone, where precipitation’s contribution rate (36.42%) is much higher than sunshine duration (6.9%), other regions are primarily influenced by a combination of climate factors controlled by sunshine duration with the intensity of human activity, for regional warming. In terrain-dominated warming zones, elevation is the primary controlling factor, such as zones like H1 and G1. For the C1 zone, degree of relief and elevation exhibit similar contribution rates. In warming zones dominated by vegetation, except for the B4 zone where human activity intensity has a contribution rate of 24.1%, other areas are significantly influenced by the combination of elevation in terrain factors and sunshine duration in climate factors. Human activity-dominated regions are often affected considerably by elevation factors; with D7, C2, and C3 zones having elevation contribution rates of 33.0%, 19.66%, and 17.22%, respectively. The impact of human activity intensity on LST changes shows regional differences, with the eastern region having significantly more warming zones dominated by human activity than the central and western regions, and variations in the forms of dominant factors’ combinations in each region.
In cooling regions of China, the main factors influencing LST are climate and vegetation, with both sunshine duration and precipitation contributing significantly. However, terrain factors have a relatively smaller impact in these areas. For example, in the B6 and A2 zones, the combined contribution of climate factors is notably high, with rates of 74.01% and 55.86%, respectively. In the E1 zone, the contribution rate of vegetation and precipitation factors are relatively close, at 34.15% and 27.51%, respectively. Only the D4 zone is considered human-dominated, with a contribution rate of 24.24%, while precipitation factors also have a substantial contribution rate of 20.93%.
Overall, the LST change factors of warming/cooling regions in China exhibit diverse dominant types and combinations. However, there are still some regularities in the intensity of the factors influencing LST in different geographical regions. Regions dominated by climate-terrain and climate-vegetation combinations are the most and have the largest area. In climate-dominated areas, sunshine duration has the highest contribution, and these regions are often located in plateaus and mountain-basins. In terrain-dominated areas, elevation has the highest contribution. In human-dominated areas, changes in land use due to human activities directly impact the conversion of surface materials and energy in populated areas. Therefore, the combination of human activities and terrain leads to a more common type of warming. Driven by periodicity, regularity, zonality, and locality, these dominant factors are coupled and closely interact, forming the spatiotemporal differentiation in LST and its changes across different geographical regions.

3.3 Attribution analysis of spatial heterogeneity of LST change in China

The terrain and topography have a profound impact on China’s climate, hydrology, vegetation, and population distribution. The LST increase/decrease types under the ecological, geographical zones also generally exhibit significant clustering/differentiation characteristics along the topographical boundaries (Figure 7). Therefore, this study uses the three steps of China’s terrain as the basic framework to conduct the spatial correlation analysis between LST and the dominant factors mentioned earlier. The aim is to explore the spatial heterogeneity of LST in China and the reasons for its changes.
The first ladder consists mainly of plateaus and mountains, and it is a highly sensitive area to global climate change and serves as a warning zone (Liu et al., 2015). In this area, the dominant factors behind LST changes are mostly climate-terrain. The second ladder comprises the “mountain-basin” complexes and high plains, serving as an important transitional zone for climate and ecology in China (Chen et al., 2019). In this region, the dominant factors affecting LST changes are predominantly climate-vegetation. The third ladder primarily includes plains and hills, and it is the main region for population concentration in China, housing several major urban agglomerations. Here, the dominant factors for LST changes are mainly human activities in combination with terrain/climate. On the whole, the two major dominant types, natural and human-induced, exhibit a clear and distinct spatial distribution feature (Figure 7). The boundary between these two types aligns closely with the spatial pattern of population, coinciding with the “Heihe-Tengchong Line”. This line is not only an important boundary for the natural geographical patterns such as climate, vegetation, and topography but also separates the large-scale social and economic factors like population, transportation, energy, urbanization rate, and the Gross National Product (GNP) (Hu, 1935; Qi et al., 2015; Fang, 2020). Therefore, in the following sections, we will specifically analyze the reasons for LST changes on either side of this classic and crucial geographical boundary.
The region to the east of the “Heihe-Tengchong Line” (hereinafter referred to as the “eastern region”) is primarily influenced by the dominant factors of human activity intensity in conjunction with terrain affecting LST changes within this region (Figure 7). Over a long period, China’s regional development has exhibited an uneven pattern due to various factors such as natural conditions and historical human development. The eastern region is characterized by relatively flat and open terrain with a favorable climate and significantly higher population density than the western regions. The transformation of the surface in this region has been more thorough and has a deep-rooted history, where people have adapted, harnessed, and shaped the natural environment over time. This has led to the creation of stable and habitable urban clusters or economic circles of varying sizes, forming a unique human ecosystem. The intensity of human activity in the eastern region is significantly higher than in the surrounding areas, altering the “source-sink” pattern of the heat balance in the natural environment (Wu et al., 2020). The underlying surface plays a crucial role in the formation of climate. It significantly impacts surface heat, momentum, water vapor exchange, and the land-atmosphere interaction (Hu, 2013; Ren et al., 2021; Yang et al., 2021). For example, human-made impervious surfaces, with their high heat absorption rate, low specific heat capacity, and the radiation interception effect of urban construction (Qiao and Tian, 2015; Shen and Zeng, 2021), contribute to the higher heat storage characteristics. Moreover, the heat continuously released by human production and daily life, along with the atmospheric insulation and inversion effect caused by greenhouse gas emissions (Qiao et al., 2019), and the distribution and succession of vegetation that are significantly affected by human activities (Qiao and Tian, 2014; Li et al., 2016), which directly or indirectly affect the heat balance and its spatial distribution continuously of the cities and surrounding areas, and are easy to form unique local climate models, such as the heat island effect, rain island effect, and more. As the Sixth Assessment Report of the IPCC indicates, in the context of global warming, some aspects of climate change may be amplified in urban areas and their surroundings (Hu and Sun, 2021; Wang and Fu, 2021). In the eastern region, LST warming driven by human factors is explicit (Figure 7). This warming effect is typically centered around urban clusters and economic circles, and it rapidly diminishes with distance, resulting in a relatively limited scope of influence. The terrain (primarily elevation) indirectly affects LST through its foundational constraints on population distribution and activity intensity. The cooling areas in this region are often associated with the increase and intensification of precipitation events in the monsoon regions against the background of global warming.
Figure 7 Dominant types of LST variation based on eco-geographic zones in China

Note: Based on the standard map service website GS (2019) No.1819 of the Ministry of Natural Resources of the People’s Republic of China, the map boundaries remain unaltered.

The region to the west of the “Heihe-Tengchong Line” (hereinafter referred to as the “western region”) mainly includes the Qinghai-Tibet alpine region and the non-monsoon region. In these regions, the climate is less affected by the ocean, and terrestrial circulation plays a significant role. The vegetation is sparse, and the population is relatively low, resulting in weaker human activity intensity. The underlying surface is predominantly shaped by natural factors, making natural factors the main drivers of LST changes within the region (Figure 7). In the western region, climate factors are the primary drivers of land surface warming, with the combination effects of terrain, vegetation cover, and human activities enhance/weaken LST change range. Among climate factors, sunshine duration directly indicates the duration of solar radiation received by the surface and significantly influences land surface warming. Its impact on LST is more significant than that of precipitation. In the western region, the change rate of sunshine duration is 11.67 h/a. Except for B6 zone, where LST shows a cooling trend due to the significant decrease in sunshine duration, most other areas have seen an increase. High-altitude regions, due to complex terrain and fragile ecology, experience significant energy transformation and material transport of the underlying surface (Hu and Sun, 2021; Wang and Fu, 2021). These include extensive permafrost melting, reduction in seasonal snow cover, and continuous glacier melting, leading to heat absorption processes that put LST in a phase of temporary cooling. However, as the surface albedo decreases and the solar radiation absorption capacity increases after the ice and snow melt, it becomes more prone to transitioning into a sustained warming state (Yao et al., 2021a). Vegetation is a crucial indicator of regional ecological sensitivity and vulnerability, and it plays an irreplaceable role in the process of LST change. Generally, vegetation reduces the amount of solar radiation reaching the land surface by reflecting and absorbing part of the solar radiation, resulting in a significant negative correlation between vegetation changes and LST changes (Liu, 2021). Particularly, in the arid/semi-arid regions of the western area, human activities related to agriculture, forestry, and ecological restoration have contributed to lowering regional LST. For example, man-made cooling patches have appeared along the inland river basins in D1 and D3 zones, but due to the extensive Gobi desert and barren land areas with sparse vegetation, and limited human activity, the overall trend still reflects LST warming. The dominant type of warming in this region is terrain and human activity-driven, which is significantly different from the surrounding mountains and plains. This demonstrates that while natural factors still dominate LST changes in China over 20 years, the driving effect of human activities should not be underestimated.
To sum up, at the current stage, the dominant factors affecting LST changes across China exhibit significant regional differences, with the “Heihe-Tengchong Line” acting as a boundary that separates these variations. Various combinations of factors have jointly shaped the LST change pattern in China. As a relatively stable background factor, the terrain factor directly affects LST through fixed constraints such as elevation variation, sunny slope and shady slope, peak and valley terrain, and other relatively constant factors. The climatic effects of high mountain terrain further complicate LST changes. On the other hand, important natural factors such as sunshine duration and vegetation coverage mainly affect LST through their effects on the increase/decrease of solar radiation, covering a broad range and exhibiting strong, relatively stable, though somewhat fluctuating, impacts that can be offset by energy gains and losses. Human factors in eastern regions radiate outward from urban centers with a relatively small impact radius, and this impact diminishes rapidly with distance. They exhibit cyclic and stochastic changes across various time scales, such as hour, week, month, season, heating season, and non-heating season variations. The LST change in China from 2001 to 2020 shows that human factors can enhance/weaken the impact of some natural processes. As indicated by the Sixth Assessment Report of the IPCC, human activities have a significant effect on the multi-layer climate system, and the extent of its impact is likely to determine the direction of future regional climate change (Hu and Sun, 2021; Wang and Fu, 2021). Overall, the interaction of natural and human factors makes the complexity and uncertainty of climate change, which still requires further long-term monitoring and in-depth exploration.
Global warming is a worldwide climate issue, but the magnitude of warming exhibits spatiotemporal variations, and greenhouse gases undergo migration and transformation at various scales. Although this study’s LST change attribution analysis is based on the background of global warming, it does not provide a quantitative or regional consideration. Therefore, the impact of human activities on LST in sparsely populated areas might be somewhat underestimated in this analysis.

4 Conclusions

This article, based on the MODIS land surface temperature data, analyzes the spatiotemporal patterns of surface temperature and its changes in China from 2001 to 2020. Using Geodetector in conjunction with China’s eco-geographic zones and the “Heihe-Tengchong Line”, it explored the dominant factors and causes of surface temperature changes in different regions of China. The conclusions are as follows:
(1) The LST climate average in China from 2001 to 2020 is 9.6℃, showing a general pattern of higher temperatures in the southeast and northwest regions, lower temperatures in the northeast and Qinghai-Tibet Plateau, and higher temperatures in plains compared to lower temperatures in mountainous areas. There is a negative correlation between LST and elevation, with a correlation coefficient of -0.66. The two variables had the most significant negative correlation in the first ladder, with a lapse rate of 0.57℃/100 m. However, in the third ladder, a weaker positive correlation was observed. Solar radiation determined the macroscopic pattern of land surface temperature, while elevation and underlying surface characteristics intensified and refined the spatial heterogeneity of LST.
(2) The change rate of LST in China from 2001 to 2020 is 0.21℃/10 a, with 78% of the country’s land area experiencing warming, demonstrating the spatial characteristics of “multi-core warming and axial cooling”. The warming area radiated outwards from the cores, mainly encompassing the Yangtze River Delta, North China Plain, Sichuan Basin, southeastern Xizang, and most of Inner Mongolia. The cooling area is concentrated along three axes of “Kunlun Mountains-Qaidam Basin’s southern margin”, “Circum-Northeast China Plain-Da Hinggan Range-Taihang Mountains-Qinling Mountains” and “Circum-Sichuan Basin-eastern margin of Yunnan-Guizhou Plateau”. These cooling axes intersect to form a “Y” shape in the western part of the Hanzhong Basin, with a fragmented and marginal distribution trend.
(3) LST and its changes in China have significant regional differences and seasonal variations. The spatial distribution of average value in winter and summer differs significantly from other seasons and shows more noticeable fluctuations. The centroid trajectory of the seasonal warming/cooling area is close to a loop shape and displays corresponding seasonal reverse movement. Cooling areas exhibit more substantial centroid movement, indicating greater regional variation and seasonal variability, which is associated with the dispersion and fragmentation of its spatial distribution.
(4) China’s LST change factors exhibit diverse dominant types and combinations, with natural factors such as climate-terrain and climate-vegetation being the predominant types of LST change sunshine duration and elevation are key factors. The spatial distribution of regions with natural and human-induced dominance coincides with the “Heihe-Tengchong Line”. In the eastern region, human activity intensity is the dominant factor, working in conjunction with terrain factors. In the western region, natural factors dominate, coupled with climate, terrain, and vegetation, enhance/weaken the magnitude of LST changes.
[1]
Bao Y S, Yan J, Min J Z et al., 2014. Agricultural drought monitoring in north Jiangsu by using temperature vegetation dryness index. Transactions of the Chinese Society of Agricultural Engineering, 30(7): 163-172, 294. (in Chinese)

[2]
Chen F, Li H B, Zhang A L, 2019. Ecological risk assessment based on terrestrial ecosystem services in China. Acta Geographica Sinica, 74(3): 432-445. (in Chinese)

DOI

[3]
Cheng D N, Wang Y Q, Cheng Y X et al., 2022. Vegetation-water vapor-land surface temperature correlation analysis of typical deserts and oases in Xinjiang. Arid Land Geography, 45(2): 456-466. (in Chinese)

[4]
Ding H, Xing M H, 2021. Spatiotemporal change and drivers analysis of desertification in the arid region of northwest China based on geographic detector. Environmental Challenges, 4: 100082.

DOI

[5]
Dong Y, Yin D Q, Li X et al., 2021. Spatial-temporal evolution of vegetation NDVI in association with climatic, environmental and anthropogenic factors in the Loess Plateau, China during 2000-2015: Quantitative analysis based on geographical detector model. Remote Sensing, 13(21): 4380.

DOI

[6]
Dong Y X, Xu Q, Yang R et al., 2018. Determinants and identification of the northern boundary of China’s tropical zone. Journal of Geographical Sciences, 28(1): 31-45.

DOI

[7]
Fang C L, 2021. The Bo-Tai Line: Establishing the concepts of a balanced regional development line and a national development backbone. Journal of Geographical Sciences, 31(6): 839-858.

DOI

[8]
Gao J B, Jiang Y, Anker Y, 2021. Contribution analysis on spatial tradeoff/synergy of karst soil conservation and water retention for various geomorphological types: Geographical detector application. Ecological Indicators, 125: 10747.

[9]
Gao M F, Qin Z H, 2006. The validation of Chinese land surface temperature products retrieved from moderate resolution imaging spectroradiometer data. Remote Sensing for Natural Resources, 3: 15-18, 88. (in Chinese)

[10]
Guan Y L, Wang R H, Li C et al., 2015. Spatial-temporal characteristics of land surface temperature in Tianshan Mountains area based on MODIS data. Chinese Journal of Applied Ecology, 26(3): 681-688. (in Chinese)

[11]
Gwenaël M, Renan L R, Pierre Gilles L et al., 2020. Mapping bioclimatic indices by downscaling MODIS land surface temperature: Case study of the Saint-Emilion area. Remote Sensing, 13(1): 4.

DOI

[12]
Hu H Y, 1935. Population distribution in China: Statistical tables and density maps are attached. Acta Geographica Sinica, (2): 33-74. (in Chinese)

[13]
Hu H Z, 2013. Study on temporal and spatial variation of surface temperature in Yangtze River Delta based on MODIS[D]. Shanghai: Shanghai Normal University. (in Chinese)

[14]
Hu M M, Wang Y F, Xia B C et al., 2020. Surface temperature variations and their relationships with land cover in the Pearl River Delta. Environmental Science and Pollution Research, 27(30): 37614-37625.

DOI

[15]
Hu T, Sun Y, 2021. Interpretation of IPCC AR6 on human influence on the climate system. Climate Change Research, 17(6): 644-651. (in Chinese)

[16]
Huang J, Gao Y, Zhao Z Q et al., 2011. Comprehensive physiographic regionalization of China using GIS and SOFM neural network. Geographical Research, 30(9): 1648-1659. (in Chinese)

DOI

[17]
Jiang J C, Liu J Z, Qin C Z et al., 2016. Near-surface air temperature lapse rates and seasonal and type differences in China. Progress in Geography, 35(12): 1538-1548. (in Chinese)

DOI

[18]
Jiang Y H, Jiao L M, Zhang B E, 2018. Scale effect of the spatial correlation between urban land surface temperature and NDVI. Progress in Geography, 37(10): 1362-1370. (in Chinese)

DOI

[19]
Kou Z X, Yao Y H, Hu Y F, 2020. Delimitation of the northern boundary of the subtropical zone in China by Geodetector. Geographical Research, 39(12): 2821-2832. (in Chinese)

DOI

[20]
Li B, Wang H M, Qin M Z et al., 2017. Comparative study on the correlations between NDVI, NDMI and LST. Progress in Geography, 36(5): 585-596. (in Chinese)

DOI

[21]
Li Y Z, Yin K, Zhou H X et al., 2016a. Progress in urban heat island monitoring by remote sensing. Progress in Geography, 35(9): 1062-1074. (in Chinese)

[22]
Li Z L, Duan S B, Tang B H et al., 2016b. Review of methods for land surface temperature derived from thermal infrared remotely sensed data. National Remote Sensing Bulletin, 20(5): 899-920. (in Chinese)

DOI

[23]
Liu G, Lian Y, Yan P C et al., 2015. The objective recognition and classification of northeast cold vortex and the northern hemisphere atmospheric circulation characters in May to August. Scientia Geographica Sinica, 35(8): 1042-1050. (in Chinese)

DOI

[24]
Liu J, 2021. Consistency evaluation of surface temperature between airs and MODIS and its spatio-temporal variation mechanism[D]. Nanjing: Nanjing University of Information Science and Technology. (in Chinese)

[25]
Liu S B, Zang S Y, Zhang L J et al., 2017. Estimation of land surface temperature from MODIS in Northeast China. Geographical Research, 36(11): 2251-2260. (in Chinese)

DOI

[26]
Ma J, Zhou J, Liu S M et al., 2017. Review on validation of remotely sensed land surface temperature. Advances in Earth Science, 32(6): 615-629. (in Chinese)

DOI

[27]
Montaner F D, Morales S L, Rodriguez J S et al., 2020. Spatio-temporal variation of the urban heat island in Santiago, Chile during summers 2005-2017. Remote Sensing, 12(20): 3345-3363.

DOI

[28]
Pan M H, Huang B, Li Y N, 2020. Analysis of spatial clustering and influencing factors of hand-foot-mouth disease in Nanning based on nuclear density and geodetector. Chinese Journal of Disease Control & Prevention, 24(11): 1269-1274, 1331. (in Chinese)

[29]
Qi W, Liu S H, Zhao M F, 2016. China’s different spatial patterns of population growth based on the “Hu Line”. Journal of Geographical Sciences, 26(11): 1611-1625.

DOI

[30]
Qiao Z, Huang N Y, Xu X L et al., 2019. Spatio-temporal pattern and evolution of the urban thermal landscape in metropolitan Beijing between 2003 and 2017. Acta Geographica Sinica, 74(3): 475-489. (in Chinese)

DOI

[31]
Qiao Z, Tian G J, 2014. Spatiotemporal diversity and regionalization of the urban thermal environment in Beijing. National Remote Sensing Bulletin, 18(3): 715-734. (in Chinese)

DOI

[32]
Qiao Z, Tian G J, 2015. Dynamic monitoring of the footprint and capacity for urban heat island in Beijing between 2001 and 2012 based on MODIS. National Remote Sensing Bulletin, 19(3): 476-484. (in Chinese)

DOI

[33]
Ren T, Zhou W Q, Wang J, 2021. Beyond intensity of urban heat island effect: A continental scale analysis on land surface temperature in major Chinese cities. Science of the Total Environment, 791: 148334.

DOI

[34]
Shen Z J, Zeng J, 2021. Spatial relationship of urban development to land surface temperature in three cities of southern Fujian. Acta Geographica Sinica, 76(3): 566-583. (in Chinese)

DOI

[35]
Sun C F, Kong F H, Yin Haiwei et al., 2014. Analysis of factors affecting mountainous land surface temperature in the summer: A case study over Mount Tai. Acta Ecologica Sinica, 34(12): 3396-3404. (in Chinese)

[36]
Wang B B, Ma Y M, Ma W Q, 2012. Estimation of land surface temperature retrieved from EOS/MODIS in Naqu area over Tibetan Plateau. National Remote Sensing Bulletin, 16(6): 1289-1309. (in Chinese)

DOI

[37]
Wang F J, Feng W L, Zhaxiyangzong et al., 2017. The comparison of FY- 3A/VIRR and TERRA/MODIS data for drought monitoring. Journal of Natural Resources, 32(7): 1229-1239. (in Chinese)

DOI

[38]
Wang J F, Xu C D, 2017. Geodetector: Principle and prospective. Acta Geographica Sinica, 72(1): 116-134. (in Chinese)

DOI

[39]
Wang M M, 2017. Methodology development for retrieving land surface temperature and near surface air temperature based on thermal infrared remote sensing[D]. Beijing: Institute of Remote Sensing and Digital Earth, Chinese Academy of Sciences. (in Chinese)

[40]
Wang W, Fu W R, 2021. The climatic impact-driver framework. Climate Change Research, 17(6): 719-725. (in Chinese)

[41]
Wu J S, He H S, Hu T, 2022. Analysis of factors influencing the “source-sink” landscape contribution of land surface temperature, Acta Geographica Sinica, 77(1): 51-65. (in Chinese)

[42]
Xu X L, 2017. Kilometer grid data set of China’s population spatial distribution. Resource and Environment Science and Data Center (http://www.resdc.cn/DOI). doi: 10.12078/2017121101. (in Chinese)

[43]
Xu X L, 2018. Spatial distribution data set of annual vegetation index (NDVI) in China. Resource and Environment Science and Data Center (http://www.resdc.cn/DOI). doi: 10.12078/2018060601. (in Chinese)

[44]
Xu X L, Liu J Y, Zhang S W et al., 2018. Multi period land use and land cover remote sensing monitoring data set in China (CNLUCC). Resource and Environment Science and Data Center (http://www.resdc.cn/DOI). doi: 10.12078/2018070201. (in Chinese)

[45]
Yan Y B, 2021. Spatio-temporal variations and driving factors of land surface temperature in China based on reconstructed remote sensing data[D]. Beijing: Chinese Academy of Agricultural Sciences. (in Chinese)

[46]
Yang G J, Sun C H, Li H, 2015. Verification of high-resolution land surface temperature by blending ASTER and MODlS data in Heihe River Basin. Transactions of the Chinese Society of Agricultural Engineering, 31(6): 193-200. (in Chinese)

[47]
Yang Z W, Chen Y B, Guo G H et al., 2021. Characteristics of land surface temperature clusters: Case study of the central urban area of Guangzhou. Sustainable Cities and Society, 73: 103140.

DOI

[48]
Yao J Q, Mao W Y, Chen J et al., 2021a. Recent signal and impact of wet-to-dry climatic shift in Xinjiang, China. Journal of Geographical Sciences, 31(9): 1283-1298.

DOI

[49]
Yao Y H, Suo N D Z, Zhang Y C, 2021b. Mountain elevation effect of the Alps and its implication for forest line. Progress in Geography, 40(8): 1397-1405. (in Chinese)

[50]
Yao Y H, Zhang B P, 2012. MODIS-based air temperature estimation in the southeastern Tibetan Plateau and neighboring areas. Journal of Geographical Sciences, 22(1): 152-166.

DOI

[51]
Yue S P, Yan Y C, Zhang S W et al., 2021. Spatiotemporal variations of soil freeze-thaw state in Northeast China based on the ERA5-LAND dataset, Acta Geographica Sinica, 76(11): 2765-2779. (in Chinese)

DOI

[52]
Zhang R Y, Liu W D, Song Z Y, 2021. Spatio-temporal evolution and driving factors of national development zones of China based on Geodetectors. Journal of Natural Resources, 36(10): 2672-2683. (in Chinese)

DOI

[53]
Zhao B, Mao K B, Cai Y L et al., 2020. Study of the temporal and spatial evolution law of land surface temperature in China. Remote Sensing for Natural Resources, 32(2): 233-240. (in Chinese)

[54]
Zheng D, 2008. System Research of Ecological Geographic Area in China. Beijing: The Commercial Press.

[55]
Zhou J, Li J, Zhang L X, 2009. Validation of algorithms for retrieving land surface temperature based on MODIS data-a case study in the upper reaches of Heihe River. Journal of Glaciology and Geocryology, 31(2): 239-246. (in Chinese)

[56]
Zhou T, Zhang Y S, Gao H F et al., 2015. Relationship between vegetation index and ground surface temperature on the Tibetan Plateau alpine grassland. Journal of Glaciology and Geocryology, 37(1): 58-69. (in Chinese)

[57]
Zhu X M, Song X N, Leng P et al., 2021. Spatial downscaling of land surface temperature with the multi-scale geographically weighted regression. National Remote Sensing Bulletin, 25(8): 1749-1766. (in Chinese)

DOI

Outlines

/