
Journal of Geographical Sciences >
Land cover change and its response to water level around Tonle Sap Lake in 1988-2020
|
Zhang Jing (1986-), PhD, specialized in ecological security and environmental remote sensing. E-mail: zhangjing537419@126.com |
Received date: 2023-03-27
Accepted date: 2023-11-09
Online published: 2024-02-06
Supported by
National Key Research and Development Program of China(2016YFA0601600)
Yunnan Scientist Workstation for Daming He International River Research(KXJGZS-2019-005)
The transboundary influence of environmental change is a critical issue in the Lancang-Mekong region. As the largest river-connected lake in the lower Mekong, the ecological change and influence of Tonle Sap Lake have received widespread attention and discussion, especially after 2008, when the hydrological regime of the Lancang-Mekong River mainstream underwent distinct changes. However, the linkage and coupling mechanism between the lake riparian environment and mainstream water level change are still unclear. In this study, the interannual spatiotemporal changes in land cover in the Tonle Sap Lake riparian zone (TSLRZ) and their relationship with mainstream water levels were analysed. The results showed that the expansion of farmland was the most notable change in 1988-2020. After 2008, the land cover changes intensified, manifested as accelerated farmland expansion, intensified woodland fragmentation and significant water body shrinkage. Furthermore, the responses of the water body, degraded land, wasteland and grassland areas to the mainstream water levels weakened after 2008. Evidently, the land cover changes in the TSLRZ in the last 30 years were less related to the mainstream water level change than to local reclamation and logging. These results can offer a new scientific basis for the transboundary influence analysis of hydrological change.
ZHANG Jing , MA Kai , FAN Hui , HE Daming . Land cover change and its response to water level around Tonle Sap Lake in 1988-2020[J]. Journal of Geographical Sciences, 2024 , 34(2) : 329 -354 . DOI: 10.1007/s11442-024-2207-1
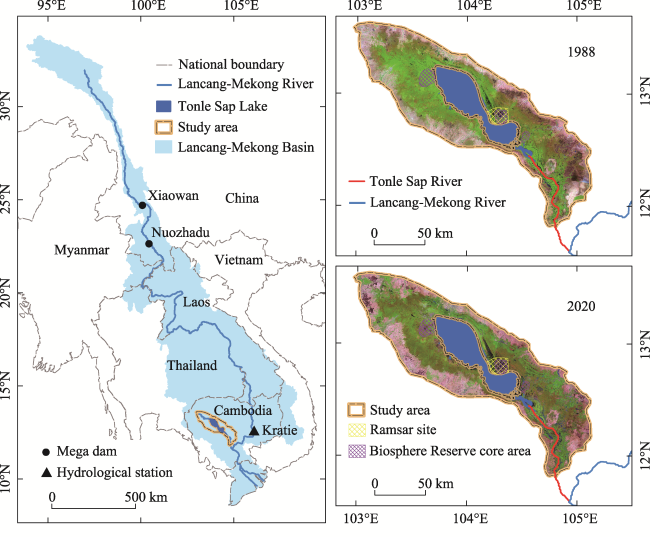
Figure 1 Location and spatial pattern of the study area. The false-colour maps of the Tonle Sap Lake riparian zone (TSLRZ) are composed of the 5, 4 and 3 bands of Landsat images, which were collected in 1988 and 2020. The extent of Tonle Sap Lake (permanent water body) was extracted from Landsat images during 1988-2020. |
Table 1 Specific information on the satellite data collected for land cover classification |
| Year | Image name, Cloud cover (%) | Image name, Cloud cover (%) | Image name, Cloud cover (%) |
|---|---|---|---|
| 1988 | LT51270511988044BKT01, 0.02 | LT05L1TP12605119880222, 0.99 | LT05L1TP12605219880309, 0.35 |
| 1989 | LT41270511989054XXX02, 0.15 | LT05L1TP12605119890224, 1.33 | LT05L1TP12605219890224, 0.04 |
| 1991 | LT51270511991036BKT00, 0.14 | LT05L1TP12605119910129, 0.01 | LT05L1TP12605219910129, 0 |
| 1992 | LT51270511992087BKT01, 1.39 | LT05L1TP12605119920304, 0.01 | LT05L1TP12605219920304, 0.01 |
| 1994 | LT51270511994028BKT01, 0.01 | LT05L1TP12605119940105, 1.31 | LT05L1GS12605219940121, 0.46 |
| 1995 | LT51270511995031BKT00, 0 | LT05L1TP12605119950209, 0.03 | LT05L1TP12605219950209, 0 |
| 1996 | LT51270511996002CLT00, 0.03 | LT05L1TP12605119960127, 0.39 | LT05L1TP12605219960127, 0 |
| 1998 | LT51270511998007BKT00, 0.04 | LT05L1TP12605119980321, 0.59 | LT05L1TP12605219980305, 2 |
| 1999 | LT51270511999026BKT00, 0.4 | LT05L1TP12605119990119, 0.88 | LT05L1TP12605219990220, 0 |
| 2000 | LT51270512000013BKT00, 1.08 | LT05L1TP12605120000326, 1.74 | LT05L1TP12605220000326, 0 |
| 2001 | LT51270512001047BKT00, 0.07 | LT05L1TP12605120010124, 1.88 | LT05L1TP12605220010124, 0 |
| 2002 | LE71270512002010SGS00, 0.02 | LE71260512002051BKT00, 0.02 | LE07L1TP12605220020220, 0 |
| 2003 | LE71270512003029SGS00, 0.01 | LE71260512003038SGS00, 0.31 | LE07L1TP12605220030207, 0 |
| 2005 | LT51270512005042BKT00, 0.7 | LT05L1TP12605120050119, 0.14 | LT05L1TP12605220050119, 0.02 |
| 2006 | LT51270512006045BKT00, 2.02 | LT05L1TP12605120060207, 0.14 | LT05L1TP12605220060207, 0 |
| 2007 | LT51270512007032BKT00, 0.01 | LT05L1TP12605120070125, 0.13 | LT05L1TP12605220070210, 0.07 |
| 2009 | LT05L1TP12705120090121, 0.98 | LT05L1TP12605120090114, 0.12 | LT05L1TP12605220090114, 0 |
| 2011 | LT05L1TP12705120110127, 1.57 | LT05L1TP12605120110120, 6.18 | LT05L1TP12605220110120, 3.12 |
| 2014 | LC81270512014035LGN00, 2.16 | LC81260512014028LGN00, 0.09 | LC08L1TP12605220140128, 0.17 |
| 2015 | LC81270512015022LGN00, 0.01 | LC81260512015015LGN00, 0 | LC08L1TP12605220150115, 0.01 |
| 2016 | LC81270512016089LGN00, 3.67 | LC81260512016034LGN00, 0 | LC08L1TP12605220160203, 0 |
| 2017 | LC08L1TP12705120170212, 0.04 | LC08L1TP12605120170205, 0.18 | LC08L1TP12605220170205, 0.78 |
| 2018 | LC08L1TP12705120180215, 0.22 | LC08L1TP12605120180312, 2.63 | LC08L1TP12605220180312, 1.12 |
| 2019 | LC08L1TP12705120190117, 0.01 | LC08L1TP12605120190211, 0.07 | LC08L1TP12605220190211, 0.01 |
| 2020 | LC81270512020020LGN00, 0.04 | LC81260512020013LGN00, 0.01 | LC81260522020013LGN00, 0.03 |
Table 2 Land cover classification system in the Tonle Sap Lake riparian zone |
| Land cover types | Sample areas | Land cover types | Sample areas |
|---|---|---|---|
| Water body |  | Woodland |  |
| Wasteland |  | Degraded land | 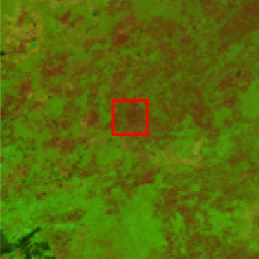 |
| Grassland |  | Farmland |  |
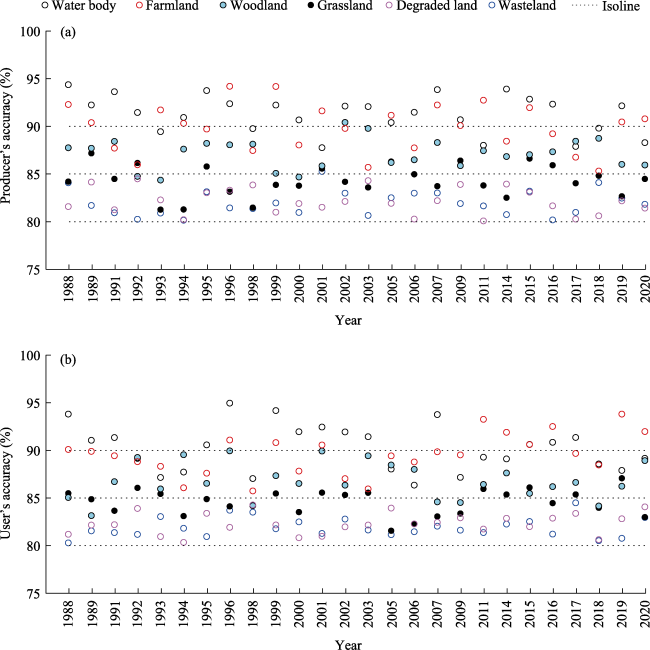
Figure 2 The accuracy evaluation results of the annual scale land cover classification maps during 1988-2020 |
Figure 3 Spatial patterns of land cover in the Tonle Sap Lake riparian zone during 1988-2020. The last picture is a schematic diagram of the belt distribution. |
Figure 4 Hot spots of land cover changes in the Tonle Sap Lake riparian zone in the whole study period (1988-2020), the prechange period (1988-2007) and postchange period (2009-2020) |
Figure 5 Structure of land cover in the Tonle Sap Lake riparian zone during 1988-2020 |
Figure 6 Change trends of various land cover types in the Tonle Sap Lake riparian zone. k denotes the linear slope. Subscripts 1, 2 and 3 correspond to the prechange period (1988-2007), postchange period (2009-2020) and the whole study period (1988-2020), respectively. p denotes significance, the significance level is set to 0.05, and * indicates p ≤ 0.05. |
Figure 7 Sankey diagrams for conversions of the areas of various land cover types in the Tonle Sap Lake riparian zone from 1988 to 2020 (a), from 1988 to 2007 (b), and from 2009 to 2020 (c) |
Figure 8 Changes in the water level of the Lancang-Mekong River mainstream. k denotes the linear slope. Subscripts 1 and 2 correspond to the two periods of 1987-2007 and 2008-2020, respectively, which indicate the period before and the period after impoundment of the Xiaowan hydropower station, respectively. p denotes significance, the significance level is set to 0.05, and * indicates p ≤ 0.05. |
Figure 9 Scatter plots of the areas of various land cover types in the Tonle Sap Lake riparian zone and the mainstream water levels. WLd, WLw and WLa represent the same meanings as those in Figure 8. |
Table 3 Spearman correlation coefficient of the areas of various land cover types in the Tonle Sap Lake riparian zone and the mainstream water levels |
| Water levels | Statistics | Study periods | Land cover types | |||||
|---|---|---|---|---|---|---|---|---|
| Water body | Wasteland | Grassland | Woodland | Degraded land | Farmland | |||
| WLd | r | 1988-2007 | 0.75* | -0.64* | -0.54* | -0.15 | -0.52* | -0.02 |
| 2009-2020 | 0.29 | -0.11 | -0.18 | 0.21 | -0.38 | -0.29 | ||
| p | 1988-2007 | 0.00* | 0.01* | 0.02* | 0.57 | 0.03* | 0.93 | |
| 2009-2020 | 0.44 | 0.78 | 0.65 | 0.59 | 0.31 | 0.44 | ||
| WLw | r | 1988-2007 | 0.68* | -0.37 | -0.29 | -0.16 | -0.42 | -0.09 |
| 2009-2020 | 0.28 | -0.18 | -0.13 | 0.30 | -0.62 | -0.17 | ||
| p | 1988-2007 | 0.00* | 0.14 | 0.26 | 0.53 | 0.09 | 0.72 | |
| 2009-2020 | 0.46 | 0.64 | 0.73 | 0.43 | 0.08 | 0.67 | ||
| WLa | r | 1988-2007 | 0.75* | -0.44 | -0.36 | -0.13 | -0.52* | -0.13 |
| 2009-2020 | 0.28 | -0.18 | -0.22 | 0.22 | -0.53 | -0.17 | ||
| p | 1988-2007 | 0.00* | 0.08 | 0.16 | 0.63 | 0.03* | 0.63 | |
| 2009-2020 | 0.46 | 0.64 | 0.58 | 0.58 | 0.14 | 0.67 | ||
Note: WLd, WLw and WLa denote the average water level during the dry season and the wet season and the annual average water level; r denotes the Spearman correlation coefficient; p denotes significance, the significance level is set to 0.05, and * indicates p ≤ 0.05. |
| [1] |
|
| [2] |
Asian Development Bank (ADB), 2019. Kingdom of Cambodia: Preparing the irrigated agriculture improvement project. https://www.adb.org/sites/default/files/project-documents/51159/51159-001-tacr-en.pdf.
|
| [3] |
|
| [4] |
|
| [5] |
|
| [6] |
|
| [7] |
|
| [8] |
|
| [9] |
|
| [10] |
|
| [11] |
|
| [12] |
|
| [13] |
|
| [14] |
|
| [15] |
|
| [16] |
|
| [17] |
|
| [18] |
|
| [19] |
JICA, 1999. Cambodia reconnaissance survey digital data (unpublished data from the Japan International Cooperation Agency).
|
| [20] |
|
| [21] |
|
| [22] |
|
| [23] |
|
| [24] |
|
| [25] |
|
| [26] |
|
| [27] |
|
| [28] |
|
| [29] |
|
| [30] |
|
| [31] |
|
| [32] |
|
| [33] |
|
| [34] |
|
| [35] |
|
| [36] |
|
| [37] |
|
| [38] |
|
| [39] |
|
| [40] |
RAMSAR, 2010. The list of wetlands of international importance. http://www.ramsar.org/.
|
| [41] |
Royal Government of Cambodia, 2010. Policy paper on promotion of paddy rice production and export of milled rice. Supreme National Economic Council, Phnom Penh.
|
| [42] |
|
| [43] |
|
| [44] |
|
| [45] |
|
| [46] |
|
| [47] |
|
| [48] |
|
| [49] |
|
| [50] |
UNESCO, 2006. Biosphere Reserves: World Network. http://www.unesco.org/mab/.
|
| [51] |
|
| [52] |
|
| [53] |
|
| [54] |
|
| [55] |
|
| [56] |
|
| [57] |
|
| [58] |
|
| [59] |
|
| [60] |
|
| [61] |
|
/
| 〈 |
|
〉 |


