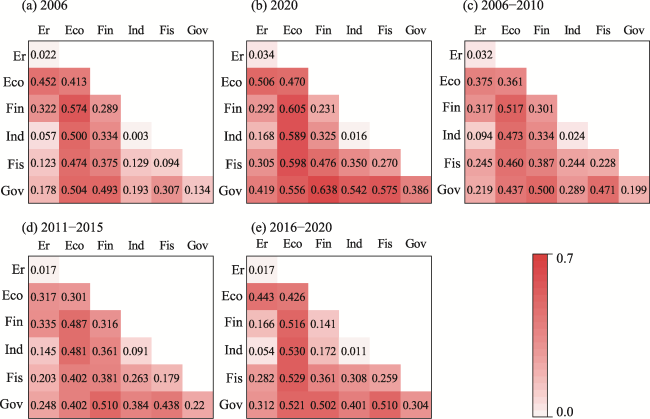
The spatiotemporal evolution of GTI in Chinese cities is a complex process influenced by multiple factors. Based on a review of literature, this study examines six key driving factors for spatial differentiation in urban GTI, namely environmental regulations (Er), economic development (Eco), financial development (Fin), industrial structure (Ind), fiscal technology expenditure (Fis), and government intervention (Gov) (
Figure 5). (1) Environmental regulations (Er): The “Porter hypothesis” suggests that appropriate environmental regulations can stimulate GTI activities within companies. It posits that companies can improve their production efficiency while achieving environmental goals, leading to “innovation compensation” (Porter and Linde,
1995; Kneller and Manderson,
2012). However, the “compliance cost theory” argues that environmental regulations can increase the production costs and reduce R&D investment (Barbera and McConnell,
1990; Wagner,
2007). Some studies have also found a “U-shaped” relationship between environmental regulations and GTI (Zhang
et al.,
2019). Referring to the study by Zhang and Chen (
2021), the frequency of environmental protection terms in government work reports is used as a proxy variable for environmental regulations. (2) Economic development (Eco): The level of economic development in a city is often indicative of the investment and accumulation of resources, including human and capital. A higher level of economic development corresponds to a greater ability to promote GTI, as measured by GDP per capita (Yu and Lyu,
2023). (3) Financial development (Fin): Financial development can increase the conversion rate of savings and investments in the economy. Furthermore, it can reduce the external financing costs of the R&D sector of companies and provide incentives for companies to increase their green R&D investments (Zhuang
et al.,
2020). This variable is measured using the number of loans from urban financial institutions as a share of GDP. (4) Industrial structure (Ind): Industrial structure influences regional technology choices. A higher proportion of clean industries within the industrial structure is generally more conducive to promoting GTI (Acemoglu
et al.,
2012; Jin and Li,
2013), as measured by the ratio of the output value of the tertiary industry to that of the secondary industry. (5) Fiscal technology expenditure (Fis): This variable reflects the government’s support for science and technology innovation. It can enhance the innovation output of enterprises by alleviating their budgetary constraints and improving their financial situation (Che
et al.,
2020). It is measured as the proportion of a city’s current year science expenditure to GDP. (6) Government intervention (Gov): Government intervention can, to a certain extent, correct distortions in the allocation of innovation resources due to market failure. According to the study by Dong and Wang (
2021), it can guide the allocation of funds to green areas such as green talent training and green technology research and development. It is measured as the proportion of the government’s general budget expenditure to GDP. The corresponding data from 2006 to 2020 were obtained from the China Urban Statistical Yearbook and the statistical bulletins of various cities. The individual missing data were filled by interpolation.

